Regime driven gas pricing dynamics
Where are global gas prices going to be in 2024, 2028 or 2032? How will inter-regional price spreads, inter-commodity correlations & price volatility evolve? Simple answer: no-one knows.
However, we have developed a probabilistic framework for analysing global gas market evolution that confronts market uncertainty.
At the core of this framework is the detailed analysis of the key sources of flexible supply & demand that set marginal prices. These include for example:
- Coal for gas switching in European power markets
- LNG demand response in Asian markets (e.g. with oil & coal linkages)
- US export contract flexibility (with Henry Hub influence).
By building up a detailed view of volume & price response for these sources of flexibility, we can model the way pricing dynamics evolve with market balance. This is much more powerful than traditional ‘Base / High / Low’ scenario price forecasting.
In today’s article we demonstrate this analysis as well as setting out impacts on asset & portfolio value. This will be our last feature article for several weeks as we take our usual pause over the summer, but we will continue to publish snapshot articles.
Big changes coming with regime shifts this decade
Let’s start with some charts. Chart 1 contains some outputs of Timera’s global gas model:
- The top panel shows the sensitivity of the JKM price to defined mtpa changes in global market balance across the next 10 years
- The bottom panel shows our modelled probability of dominant market regime across the same horizon.
Chart 1: Impact of regime evolution on market pricing
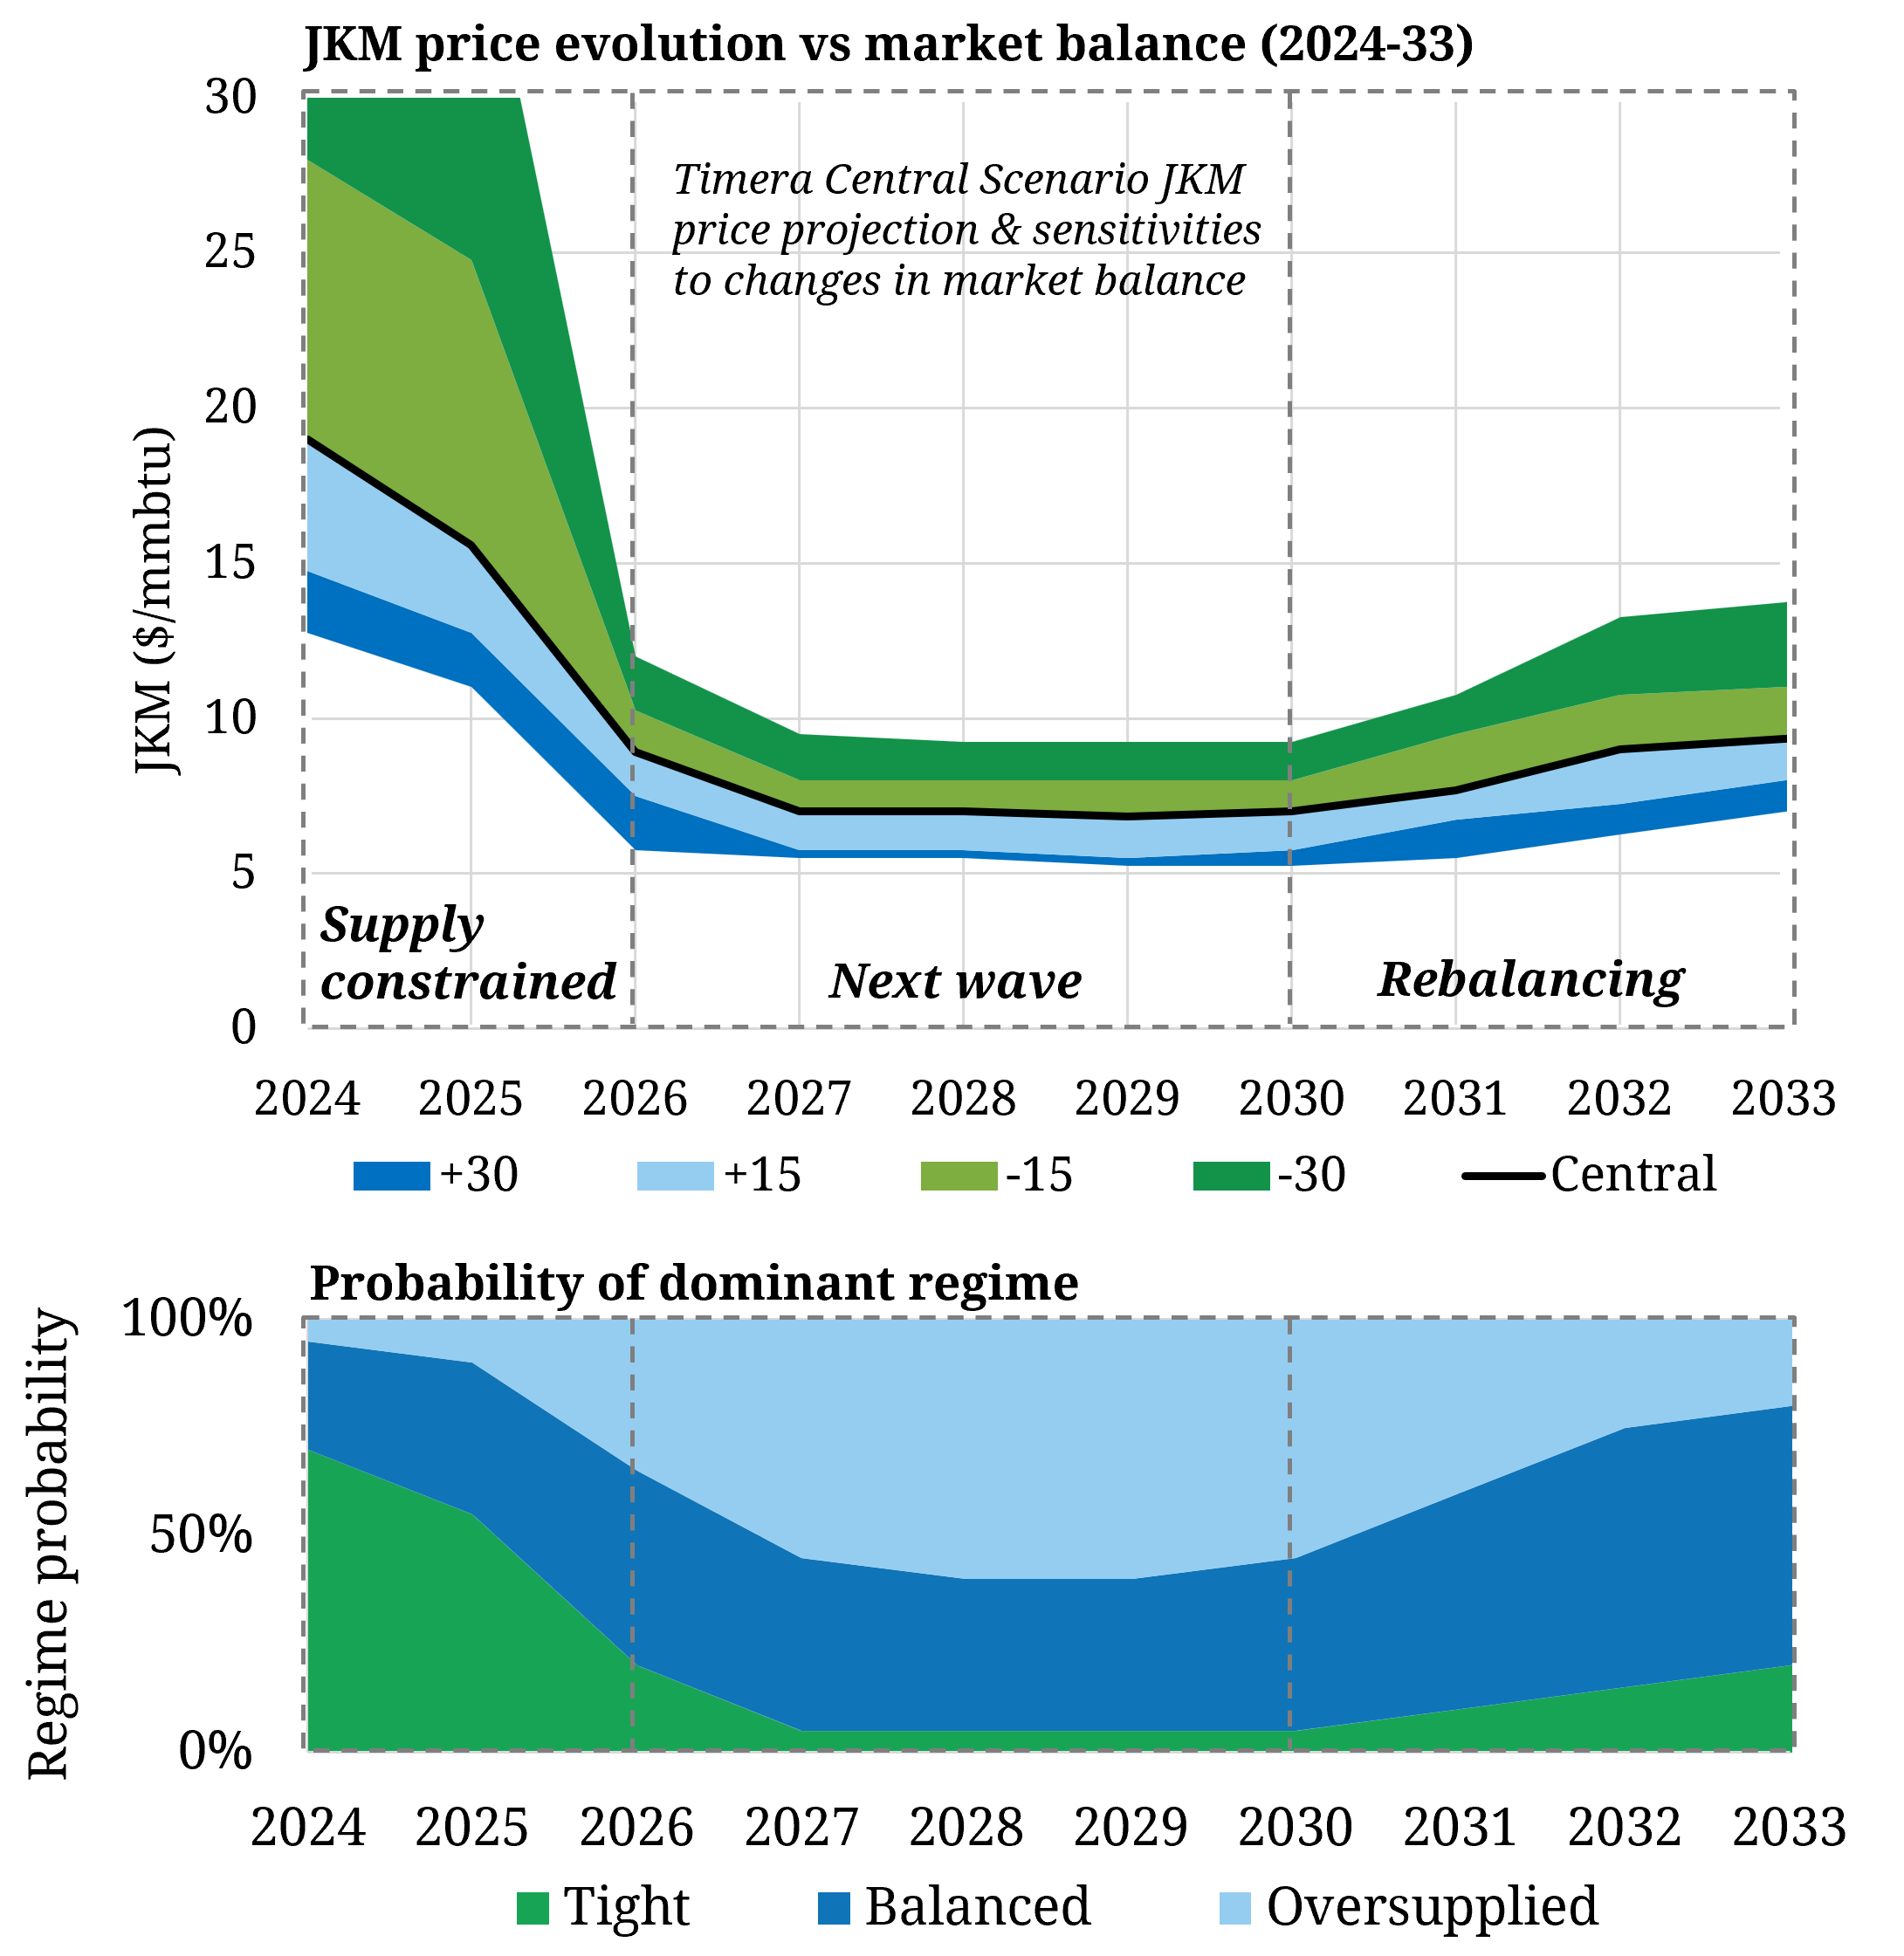
Source: Timera global gas model
We introduced our view of global gas market regime transition in a recent article. Let’s now consider how pricing dynamics may evolve as a result of this regime transition.
| Regime | Pricing dynamics |
|---|---|
| 2024-2025: ‘Supply constrained’ dominant regime = tight | • High probability global market remains in tight regime given limited supply response • Low flex response drives higher winter upside price risk • Price responsive demand likely to be on the margin setting elevated JKM & TTF price levels |
| 2026-2030: ‘Next wave’ dominant regime = oversupplied | • Higher probability to move to an oversupplied regime given large volumes of new liquefaction capacity coming online • Periods (mainly summer) of US cargo cancellations; strong global influence of Henry Hub (“soft floor”) |
| 2030-33: ‘Rebalancing’ dominant regime = balanced | • Probable return to a more balanced regime • Fuel switching anchors key (e.g. Brent, coal), with stronger influence of slower response Asian switching (given European coal closures) • Asian & European price setting dominated by marginal supply source |
Let’s challenge how this regime transition impacts market pricing dynamics across the next 3-5 years.
Price elasticity a key driver of volatility
2022 saw the highest volatility in gas market history. These extreme levels were driven by very inelastic supply & demand as the global gas market absorbed the shock of lost Russian gas exports to Europe.
A key feature of the shift in dominant regime that our global gas model is flagging in Chart 1, is an increase in price elasticity across the next 3-5 years. This can be seen in Chart 2 where we show the JKM price impact for given volume changes in global market balance.
[16:26] David Duncan
e.g Chart 2: JKM price elasticity vs market balance for 2024, 2025 & 2026
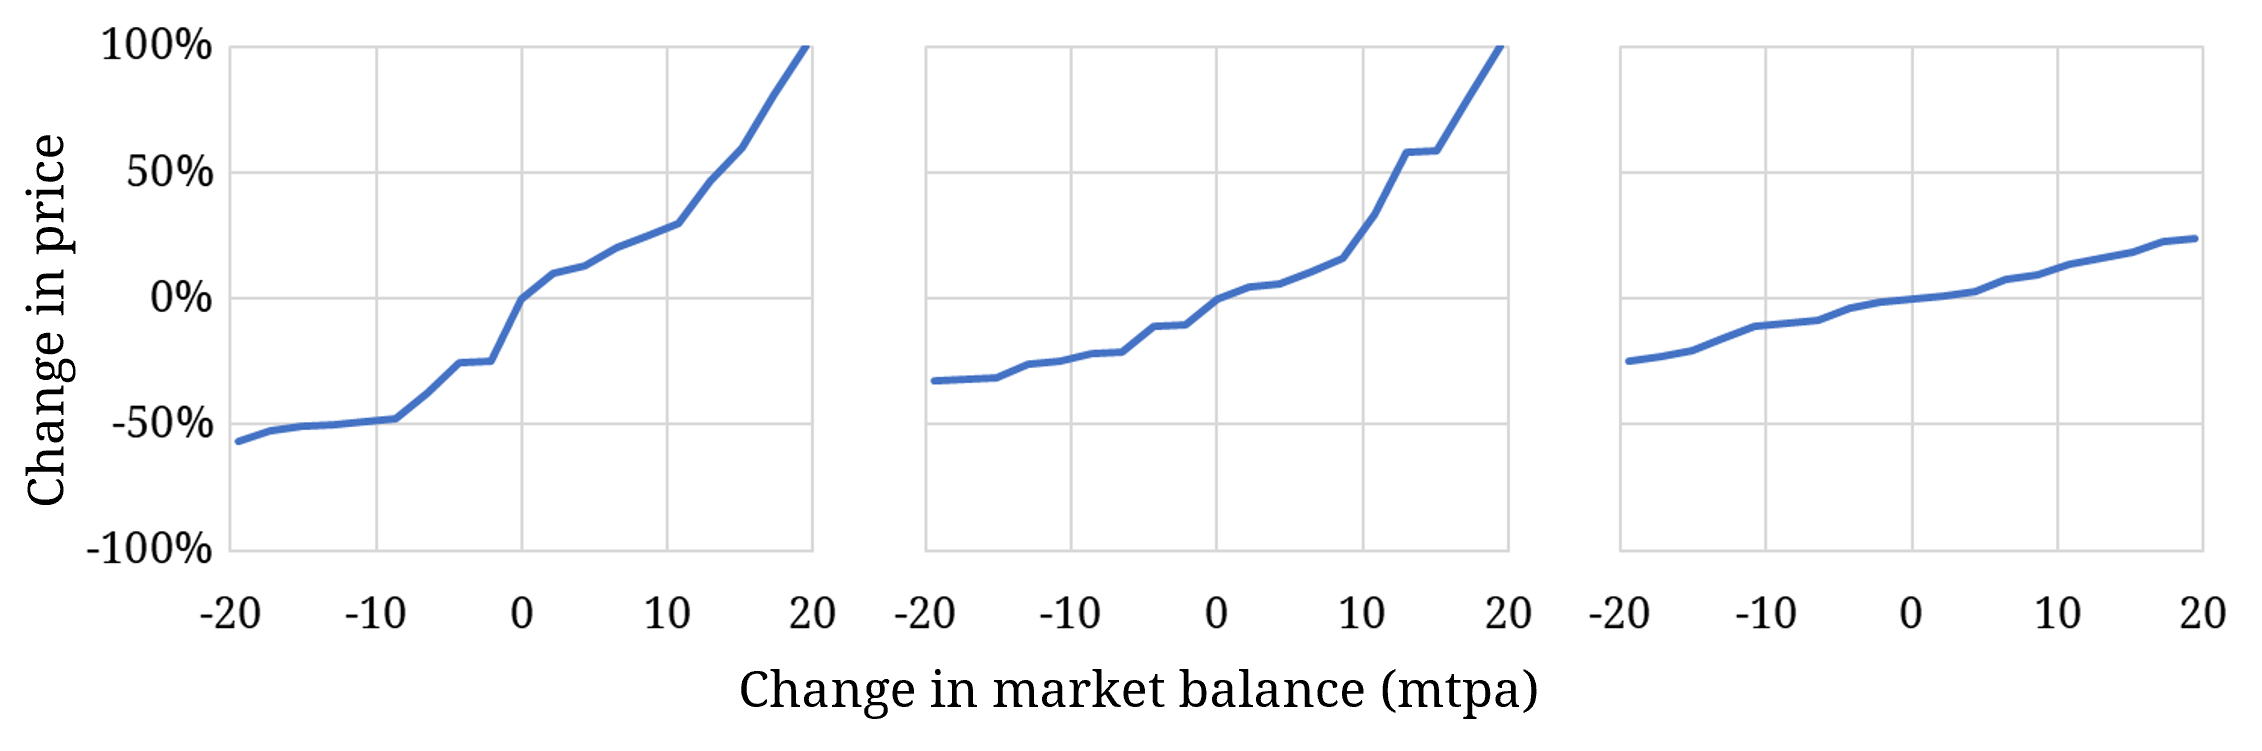
Source: Timera global gas model
As discussed in our recent snapshot, downside risks remain with gas prices across Summer 2023 given high storage inventory levels in Europe. But the left hand panel of Chart 2 shows that from the coming winter into 2024, asymmetric upside risk remains in what is a structurally tight global gas market with relatively inelastic price response. Price moves higher could be driven e.g. by a cold winter, strong Asian LNG demand or supply outages or delays.
By 2026 however, large volumes of new supply act to increase elasticity of price response. This is likely to dampen volatility vs levels we have experienced across 2021-23. But… permanent reductions in European power switching & storage flexibility mean volatility is likely to remain elevated vs pre-crisis levels.
What about price spreads & correlations?
Inter-regional price spreads & correlations are key drivers of asset & portfolio value. These are driven by regime based marginal pricing dynamics.
In Chart 3 we show analysis from our global gas model that defines the transition in dominant marginal price setting mechanisms.
Chart 3: Dominant marginal flex tranches driving global gas pricing
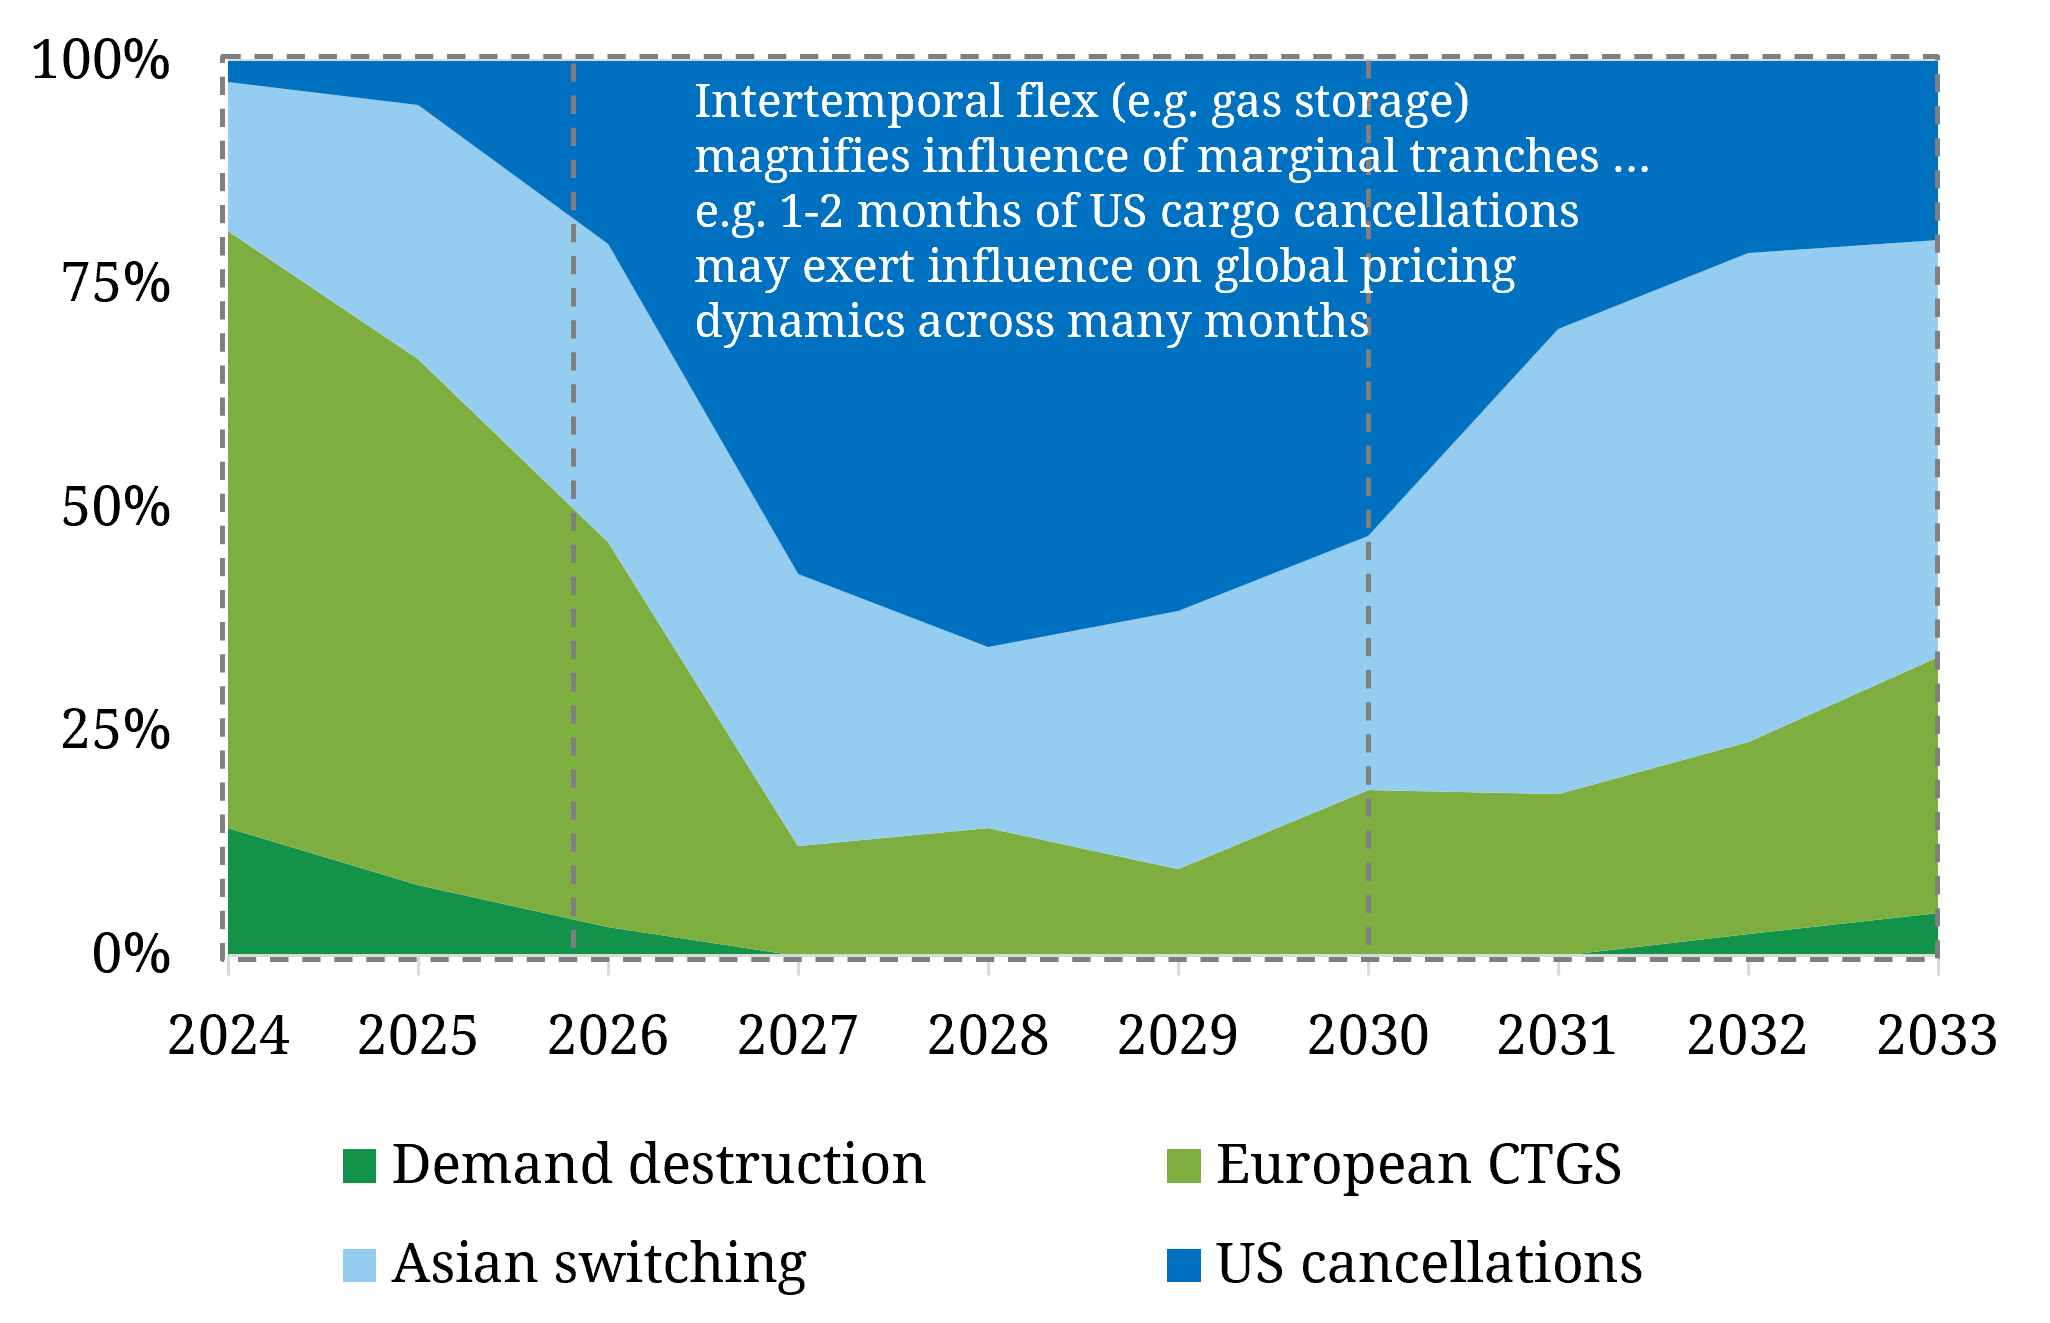
Analysis of the drivers of marginal pricing help inform us how inter-regional price spreads & correlation dynamics may evolve.
| Regime | Price correlation & spread dynamics |
|---|---|
| 2024-2025: ‘Supply constrained’ dominant regime = tight | • Global LNG prices decoupled from Henry Hub with lower inter-regional correlations • LNG prices influenced by coal / carbon prices via European switching & oil prices via Asian switching |
| 2026-2030: ‘Next wave’ dominant regime = oversupplied | • Strong correlation between Henry Hub & global LNG prices (with inter-regional price convergence) • Potential for temporary spread divergence & correlation weakness e.g. across tighter winters |
| 2030-33: ‘Rebalancing’ dominant regime = balanced | • More dynamic price spread & correlation behaviour given major reduction in European switching flex • Less elastic Asian fuel & demand switching to play a key role in setting marginal prices & spreads (with Brent & coal linkages) |
Price dynamics drive portfolio value
There is a huge industry focus on forecasting gas prices (e.g. at JKM, TTF & HH). Much less time is spent analysing the impact of deviations from these price forecasts i.e. understanding how they could be wrong and what the value impact is. This is the benefit of quantifying the price elasticity of the key tranches of supply & demand that set marginal prices.
Price levels are also only one factor driving portfolio value.
Price volatility drives portfolio risk exposure and the value of owned & sold flexibility (e.g. diversion flex, volume flex & regas capacity). Price spreads & correlations drive the creation of value from for example differences in location (e.g. HH vs JKM) and differences in price indexation (e.g. JKM vs Brent).
An understanding of price elasticities, volatility & correlations is not just an interesting alternative to traditional price forecasts… It is a key source of competitive advantage.
If you’re interested in a pack containing more of our analysis on global gas pricing dynamics & value impact, see below.
Timera Global Gas Subscription Service launch
We have recently launched a quarterly Global Gas Service. Contact us (below) if you want a free unredacted pack with extracts of our latest analysis.
The service includes:
- Comprehensive quarterly projection dataset & chartbook
- Detailed slide-based reports
- Direct access to our experts
For more details see our brochure here.
You can contact David Duncan – Gas & LNG Director (david.duncan@timera-dev.positive-dedicated.net) or Olly Spinks – Managing Director (olly.spinks@timera-dev.positive-dedicated.net) for further details and a pack of sample analysis.