Proxy curves for gas pricing

European and Asian gas markets are dominated by long term oil indexed pipeline and LNG supply contracts. The pricing of these supply contracts is a key driver of spot and forward market price dynamics. But because these contracts are highly commercially sensitive, publicly available contract price data is hard to come by. This is a particular problem for price benchmarks over a forward horizonA common approach to filling this gap is to develop a proxy for the evolution of prices based on observable market price data for traded products.

Uses of proxy curves

There are many uses for proxy curves but these can broadly be grouped into two areas.

  1. Forecasting future price benchmarks for price series that are not directly observable:
    • Understanding the future pricing of flexible supply contract volumes which are a key driver of marginal market pricing.   For example, Russian supply contract prices are a key driver of the evolution of European spot and forward hub price dynamics. So a Russian supply contract price proxy can be used to analyse hub price behaviour.
    • Forecasting and valuing indexed contract prices which have components that have no directly observable forward curves (i.e. developing a proxy for the index components).  For example, some gas contracts formulas include oil product indices published government departments which have no forward prices available.  A proxy for these indices can be used to forecast contract price, facilitating valuation of the contract.
  2. Analysing the implied exposures that influence a price series:
    • Analysing the evolution of contract pricing influences.  For example, it is possible to derive the evolution of the Asian LNG “S-Curve” slope or level against crude over time.
    • Analysing and hedging implied exposures arising from contract indexation to non-standard prices.  For example, the early Ruhrgas release gas auctions in the late 2000’s had the option to index to the Average German Import Price (AGIP) published by the German ministry.  Developing a proxy for AGIP allowed the implied fuel oil and gas oil exposures to be calculated and hedged.

Methodology for developing proxy curves

The basic methodology involves developing a formula that allows the future values of a price series to be modeled as a function of price variables with transparent forward price data.  A regression approach is typically used to identify the best fit linear equation against variables with different combinations of lagging and averaging rules.  The basic linear equation is given below:

       proxy pricet = a + b × component price1 (x1, y1, z1) + c × component price2 (x2, y2, z2) + …

       where:

a is the intercept (equivalent to fixed price element of the formula)

b, c are slope coefficients that define the influence (or exposure) of each component

(x, y, z) are the averaging rules of each component (lag, averaging periods, duration)

The regression allows the values for the constants (a, b and c) to be calculated but the different combinations of price component averaging are pre-calculated.  Other more complex (e.g. non-linear) relationships are also used but are less common.  The attraction of using a linear relationship is that it mirrors the structure of most contracts and linear regression is a relatively simple and accessible technique.  The basic methodology is outlined in the diagram below.

Diagram 1: Proxy curve development methodology

proxy methodology

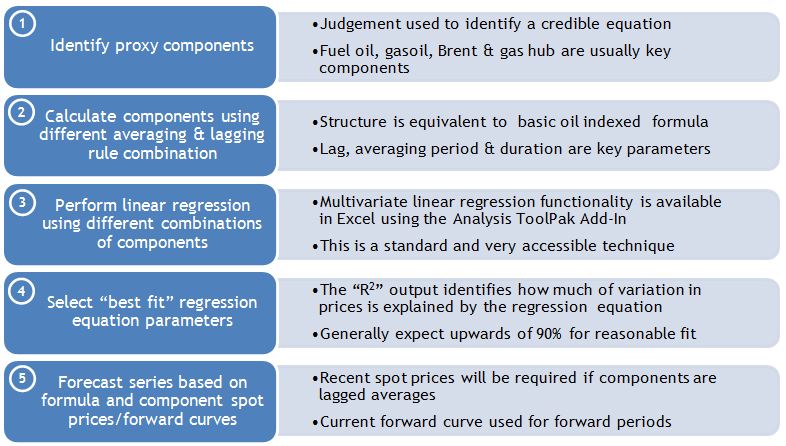
The key outputs are the intercept and variable (component) coefficient or slope.  The coefficient holds important information regarding how much exposure is implied by the proxy.  The detailed lagging and averaging rules define the delivery periods of the exposure.  At a high level the slope defines the implied influence that the components have over the prices that are being forecast.  If the proxy is being used to forecast a contract price, these coefficients provide important information on the implied exposure which can be used to inform hedges.

Case study: Developing an Asian LNG proxy

Developing a view on forward Asian LNG prices is important for understanding global gas market dynamics, given the influence Asian pricing has on the LNG market.  Despite some development in prompt indices there is no transparency in Asian forward pricing and as a result it is common for analysts to develop a proxy for Asian LNG prices.

Crude oil is the predominant indexation term in Asian LNG contracts so it is a natural selection to use as the single proxy component.  To demonstrate the concept we have developed a proxy for the World Bank Asian LNG price series against Brent crude.  The table below shows the results of simple linear regression against a number of combinations of lagging and averaging rules.

Lag Average Duration Intercept Coefficient R2
1 1 1 3.5 0.102 65%
2 1 1 2.54 0.113 79%
2 3 1 1.57 0.124 88%
2 4 1 1.25 0.127 89%
3 1 1 2.02 0.119 87%
3 2 1 1.83 0.121 87%

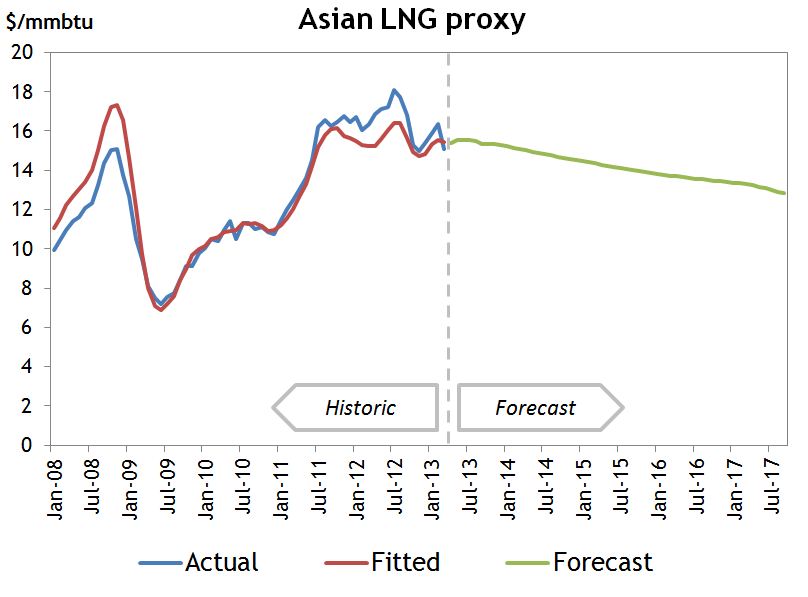
For simplicity we have selected the proxy with the highest R2 (in red) but in practice there are other secondary issues which should also be considered.  The chart below shows the actual price series against the fitted values and also the forecast of LNG prices based on the current Brent forward curve.

Asian LNG proxy v2

The World Bank Asian LNG benchmark is an assessment of average LNG prices that includes both contracted and spot purchases (the later only recently being included).  As such it is influenced by the terms of long term contracts and short term fundamentals. Nevertheless the fitted proxy highlights many of the standard terms in long term contracts (e.g. the lag aligns to the lag of the JCC crude benchmark commonly used in contract indexation to Brent).

It is interesting to note the influence of Brent curve backwardation on forward Asian LNG contract prices.  The slope coefficient is significantly below crude parity (approx 17 %) but its value is highly sensitive to the historical periods included in the regression which highlights the evolution of the weighted average slope coefficients in long term supply contracts.

Proxy curves provide a useful means for analysing the evolution of supply contract price dynamics. However proxy curves should also come with a health warning.  The use of proxy prices to support commercial decision making (e.g. asset valuation and risk management), introduces proxy risk which warrants careful consideration.  This is a topic we will focus on in a subsequent article that addresses some of the issues associated with the application of proxy curves.

Emerging influences of the German power market

In a recent article we set out the impact of the rapid increase in renewable production on the German market.  Because Germany is at the core of the European power market, with large volumes of interconnection to its neighbours, Germany is exporting the impact of its aggressive renewable policy across North West Europe.

Overcapacity in Germany is driving down European power prices and crushing gas plant load factors.  At the same time, intraday price shape is decreasing and spot volatility increasing as growing volumes of German intermittent capacity impact marginal pricing.  In response, forward market liquidity is falling along the curve and becoming more focused in the prompt.  These trends are set to continue as renewable capacity expands.

Overcapacity and changes in marginal pricing 

German policy support for renewable capacity has lead to a surge in new generation capacity at the same time demand has slumped as a result of the financial crisis.  As this growth in low variable cost generation impacts marginal pricing, Germany’s renewable policy is effectively subsidising lower power prices across North West Europe.  This is clearly of benefit to consumers but is creating headaches for owners of gas plant as load factors and returns plummet.  The German transition to renewable capacity is acting to materially change market price dynamics.

The German merit order is different from its neighbours to the west, given a capacity mix with much larger volumes of hard coal and lignite capacity.  Lower variable cost coal and lignite have moved into a key marginal price setting role across North West Europe as renewable output has increased and coal prices weakened relative to gas.

German power exports tend to be larger across the winter months when German coal is displacing more expensive gas capacity in neighbouring markets, particularly the Netherlands and France.  There have also been periods of high offpeak exports to the Netherlands and France as robust renewable production in Germany pushes cheaper coal and lignite on to the margin.  The role of coal as the dominant German price setting capacity is clear in Chart 1 showing output by generation type in Nov 12.  This chart also shows examples of evenings and weekends where robust renewable output and low demand have pushed cheaper lignite capacity onto the margin, in turn driving higher export flows.

Chart 1: Nov 12 German production by fuel type

Nov 12 actual production

Source: Electricity production from solar and wind in Germany in 2012.  Prof. Dr. Bruno Burger (Fraunhofer ISE)

Transitions in shape, volatility and liquidity

The impact of the surge in German renewable capacity has been felt most acutely in the prompt horizon.  Price shape is now a function of system demand net of renewable output which can vary significantly from one day to the next.

But there are some important trends in renewable output.  Both solar and wind production tend to be more pronounced in the day time hours as illustrated in Chart 2.  This has acted to flatten intraday price shape to the extent that there have been periods where peak prices have fallen below offpeak.

Chart 2: May 12 solar and wind vs conventional German production

May 12 production

Source: Electricity production from solar and wind in Germany in 2012.  Prof. Dr. Bruno Burger (Fraunhofer ISE)

The intermittent nature of renewable capacity, in particular wind, is also driving sharp intraday price swings.  Changes in renewable production can cause sharp movements in the power price as the marginal price setting capacity changes.  Price volatility is increasingly being influenced by much cheaper lignite or even nuclear and renewable production coming on the margin.  As a result there have been a number of cases of zero or negative prices.

The upshot of overcapacity and higher prompt volatility has been a shift in forward market liquidity to the prompt horizon.  Volatility along the curve has been crushed by the capacity overhang, reducing both speculative and hedging activity.  Prompt volumes on the other hand are reacting to an increase in portfolio hedging requirements to manage short term volatility and an associated increase in speculative trading activity, as shown in chart 3.

Chart 3. EPEX Day Ahead Prices and Volumes

EPEX Prices and Liquidity

Source: EPEX

Expect more of the same?

To the extent that renewable capacity continues to be rolled out in Germany, the influences described above are likely to continue, becoming more pronounced over time.  The German power market is also the canary in the coal mine for other European markets pursuing aggressive renewable targets.

But as the German election approaches in September, Germany will also provide an important indication of the political will across Europe to continue the aggressive transition to renewable energy in the face of ongoing economic weakness.  European power market dynamics are evolving rapidly with the roll out of renewable capacity.  But the pace of future change is increasingly becoming a function of political will.

Faith shaken in grandfather Groningen

The vast Groningen gas field in the Netherlands plays an important role in the delivery of both supply and flexibility to the North West European gas market.  Low level seismic activity has been directly associated with extraction of gas at Groningen for over 15 years. But a 3.4 magnitude quake in August 2012 has raised serious questions as to the consequences of maintaining current production levels.

An investigation is underway, focused on (i) the increasing probability of higher magnitude quakes with further field depletion and (ii) the need for reductions in production to mitigate the risks associated with further quakes.  Any reduction in the volume and flexibility of Groningen production schedules may have important implications for the EU gas market.

A pillar of European supply

The Groningen gas field in the north east of the Netherlands is one of the key production resources around which the European gas market has evolved over the last 50 years. The field was originally discovered in 1959 and commissioned four years later in 1963.

On commencement of production, Groningen contained an estimated 2.8 tcm of reserves, enough to supply Germany for over 30 years.  To put the size of the field into perspective, it is more than twice the size of the Troll field (the second largest in Europe) and is around the 10th largest field discovered in the world.

Chart 1: Location of the Groningen gas field

field map

Source: energy-pedia.com

The Groningen field is also a key provider of seasonal flexibility to the NW European market.  Chart 2 shows the highly seasonal pattern of Dutch gas production, with Groningen providing the significant majority of seasonal shape.

Two gas storage facilities, Norg and Grijpskerk, are used to enhance the seasonal flexibility provided by Groningen whilst smoothing the actual production from the field itself.  In fact from a regulatory perspective these storage facilities are considered to be additional production facilities.

Chart 2: Monthly Dutch gas production

shape

Source: Eurostat

Shaking the faith

Low level seismic activity has been associated with extraction of gas at Groningen for over 15 years.  But on the 16th August last year, an earthquake measuring 3.4 on the Richter scale occurred near Groningen. This was the strongest quake to date and has caused the most associated damage.

This more pronounced seismic activity in 2012 has raised concerns among local residents, leading to a more detailed investigation of:

  1. How strong the earthquakes may become given the current rate of extraction and
  2. Whether cuts in production may be required to minimise the risk to infrastructure which is ill equipped to withstand significant tremors.

The size and frequency of quakes in relation to production volumes are illustrated in Chart 3.

Chart 3: Monthly Groningen production and seismic activity

production

Source: Reassessment of the probability of higher magnitude earthquakes in the Groningen gas field – State Supervision of Mines.

Government response

The Dutch Government’s response was outlined in a letter by Henk Kamp (the Minister of Economic Affairs) to the Dutch parliament on 25th January 2013.

Following the August 2012 earthquake, the State Supervision of Mines (SodM), the field operator (NAM) and the Royal Dutch Meteorological Institute (KNMI) all carried out  investigations with the following key conclusions:

  • Since 2000, Groningen production has increased from around 20-30 bcm to 45-50 bcm and the number and strength or tremors have increased proportionally.
  • The link between gas production and low level seismic activity is well established, with the KNMI assuming that the maximum magnitude of earthquakes arising from Dutch gas extraction would be 3.9 on the Richter scale.  But investigation lead to the conclusion it was now not possible to accurately predict the maximum magnitude from historical data.
  • Based on the evidence of earthquakes in other gas producing basins around the world, KNMI has indicated that the maximum range could be 4-5 on the Richter scale.
  • SodM estimated that there is a 7 per cent change of an earthquake greater than 3.9 occurring in the next twelve months.
  • SodM has advised that gas extraction should be reduced by as much and as quickly and feasibly possible to reduce the number of further earthquakes.

The response from the Dutch government has so far been measured, balancing the concerns of local residents against the commercial and economic impacts of reducing production.  The Government has tried to provide assurance to local residents that compensation will be available in the event of earthquake damage.  They have also endorsed the NAM initiative to provide assistance for the assessment of structural risk and contribute to the cost of any remedial works.  NAM has already allocated an additional EUR 100m to support the latter (in addition to existing earthquake compensation schemes).

The Government has estimated that an annual 10 bcm (20%) production reduction from the Groningen field would result in reduced taxation of around €2 billion. This gives an indication of the scale of the fiscal and economic impact from any mandated reduction in production.

The Government have requested that NAM commission further technical studies to get a more accurate assessment of the potential maximum earthquake magnitude as a function of production. NAM has a deadline of 1 Dec 2013 for submitting a revised production plan which will be assessed by SodM.  The government has also requested a review of alternative production techniques that may allow the same rate of production with reduced earthquake risk.

Gas market implications

Although Groningen is a mature field, it is still a key provider of supply and flexibility into the NW European gas market.  From an annual supply/demand balance perspective, the shortfall from say a 10-20 bcm of Groningen production (20%-40%) could be fairly easily met by increased pipeline imports (e.g. from Russia).  Meeting this shortfall may however act to tighten the gap between hub and oil-indexed contract prices.

Another consideration is that the Groningen field produces low-calorific gas (used extensively in central heating boilers and domestic cooking). There are limitations around processing capacity to convert hi-cal to low-cal gas (through the addition of nitrogen) which means it is not necessarily straightforward to backfill any lost production from Groningen with hi-cal imports.  This increases the possibility of a two tiered gas market for hi and low-cal gas (even if only on a temporary basis while conversion capacity is added).

Perhaps most interesting but less clear cut is the effect any production restrictions may have on the pricing of seasonal flexibility.  In a report on the impact of Groningen production on seismic activity, prompted by the August 2012 Earthquake, the SodM made the observation that:

“higher magnitude earthquakes seem to occur with a delay of 6-9 months following a winter peak production period.”

If this observation holds up under closer inspection, it raises the possibility of a greater impact of restrictions on peak production.  This is likely to reduce the ability of Groningen to supply seasonal flexibility, although it is unclear how such restrictions would apply (particularly in the context of the Norg and Grijpskerk gas storage facilities).

Until further investigations are completed, uncertainty around the scale and impact of Groningen production restrictions will remain.  But if restrictions are imposed that significantly reduce the ability of Groningen to supply seasonal flexibility, this should support summer/winter price spreads.  In the current environment of low returns for flexibility, this may be a rare piece of good news for owners of gas storage assets.

Japanese nuclear restarts and the global gas market

Japan is the elephant of LNG importing nations.  Japanese demand accounts for about 35% of global LNG imports, dwarfing South Korea in second place (at around 15%).  The post Fukushima closure of Japhttps://timera-dev.positive-dedicated.net/wp-admin/post.php?post=3360&action=editanese nuclear reactors and the resulting increase in gas-fired generation sent shockwaves through the global gas market in 2011.  This step change in Japanese demand has been the primary driver underpinning the current phase of global gas market tightness that has prevailed since Q1 2011.

As a result of the nuclear closures, Japan is now confronting an explosion in energy costs as import volumes of gas and oil have increased at the same time the yen has declined.  Nuclear power remains deeply unpopular in Japan.  But the new Japanese government is confronting the harsh reality that it cannot afford a nuclear free future.  The scale and pace of Japanese nuclear restarts will be instrumental in shaping the evolution of the LNG market over the next two years.

The numbers:

The post Fukushima shutdown of Japan’s 54 nuclear reactors has caused a sudden increase in Japanese energy import dependence.  In the absence of nuclear power, the world’s third largest economy is only 4% energy self sufficient.

Japanese imports of LNG have increased to 87 mtpa in 2012, up 25% from the 70 mtpa pre-Fukushima import volume in 2010.  Average LNG import prices for Japan have also increased, by around 55% in USD terms from approximately 11 $/mmbtu in 2010 to approximately 17 $/mmbtu in 2012.  Over the same period, the total yen value of LNG purchases has increased by more than 70 percent from about 3.5 trillion yen in 2010 to 6 trillion yen in 2012.

The recent depreciation in the yen, around 20% against the USD since Q4 2012, has caused another jump in the cost of Japanese LNG in 2013.  The restart of nuclear reactors may be politically unpopular, but by delaying nuclear restarts Japan risks crippling its economy with rising energy costs.

There is considerable uncertainty around the regulatory process, timing and number of reactor restarts.  Initial restarts will likely displace more expensive oil-fired generation ahead of gas-fired power plant.  But there can be no doubt that a return to nuclear generation will materially reduce Japanese LNG demand.

The chart below from Reuters shows the impact the Fukushima disaster has had on monthly LNG consumption since Q1 2011.

Chart 1: Monthly Japanese LNG consumption (mt)

Japanese LNG demand

The politics:

Shinzo Abe’s Liberal Democratic Party (LDP) government was elected in a landslide in Dec 2012 on a platform of radical economic reform.  Central to this reform has been a ‘strong-arming’ of the central bank (BoJ) into a massive programme of quantitative easing in an attempt to (i) raise inflation expectations and (ii) devalue the yen to support Japanese exporters.  Japan’s monetary easing at $65 billion per month now dwarfs US quantitative easing on a GDP adjusted basis.  It is the anticipation and implementation of this radical shift in monetary policy that has lead to the rapid depreciation of the yen since Q4 2012.

As the yen has declined, the increasing cost of energy (particularly LNG) has caused a pronounced shift in Japan’s balance of payments.  A perennial trade surplus has been replaced by sharply rising trade deficits.  In other words the increased cost of energy is more than offsetting the benefit of a weaker yen for Japanese exporters.

Japan is to a large extent hostage to the global market price for oil and LNG, although the Japanese government has been lobbying Obama to approve US exports of LNG to open up a new source of supply competition.   The most obvious mitigation measure the government has to combat the economic pain from rising energy costs is the fast tracking of nuclear restarts.

The practicalities:

Only two of Japan’s 54 reactors have been restarted since the Fukushima earthquake.  The main hurdle that Japanese utilities face before restarting further reactors is compliance with a revised set of safety standards, shortly to be enacted by the Nuclear Regulation Authority.  This regulatory hurdle means the timing of start-ups is uncertain, but current expectations are for reactors to start returning to service from early 2014.

Restarting nuclear reactors has the obvious primary benefit of reducing the volume and hence cost of Japan’s energy imports.  A less obvious but important secondary benefit, comes from Japan’s status as a key driver of marginal global LNG pricing.

Just as nuclear closures caused a tightening in the LNG market in 2011, nuclear restarts will be likely to have a dampening effect on global LNG pricing going forward.  This should act to reduce Japan’s cost of future gas import volumes.  It may also act to increase the potential overhang of new sources of supply later this decade (e.g. Australia, US exports, Canada, East Africa).  The bottom line is that nuclear closures have increased Japanese LNG demand by approximately 15 mtpa (21 bcma).  This equates to around 6% of global LNG demand.   So any concerted return to nuclear generation by Japan is likely to have a significant impact on the global LNG supply/demand balance and in turn on price levels.

There has been much fanfare surrounding the introduction of ‘Abenomics’ in Japan over the last 6 months.  Whether this has any real long run impact on an economy that is mired in debt remains to be seen.  But aggressive monetary policy that targets yen devaluation increases the pressure on the Japanese government to accelerate nuclear restarts.

Gas indexation in Europe – a tipping point?

The increasing level of gas hub indexation in European supply contracts has been a key factor behind the evolution of the gas market over the last 5 years.  The momentum behind hub indexation has grown as North West European hub prices have consistently traded below oil-index contract levels since the financial crisis.  This has acted to both develop hub liquidity and transparency as well as opening up a painful gap for suppliers between long term contract costs and short term retail contract pricing.

Whilst coming up with reliable assessments of the aggregate levels of gas indexation across European supply contracts is very difficult, there is undeniable evidence of an accelerating transition to hub indexation.  But simple assessments of the levels of oil vs gas indexation overlook the dynamics that ensure that oil prices will be a key driver of hub price formation for many years to come.

Current levels of gas indexation in Europe

The chart below shows recent OIES and Reuters assessments of the levels of gas indexation by European supply source.

Chart 1: Two views of aggregate European supply contract indexation

Gas indexation

Source: Timera Energy based on data from Reuters and OIES (Oxford Energy Forum – August 2012)

As a third data point SocGen  recently announced that they believe less than 50% of gas supplies will be linked to oil in 2013.

It is almost impossible to get an accurate assessment of gas indexation levels and growth.  Most of the supply contracts are structural long term portfolio contracts with highly confidentially sensitive.  Typically contract terms and conditions have evolved over time through the processes of renegotiation and price re-openers.

It also relatively easy to poke holes in the top down estimates above.   For example, before the development of the NBP as a liquid hub, much of the gas coming into the UK from the North Sea was sold under long term contracts with strong components of oil indexation.  While these contracts have mostly been de-dedicated from the field themselves and subject to many contract revisions over time, they still contain a large element of oil indexation.   As a result it is optimistic to assume 100% of gas from the UKCS is gas linked.  However, there is an undeniable trend of growth in gas indexation.

Gas vs oil indexation through the eyes of the re-opener

The gas vs oil debate has been in focus recently through the lens of re-opener negotiations and arbitrations.  Here the key producers have taken opposite positions.

Statoil have been more willing to accept increased levels of indexation to NWE hubs and have stated that they expect the majority of their supplies in the future to be hub indexed.    And they put their money where their mouth is last year by signing a 10 year 45 bcf supply deal with BASF primarily linked to the German hubs.

Gazprom and the North African producers have been more vociferous in their defence of oil indexation.   Re-opener disputes have resulted in some concessions but these have been focused on temporary adjustments of absolute price levels.  Gazprom have been very vocal in their public defense of oil indexation and have given only marginal concessions in terms of increased linkage to gas in reopener settlements with major NWE suppliers.  However it is interesting to note that Gazprom, through its marketing and trading arm (Gazprom M&T), have signed a 3 year deal with Centrica to deliver 2.4 bcm gas to the UK entirely priced off the NBP.

If the Centrica deal is a sign of a strategic shift from Russia, then a more rapid transition to hub indexation is on the cards.  But rather than this being an indication of a step change in position, it is more likely to be a result of Gazprom confronting the fact that, given the prevalence of gas indexation in UK wholesale and I&C contracts, it is almost impossible to find a buyer for an oil-indexed gas.

As the continental markets transition towards gas indexation as the standard for pricing sales to large end users, it becomes increasingly difficult for incumbent suppliers to bear misalignments between exposures in their supply contracts and retail portfolios.  There has been a pronounced shift of large gas consumers on the continent following the long established UK precedent and requesting hub indexed gas as an alternative to standard fuel and gas oil formulas.

The influence of oil is here to stay

The original reasons for oil-indexation are mostly irrelevant to today’s European gas market.  It is difficult to make a compelling commercial case for the retention of oil indexation as the predominant pricing influence.  However, the influence of oil prices on European pricing dynamics will remain for many years.

Firstly, the legacy long term contracts (in some case 20+ years) that underpin most European pipeline imports are still predominantly oil-linked.  The flexible volumes (typically above 85% take or pay) are a key source of marginal supply, allowing suppliers to manage overall portfolio balance.  This means they will continue to have a disproportionate influence on hub pricing.

Secondly, much of the incremental supply will only flow into Europe against an oil linked threshold or opportunity cost alternative.  In the coming years, un-contracted Russian production promises to be a key source of incremental supply which is likely to be strongly influenced by oil linked benchmarks.  In addition, flexible LNG cargoes (divertible contract or spot purchases) will only flow into Europe if hub prices are higher than the best alternative on a netback basis.  Asian LNG markets, which still have a strong linkage to crude, are likely to set that alternative for years to come.

Renewable growth and German power market dynamics

Angela Merkel’s coalition government is under pressure from rising energy bills at the same time it is confronting a significant slowdown in the development of renewable capacity.  Renewable energy policy is shaping up to be a key issue in the German election in September.  Germany has delivered onshore wind and solar capacity at a remarkable rate over the last decade, but it now faces a much bigger challenge in developing and connecting large volumes of offshore wind capacity.  The cost and logistics of this challenge are likely to be the ultimate test for Merkel’s Energiewende.

Given Germany’s power market has historically been dominated by nuclear and coal capacity, its renewable targets are the most aggressive in the world by some margin.  A 50% renewable production share by 2030 and an 80% share by 2050.  10 GW of offshore wind capacity by 2020.

Ironically, Merkel’s post Fukushima decision to accelerate closure of Germany’s nuclear plant has been a key factor undermining progress towards these targets.  Germany’s two largest utilities, E.ON and RWE, are the key developers of renewable capacity.  But both companies are suffering considerable balance sheet stress, brought on in part by the significant loss of margin from accelerated nuclear closures.  E.ON recently announced it will cut renewable investment from €1.79 billion to less than €1 billion.  RWE has said it will cut renewable spend in half to €0.5 billion with RWE’s CEO saying that he wants to reduce offshore wind  investment risk by connecting “one park at a time.”

In this article we provide a brief overview of how German renewable policy is impacting the German power market.  This gives an indication of what may follow and of the importance of German energy policy to power markets across Europe.

A changing generation landscape

A recent presentation from Professor Dr. Bruno Burger of the Fraunhofer Institute for Solar Energy Systems provides some useful factual background on the impact of the increase in German renewable production capacity that has occurred across 2012.  In a year when wind levels were down, the increase in German renewable production has been driven by a 34% (8.1 GW) increase in solar capacity.  The impact of this solar capacity expansion  on renewable output is shown in Chart 1.

Chart 1: Step change in German solar output in 2012

DE Solar Wind

Source: Electricity production from solar and wind in Germany in 2012.  Prof. Dr. Bruno Burger (Fraunhofer ISE)

The German power market has easily absorbed the loss of the 5GW of nuclear capacity closed in 2011.  Compensation for the nuclear shortfall has come from a decline in German power demand and a rise in coal plant load factors.   Growth in solar output, weaker German industrial demand and healthy dark spreads, have seen Germany significantly increase exports to its neighbours in 2012 (as shown in Chart 2).

Chart 2: Step change in German exports

DE power import export

Source: Electricity production from solar and wind in Germany in 2012.  Prof. Dr. Bruno Burger (Fraunhofer ISE)

The increase in solar production has displaced thermal plant in the merit order, particularly in sunnier peak periods.  This has caused utilities in Germany to mothball or close large volumes of gas-fired capacity.  A steady increase in the price of gas relative to coal has combined with higher renewable output to crush gas plant load factors, with German coal plant becoming the dominant driver of marginal pricing as shown in Chart 3.  Given Germany’s high level of interconnection, these factors have been felt across European power markets.

Chart 3: New solar at the expense of gas

DE power delta gen

Source: Electricity production from solar and wind in Germany in 2012.  Prof. Dr. Bruno Burger (Fraunhofer ISE)

Germany’s flexibility requirement has also increased significantly as a result of fluctuations in wind and solar output.  This requirement is serviced to a considerable extent by hydro and thermal plant beyond its borders, e.g. Scandinavian & Alpine hydro production and Dutch gas output.  Germany has also relied heavily on neighbouring transmission networks to balance its system given serious north-south constraints within the German network.

German renewable policy is clearly a key factor shaping the evolution of the European power market.  The German election is likely to have an important bearing on policy direction.  In the lead up to polling day on September 22nd we plan to publish several articles exploring the transformation of the German power market.   Next up we will look in more detail at the impact of Germany’s renewable production on neighbouring markets in an article to follow shortly.

Headaches from FX and interest rate exposures

Since the heightened panic across the Eurozone last summer, central banks have flooded credit markets with cheap money.  This has temporarily calmed credit market fears and FX volatility has fallen in sympathy.  But in the absence of any real structural steps to address the problems of the Eurozone and its undercapitalised banking system, the crisis is far from over.  The fragile state of Europe is evident from the recent problems caused by Cyprus which, given its size, should not be a source of late night emergency bailout sessions.

FX risk management can often be the Achilles heel of an otherwise sound energy portfolio risk management framework.  Chart 1 shows FX volatility on the rise again in 2013.  A key factor behind this rise has been the vast (USD187 billion a month) new quantitative easing programme recently instated by Japan, to try and reflate its way out of a state of stagnant bankruptcy.  In a world of ever more daring and unorthodox monetary policy, it is a good time to revisit the impact of FX risk on energy portfolios.

Chart 1: FX volatility on the rise again

FX vol 2013

The problem that is forward FX

Energy contracts that specify payment for delivery of a commodity (e.g. gas) at a specified date in the future are core to the commercial business of most European energy companies.  If that delivery is in a foreign currency (e.g. EUR) then there is a direct forward FX exposure associated with the future cash payment. In addition this cashflow needs to be discounted for risk measurement calculations to account for the time value of money.   Indirect or implied forward FX exposure can also result from complex contract price indexation.  For example, where the formula includes FX conversions or includes prices where the currency unit of a formula component is different from the underlying market (e.g. averaging EUR/MT Gas Oil quote when the underlying market is quoted in USD/MT).

The treatment of forward FX and IR exposures can often be hidden ‘under the bonnet’ of most trading and risk management system solutions.  But a number of energy companies are facing inconsistencies in the way they treat FX and IR exposures across their portfolio.  The impact of these inconsistencies has become more pronounced over the last 3 years as a result of funding stress in financial markets from the European debt crisis.  These inconsistencies can undermine mark to market and risk measurement calculations and compromise the principle that all portfolio exposures are consistently priced against the most liquid market source.

A clash between two approaches

There are two approaches commonly used to tackle the FX and IR exposures associated with forward energy positions:

  1. using LIBOR (the London Interbank Offered Rate) interest rate quotes to discount exposures which are then valued against a spot FX rate
  2. using forward FX market quotes and deriving an implied interest rate curve to discount exposures.

Both are theoretically valid but there are some clear pitfalls to watch out for.  For legacy reasons, usually driven by systems implementation, many energy companies rely on the LIBOR discounting spot FX approach.  LIBOR curves are accessible and commonly used across other areas of energy companies (e.g. by treasury, accounting and settlements functions).

The shortfall of this approach is that it results in a representation of forward FX exposures as (i) a large spot FX exposure (ii) a relatively small exposure to the interest rate differential between the two currencies involved.  Given that the forward FX exposure is typically hedged with traded FX forward contracts, there is a mismatch between the risk management exposure representation and the way the exposure is managed in practice.

The knock on implications of this is that it compromises the ability of traders and risk managers to understand the impact of movements in forward FX rates on portfolio value (eg through VaR simulations or stress tests).  The use of quoted forward FX prices for exposure mark to market and risk measurement provides a more accurate representation, but it can result in some difficult inconsistencies in the use of interest rates for discounting.

The two approaches are no longer interchangeable

Up until the onset of the financial crisis, the answer derived by approaches 1. and 2. above was essentially identical.  Arbitrage ensured that there was no profit available from borrowing at home to lend abroad (or vice versa) if FX risk was fully hedged.  This condition, commonly known as covered interest parity arbitrage, has broken down a number of times since the onset of the financial crisis.

Funding stress and counterparty credit risk issues have led to a divergence between LIBOR and interest rates implied from forward FX curve since the onset of the financial crisis.  Both are valid market sources of interest rates, but for reasons explained below, there can be inconsistencies between the two of them.  The reason for this involves a diversion into credit markets and is best illustrated by an example below.  If you are not so interested in the cause, but more the effect, you can skip to the section below.

An   Italian bank of dubious credit quality has structural USD liabilities associated with its commercial lending business and needs to fund these via short term borrowing of USD. Under normal credit market conditions it would borrow the USD in the interbank market at a rate referenced to LIBOR.  But under the conditions of credit market stress that have prevailed since the onset of the financial crisis in late 2008, the bank is constrained in its ability to borrow USD in the interbank market.  This can be both due to concerns of the Italian bank’s credit risk but also to a broader shortage of USD funding in times of more acute market stress.  But the bank has an alternative option to obtain USD funding.  Instead of borrowing in the interbank market (at LIBOR), the bank can buy USD for delivery in the FX forward market.  In doing this the bank is effectively taking out a collateralised loan (EUR for USD).  The impact of banks funding through FX forwards in this manner has caused a divergence between LIBOR rates and the interest rates implied from FX forward prices.  In theory this difference is arbitragable.  In practice credit risk and funding have constrained that arbitrage during periods of market stress.

How does this effect energy exposures?

It is common practice in energy companies to create synthetic forward FX curves using spot FX rates and published LIBOR curves.  The divergence described above means that this approach is no longer a reliable way to generate a forward FX curve for MtM and risk measurement purposes.  But scrapping the use of LIBOR altogether to focus on traded forward FX prices can create other problems.  It is likely that some business functions within an energy company will need to use LIBOR rates (e.g. for contract settlement and treasury).  So the challenge is finding a solution which recognises the divergence between LIBOR and forward FX rates but can handle the inconsistencies in the discounting of cashflows that may arise.

European storage response to the NBP price spike

UK gas prices remain elevated and subject to further volatility as cold weather continues into the spring. One of the key factors in focus is gas storage levels, with UK reserves now below 5% of capacity and continental storage balances at historical lows.  It is interesting to analyse how European storage has responded through the recent period of higher prices.

A European response to a UK problem

Market price signals and supply flexibility response during March 2013 can be summarised in the following three stages:

  1. As the UK gas market tightened in early March, the NBP premium to continental hub prices rose, incentivising the flow of gas across the interconnectors (IUK and BBL) and withdrawal out of UK storage.
  2. As the UK deliverability issues became more acute with major Norwegian supply disruptions, continental hub prices spiked along with NBP providing a strong incentive for continental storage capacity withdrawal and maximised contract lift.
  3. Sustained cold weather, continued infrastructure issues and increasingly low storage levels kept hub prices high enough to attract flexible LNG cargoes from Qatar & Trinidad, alleviating the supply pressure.

The UK system remains tight at least until the current cold snap subsides, but this pattern of response provides strong evidence of a well-functioning pan European gas market.

A European storage market

Chart 1 shows a comparison of the inventory profile over the last 4 winters for German and UK storage capacity.

Chart 1:  Historic UK and Germany Inventory Levels

DE UK Stor Inv

Source: Gas Infrastructure Europe

Before this winter, German minimum winter inventory positions have been quite stable at around 40-45% of capacity.  This reflects the fact that security of supply, physical portfolio balancing and risk management requirements have been strong drivers of German storage capacity utilisation. The story is similar for France, the other major source of seasonal storage capacity in North West Europe, where there are regulatory mandated minimum inventory levels.

It is interesting to note the significant decline in German storage inventories over the current winter to historical lows.  This is evidence of the fact that strong price signals, in this case driven by the UK NBP, have incentivised the withdrawal of gas that has not been accessed previously. In other words, the UK has effectively been utilising European storage balances to alleviate supply tightness during March 2013.  It also reflects a more commercial attitude that continental capacity owners are taking to the optimisation of storage capacity.

Chart 2 provides an aggregate European view of historical storage inventory levels and the injection/withdrawal profiles.

Chart 2: European Inventory Levels and Injection/Withdrawal Profiles

 Eu Storage Inv

Source: Gas Infrastructure Europe

The chart illustrates that aggregate European inventories are also well below historical average.  The impact of a more prolonged period of supply tightness and sharper price signals is clear in the large Q1 withdrawal volumes in 2013.  This can be contrasted with the February 2012 cold snap which also caused a spike in hub prices.  The Feb 12 spike produced a larger absolute withdrawals but had a negligible impact on overall inventory levels as it was the result of a relatively short and sharp period of cold weather rather than the persistent supply disruptions of Mar 2013.

The way forward

The UK may face another week or two of supply tightness if a continuation of cold weather starts to overlap with maintenance related supply curtailment.  But forward gas prices indicate that conditions will soon return to normal.  Importantly though, low storage inventory levels across Europe should provide support for summer prices as stocks are replenished (although the impact of this will already be reflected in forward prices).

Alleviation of the pressure on prices will hopefully lead to a period of more considered reflection of the issues that have caused the recent UK price volatility and an appropriate response.  Debate in the UK has been focused around whether there are adequate levels of UK seasonal storage capacity to ensure security of supply.  But focusing on the UK in isolation ignores the substantial reserves of European supply flexibility that the UK can access. The evidence above points to a well functioning market response over an unusual period of system stress.

Is the UK gas market facing a supply crisis?

There has been a resurgence in UK gas market price volatility this month caused by unseasonably cold weather and a number of supply disruptions.  Prompt NBP hub prices have moved sharply higher in response to delivery constraints into the UK gas market.  But short term delivery constraints are not to be confused with long term security of supply.  This is a very different supply issue to the one facing the UK power market. 

Volatility is not a market illness

Wholesale gas price volatility has a tendency to make politicians, system operators and energy suppliers nervous.  But the causes and implications of price volatility are often misunderstood.

Gas supply and demand is inherently unresponsive to price in the short term given physical system constraints.  This drives short term volatility in hub prices, during periods of temporary system tightness.  These price movements provide the signalling mechanism which drives the physical flows across gas portfolios that are required to balance the system.

Price volatility in the UK this month is a good example of the impact of temporary system tightness.  A number of factors have combined to cause the NBP price spikes shown in Chart 1:

  • A stretch of cold weather boosting gas demand in the UK and across Europe
  • Some major supply disruptions, e.g. outages on the large Norwegian Ormen Lange field and the UK-Belgium interconnector
  • Lower UK seasonal storage levels in late winter
  • Low LNG flow into the UK given cargo diversion to higher priced markets in Asia & Latin America

Chart 1: Price spikes at UK NBP and other European hubs (source Reuters)

hub vol chart

Source: Thomson Reuters

These are an unusual but not extraordinary set of circumstances.  Similar temporary bouts of short term price volatility have occured previously (notably in 2005-06) and the UK gas market has responded well.

The dynamics of this response have changed over time, with a decline in UK North Sea gas production meaning the UK is more dependent on attracting imported supply.  But UK import capacity has also increased substantially in response to production decline, particularly connection with a large network of Norwegian gas fields and the Dutch gas market.  Beyond a horizon of two weeks (shipping lead time), the UK also has the ability to tap into very large volumes of LNG imports.

Temporary periods of volatility are indicative of system tightness.  They are not however a symptom of structural market failure.  Rather this volatility sends an important signal to investors to provide additional short term deliverability.  It also provides an important signal of the value of demand side response.  Ultimately the system operator should be in a position to respond with a range of commercially negotiated options to temporarily curtail demand in response to more severe supply disruptions.

Deliverability vs Supply:

The recent hub price volatility and comments of retiring Ofgem CEO Alistair Buchanan may have sparked national headlines on gas security of supply, but these concerns need to be considered in a level headed fashion.  The current conditions in the UK gas market have very little to do with a long term gas supply shortage.

The prevailing environment of forward hub prices trading below oil-indexed contract prices is reflective of the ample availability of gas supply into the UK and Europe.  Most suppliers have the ability to increase annual flows under long term contracts if required.  There are also substantial volumes of un-contracted Russian production that can flow into the European market if contract flexibility is exhausted.

The current UK supply issue is one of short term deliverability constraints:  field outages, interconnector failures and low storage balances.  This does not reflect a shortage of gas, but a shortage of options to deliver available gas into the UK market.

UK security of supply: gas vs power market

Alistair Buchanan’s comments on UK power market security of supply are a lot closer to the mark.  The power market is facing a genuine security of supply crisis in the form of a major generation capacity deficit from 2015-16.  This capacity issue has been compounded by government policy uncertainty and a range of inconsistent intervention measures to support low carbon generation.

The problem facing the power market is very different from the temporary deliverability constraints that impact the gas market from time to time.  But the UK government is openly discussing intervening in the gas market to support new sources of supply.

The most likely form of government intervention is customer or taxpayer subsidisation of seasonal gas storage development, e.g. via the government imposing a storage volume mandate on suppliers.  Addressing a short term deliverability problem by supporting development of seasonal storage capacity is likely to be an expensive mistake.  This is reflected by the lack of investor enthusiasm in seasonal storage capacity in a market where winter/summer price spreads indicate a significant oversupply of seasonal flexibility (gas storage capacity is only one of a number of sources of seasonal flexibility).

It is also wrong to assume that government intervention to reduce volatility will bring down customer gas bills.  Short term price spikes have a relatively small impact on customer bills.  On the other hand, government intervention to support non-commercial supply assets would be likely to result in a much bigger customer burden, both via pass through of direct costs and by driving up investment risk premiums.

Current hub volatility is sending a healthy signal to private investors to develop incremental deliverability options, e.g. by adding pipeline compression, additional interconnector capacity or fast cycle storage deliverability.  Government intervention to quash short term price volatility risks undermining the very investment in deliverability that is required.  There are some clear lessons to be learnt from the policy mistakes of the Electricity Market Reforms (EMR) and the damage this has done to power market investor confidence.  The UK is held up as the leading example of successful gas market liberalisation around the world.  That reputation will be unlikely to survive heavy handed government intervention.

Southern European gas market convergence

Hub price convergence has been one of the great structural changes in the European gas market over the last decade.  While North West European hub prices have already largely converged, Southern Europe is now falling into line.  The evolution of the Italian PSV hub over the last year is a case study in the power of spot price signals driving convergence.  Is the Spanish AOC hub set to follow?

North West European convergence took a leap forward with the development of Norwegian portfolio flexibility in 2006-07 (e.g. commissioning of the Langeled pipeline) that facilitated the arbitrage of price differences across the NBP, TTF and Zeebrugge hubs.  This was reinforced by the gas glut (2009-10) and the consolidation of German hubs (2010-11) which combined to significantly boost hub liquidity.

The French hubs (PEG Nord, PEG Sud and TIGF) illustrate the fact that liquidity is not a necessary condition for convergence.  Liquidity in France may be limited to smaller spot volumes, but the majority of industrial and commercial customers are contracting gas on hub related pricing terms.  Despite some resistance from incumbent suppliers, the Italian and Spanish gas markets are also falling into line.

Italy: a case study in convergence

The penetration of North West European hub price signals into the Italian gas market over the last year is clearly illustrated in Chart 1.

Chart 1: Italian PSV hub convergence

price convergence

Source: LEBA, Timera Energy

Liquidity at the PSV hub suffers from a number of flaws.  Capacity access to the main pipelines into Italy (e.g. Transitgas and TAG) is hard to come by.  The nomination and balancing rules are complex and opaque.  And perhaps most importantly, ENI as the incumbent supplier, dominates access to transport and flexibility infrastructure, while having little commercial interest in developing hub liquidity.  The Italian government has also displayed limited enthusiasm in its encouragement of hub evolution.

But poorer liquidity at PSV has not prevented rapid price convergence with North West European hubs over 2012 as shown in Chart 1.  Italian gas prices started 2012 at a 45% (10 €/MWh) premium to German hubs.  By the end of the year that premium had disappeared.  The key factor driving this price convergence has been the release of short term capacity on the TAG pipeline.  This has enabled large portfolio suppliers (e.g. E.ON, RWE) to divert long term contracted supply at Baumgarten, through TAG to be sold at the Italian PSV.

European Regulators may consider Italian convergence to be a feather in their cap as a they attempt to push towards greater gas market integration and efficiency.  But the rapid pace of PSV convergence is a timely reminder that market forces are a much stronger driver than incremental regulatory tinkering with market rules.

Italian price convergence illustrates the strength of hub price signal penetration in influencing commercial decision making.  As long as there is infrastructure to facilitate the flow of gas between two hubs, commercial incentives typically prevail.  This was concisely set out by none other than ENI’s Senior EVP of Trading (Marco Alverà) in a Q4 2012 analyst conference call:

“on the one hand, the increasing liquidity at the hubs is putting severe pressure on our commercial margins, on the other hand, this increased liquidity is giving us some benefits in negotiations as the suppliers are now finally coming to terms with the fact that liquid markets and hub markets are to be reckoned with and have to be taken into account into the [supply] contracts.”

With Spanish interconnector capacity to France due to be expanded to 5.5bcm this year, Spanish gas market convergence is likely to follow.