Will European LNG reloads continue?

The practice of reloading an already discharged LNG cargo back onto a vessel for export appears to defy logic.  But reloading of LNG has become an increasingly important factor driving European LNG flows over the last two years.  Reloading activity is focused on specific locations where LNG supply is bound by contractual constraints.  Despite the apparent inefficiency, significant profits have been made by reloading gas from Spain, Belgium and France for export to higher priced markets.  But there are some important structural factors that are likely to impact the future of LNG reloading.

Why is reloading happening?

There are two key factors behind the reloading of cargoes in Europe:

  1. Fixed destination clause (Delivery Ex Ship) constraints in LNG supply contracts
  2. A structural premium of Asian LNG spot prices over European gas prices

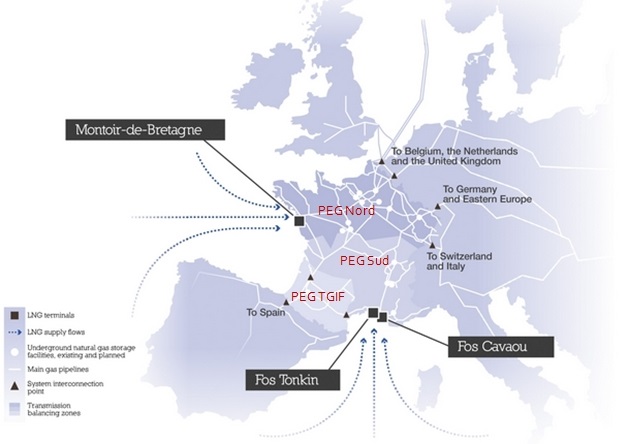
Fixed destination clauses only impact a subset of European LNG supply contracts.  The majority of LNG supply into European terminals is contractually divertible, either as agreed in the original supply contract or as renegotiated by the buyer and seller.   The exceptions are some inflexible supply contracts into Spain, France and Portugal, as well as Qatari LNG supply into Zeebrugge.  This has led to the conversion of several regas terminals to enable the reloading of gas.

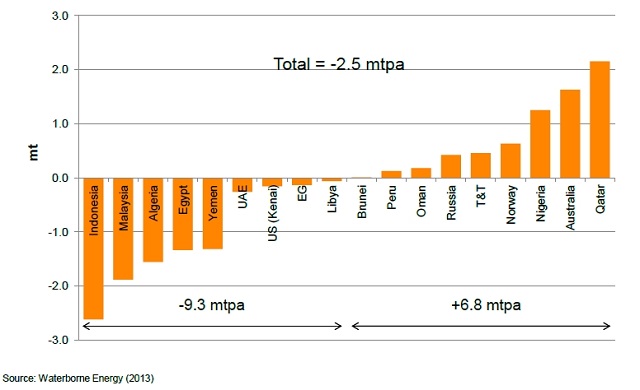
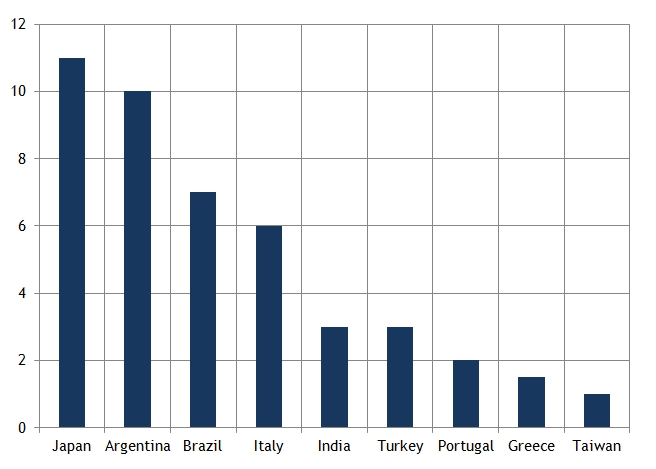
The source and scale of reload activity can be seen from the European volumes of re-exported gas in 2012, shown in Chart 1.  These volumes are still relatively small as a proportion of total LNG supply into Europe, but are in addition to larger volumes of divertible LNG supply contracts.

Chart 1: 2012 European LNG re-export volumes mtpa (source GIIGNL)reload by country

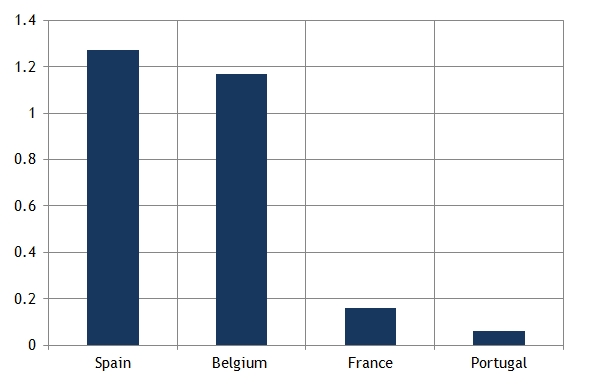
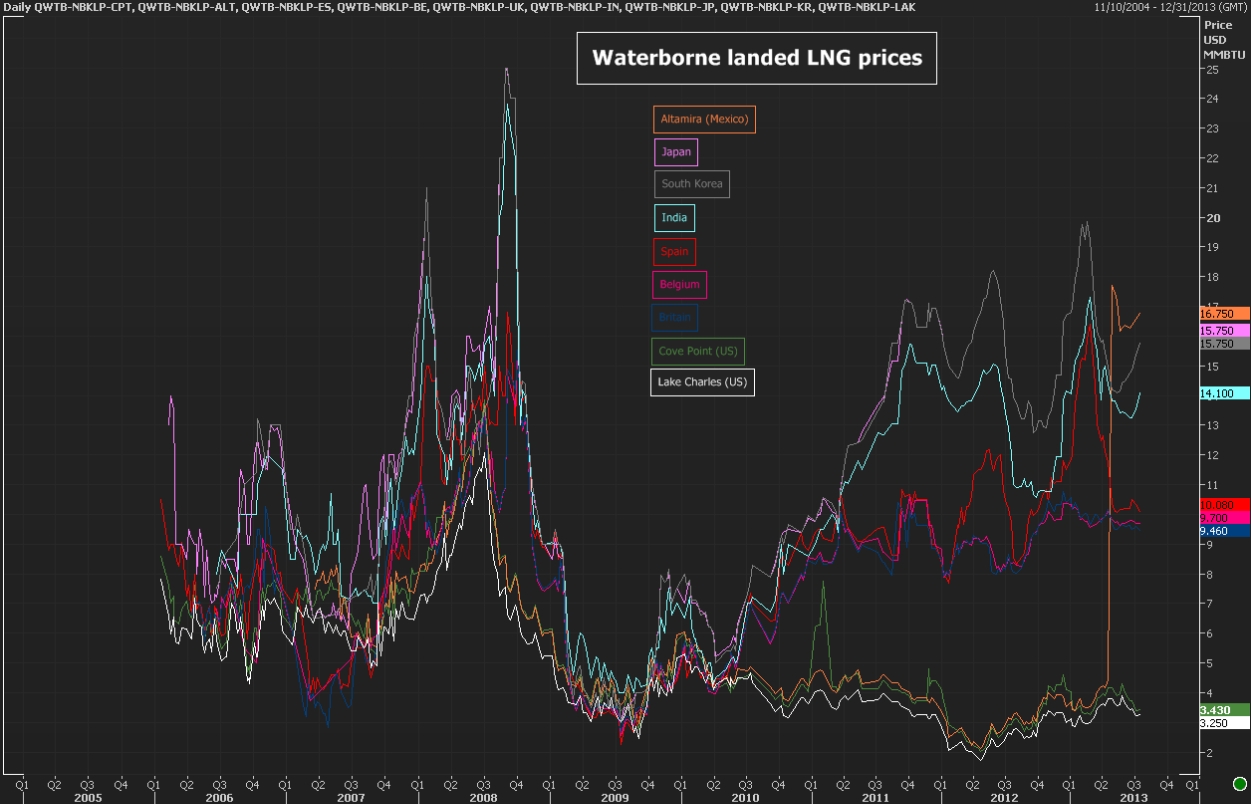
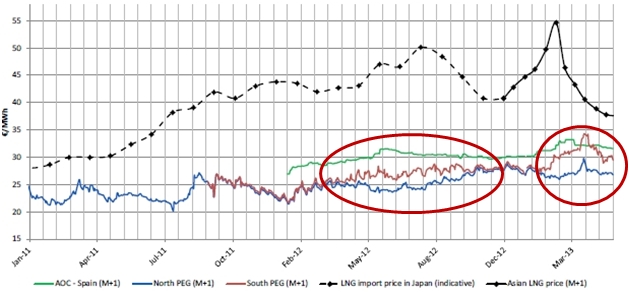
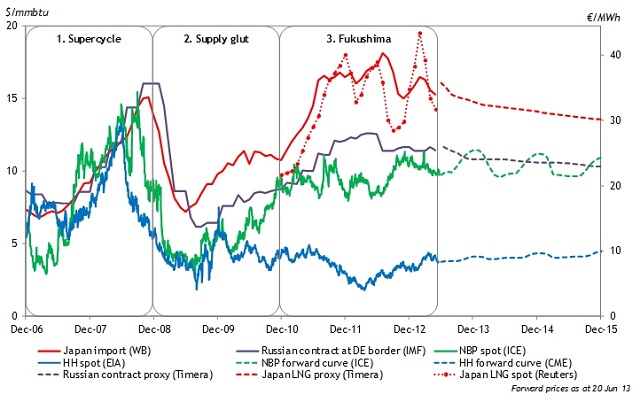
The structural Asian price premium that has seen a growth in European reloads is a specific phenomenon of post-Fukushima Asian LNG spot pricing.  Reloaded volumes have broadly coincided with periods of high Asian or South American spot prices which have uncovered a substantial premium over shipping cost differentials.  The incentive to reload can be seen by comparing the Japanese LNG spot price with NBP hub prices in Chart 2.  In periods of high spot prices, the differential to send gas to Asia significantly exceeds the shipping cost of around $2.50/mmbtu.

Chart 2: Global gas price differentials driving reload volumes (source Timera Energy)

global gas prices2

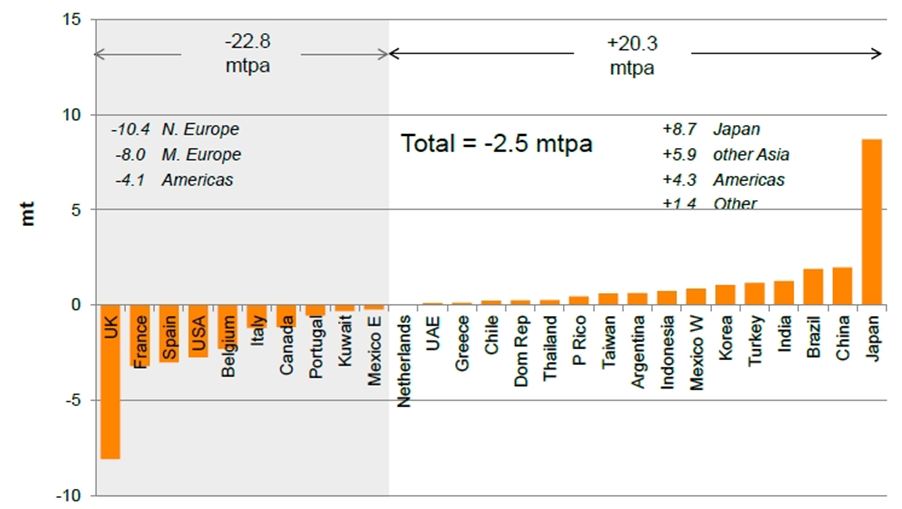
However European cargoes are not always re-exported outside Europe.  Soft LNG spot prices in Asia and South America across summer 2012 caused the spread between these markets and Europe to narrow sharply.  But the flow of reloaded cargoes shifted to premium European markets (mainly Italy and Turkey) with a lower absolute price premium but also lower shipping costs.  Destination markets for European reloaded cargoes can be seen in Chart 3.

Chart 3: 2012 European LNG reloaded cargo numbers by destination (source GIIGNL)

reload by destination

What factors drive the decision to reload gas?

The flow of divertible LNG supply contracts tends to track shipping cost differentials reasonably closely.  But the drivers of cargo reloads are more complex.   A reloader of LNG incurs a set of direct costs levied by the terminal operators.  These costs are typically regulated and vary by country but are in the order of $0.6-0.8/mmbtu.

But the party reloading gas also faces a number of logistical constraints and associated costs.  Time is money with LNG, given energy lost via boil-off and transfer of gas.  Reloading of gas blocks a terminal for longer than unloading (it can take 4-6 days), and terminals always provide priority access for regasification over reloading.  There are also constraints around scheduling of reloads and how long gas can be kept in terminal tanks before it needs to be discharged.  These logistical factors mean that the true cost of reload is well above the direct cost paid to the terminal operator.  In other words a premium well in excess of shipping costs is required to incentivise the re-exporting of gas.

The future for European reloading

Although plans are being discussed to adapt other European terminals for reload (e.g. GATE), there are some factors working against growth in the re-exporting of gas.

From a global value perspective, reloading is an inefficient practice.  Alleviating supply contract destination clause constraints to avoid reload costs should be a ‘win win’ outcome that increases value for a buyer & seller to negotiate.  Over time, this will likely be reflected in supply contract renegotiation, reducing the requirement to reload gas.

However there are some practical considerations from an individual party perspective that may cause inefficiencies to remain.  Reloading has the benefit to the LNG buyer of removing any requirement to share diversion upside with the seller (a practice that is common with divertible supply contracts).  The seller (or LNG producer) may also place a premium on being able to control the flow of LNG.  This is particularly relevant for Qatar, given the price it receives for uncontracted gas can be influenced by the impact of Qatari LNG flows on spot pricing.

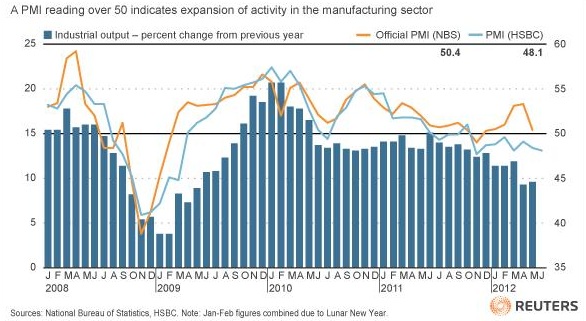
But perhaps the most important threat to reloading comes from a narrowing in global LNG Spot price differentials.  A fall in Asian spot prices in Q2 2013 has already stemmed the volume of reloads this year.  Looking forward, a slowdown in Chinese growth and Japanese nuclear restarts may continue to constrain global price differentials.  In this environment, the reloading of European LNG is likely to be focused on shorter term opportunities driven by spot market volatility, rather than the structural flow of re-exported gas seen over the last two years.


A break for summer

We are taking a short break with the blog over summer, but will be back on 26th August.  Some of the articles lined up over the next few months include:

  • European LNG cargo reload dynamics
  • The rise of central planning in European power markets
  • Rhetoric vs Reality on UK shale gas impact
  • The looming downturn in the LNG shipping market
  • European gas supply contract re-openers

In the meantime we leave you with a chart that summarises the divergent state of pricing in the global gas market.  Courtesy of Reuters and Waterborne, the chart shows the landed prices for LNG at key delivery points around the world.

waterborne spot LNG

Source: Reuters based on Waterborne data

In an historical context, the gas market’s post Fukushima state of regional price divergence is an anomaly.  With Asian growth slowing, Japanese nuclear plant coming back online and US exports looming, it takes a brave person to bet against a pronounced narrowing in global gas price differentials over the second half of this decade.

Price divergence at PEG Sud

The pace of price convergence across European gas hubs over the last 5 years has been one of the great success stories of an integrated European gas market.  Price signals from the more liquid Northern European hubs (NBP, TTF and NCG) are increasingly penetrating into Southern Europe as transport capacity access improves.  But the PEG Sud hub in the South of France has taken a path of its own over the last 18 months, as the global LNG market has trumped price signals from Northern Europe. 

Price differentials reflect transportation constraints

Despite regulatory ambitions to evolve to a single French gas hub, France is for all practical purposes two gas markets.  The PEG Nord hub is well interconnected with North West Europe and forward prices have converged to reflect this.  There are however three factors that can contribute towards price separation in Southern France:

  1. LNG import flows
  2. Constraints on the North-South link within France
  3. French-Spanish interconnector flows

The French gas hubs and infrastructure are illustrated in Chart 1.

Chart 1: French gas market zones and infrastructure

PEG_map

Source: Elengy

The south of France is much more dependent on LNG imports than the north.  The structural Asian LNG spot price differential post Fukushima has resulted in large volumes of French LNG supply being diverted (or reloaded) and sold to Asian buyers.

The diversion of LNG supply has left a deficit of gas in Southern France that needs to be met via imports from the North.  This has been exacerbated by Spanish demand across the France- Spain interconnector, with Spanish gas prices typically higher than France, particularly as large volumes of Spanish LNG have also been diverted to Asia.  Constraints in the ability to transport gas from the more liquid PEG Nord to its southern cousin PEG Sud (via the North South link) have lead to some interesting periods of price divergence as shown in Chart 2.

Chart 2: French price differentials

price_spreads

Source: CRE based data from Heren and Bloomberg

These periods of PEG Nord vs PEG Sud price divergence have been more pronounced over the spring/summer of 2012 and 2013, with the price spread closing over winter 2012/13. This has been due to several factors:

  • Broad correlation with higher LNG spot price signals, reflecting a greater incentive to divert gas supply, with cargo reloads particularly sensitive to higher spot prices given the greater costs involved.
  • Strong storage injections in the South of France in both 2012 and 2013, as storage facilities have entered the summer with relatively low inventory levels (particularly given cold snaps in Feb 12 and Mar 13).
  • Capacity availability issues on the North Sea Link, particularly in 2012 when system issues prevented GRTgaz (the system operator) from marketing available interruptible capacity.

The very pronounced PEG Sud price spike in Mar 13 reflects contagion from the NBP price spike where spot prices temporarily increased towards the level required to draw in spot LNG cargoes.

What does the future hold?

CRE (the French regulator) has shown clear concern over price divergence across French hubs.  CRE has run an industry consultation on the causes and implications of the price decoupling over 2012-13.  The CRE review highlighted issues around transparency and availability of short term capacity, definitely factors which are within its remit to improve.  But as long as a structural LNG spot premium pulls gas away from France, physical transmission constraints on the North-South link may continue to drive price divergence.

One of CRE’s responses has been to push for a single balancing region across France (targeted for 2018).  But this aim somewhat misses the point.  A single balancing region and price would mask the true cost of the North-South transportation constraint by removing the ability for prices in the south to decouple from the north.  It is this price separation that is providing an important incentive for players to optimise portfolio gas flows in response.  A single balancing zone would leave the flow optimisation activities to the system operator (with any costs likely to be smeared across market participants).

A single hub in France is an admirable long term ambition, but it is the underlying transmission constraints that need to be addressed first.  Upgrades on the France-Spain interconnector in 2013 and 2015 are likely to add to price pressure in the south of France, as greater volumes flow to Spain.  This may set up an interesting pricing dynamic where Spanish gas prices are increasingly influenced by pricing in France, but at the same time are contributing to hub price divergence across France.  In this situation, volatility across French hub price signals may be a key factor supporting the value of gas supply portfolio flexibility within France.

Big trouble in little China?

Chinese economic growth is the primary driver of the evolution of global commodity market demand, as we have highlighted previously.  Energy markets are no exception.  China consumes 47% of global coal production and Chinese gas imports are projected to account for around half of global LNG demand growth.

A slowdown in Chinese growth has been the main force behind a sell off in commodity markets this year.  Chinese economic weakness also threatens Europe’s ability to recover from recession, with the potential to cause further declines in European power and gas demand.  There are two main sources of concern in China:

  1. The manufacturing sector, the engine room of the Chinese economy, is shrinking again.
  2. There are some concerning early warning symptoms of a credit crunch in an economy where growth has been propped up by credit expansion.

Optimists point to China’s ability to manage these risks through a centrally planned solution.  But both these issues are side effects of previous bouts of central planning:  industrial overcapacity from fiscal stimulus in the case of manufacturing weakness and monetary stimulus in the case of credit growth.  The extent to which the Chinese authorities can ‘manage’ growth and asset bubbles is likely be put to the test over the next 12 months.  The outcome will be of key importance to commodity markets.

Manufacturing turns south… again

Since we last wrote about Chinese manufacturing growth, there has been a minor recovery as the eurozone crisis eased in the second half of 2012.  But the recovery has been short lived, with a sharp fall over the last 3 months back into negative territory as shown in Chart 1.

Chart 1: Chinese Manufacturing Purchasing Managers Index

china PMI

Source: HSBC, Markit

Evidence of a slowdown is supported by a decline in Chinese power consumption (now at its lowest level since 2009) shown in Chart 2, a key factor behind weakness in the global coal market over the last two years.

Chart 2: Chinese power demand

china power 2

And a decline in Chinese exports shown in Chart 3.

Chart 3: Chinese export growth (yr on yr) since the financial crisis

china exports

Source: Zero Hedge

Symptoms of a looming credit problem

Credit growth has been a key central planning tool used by the authorities in China to ‘control’ its recovery since the onset of the financial crisis.  The rapid credit expansion since 2009 is clearly illustrated in Chart 4.

Chart 4: Chinese credit growth

china credit growth

Incremental credit growth has been focused in the poorly regulated shadow banking sector (i.e. non-bank financial intermediaries), an issue which the authorities have recognised as a risk they intend to address.  The first real hint of the side effects of this rapid credit expansion emerged in June 2013 with a sudden spike in stress in the interbank lending market in China shown in Chart 5.  This is somewhat reminiscent of the LIBOR issues that signaled the onset of credit stress in the USD interbank market in 2007-08.

Chart 5: Surge in China’s interbank lending rates

shibor chart

Source: Bloomberg, DoubleLine Capital

While China has acted quickly to inject liquidity to bring down interbank rates it faces a tough balancing act. The more the authorities support liquidity now, the worse the risk of a more serious credit crunch in the future.  This is a problem which the authorities appear to be aware of based on their tolerance for interbank rates to settle at higher levels since the initial spike.

But the central bank in China has little experience of managing a credit crunch.  At some stage defaults on bad loans threaten to materially erode Chinese growth.  This risk is well summarised by Satyajit Das, an independent risk expert who gave a number of prescient warnings on credit risk prior to the onset of the global financial crisis:

The reality is that a significant part of China’s growth since 2007-08 has been an illusion. Its headline growth of 8-10 per cent since then has been driven by new lending averaging 30-40 per cent of GDP. Up to 20-25 per cent of these loans may prove to be non-performing, amounting to losses of 6-10 per cent of GDP. If these losses are deducted, Chinese growth is much lower.

Credit contagion threatens to damage the Chinese economy much more quickly than a manufacturing slowdown.  China has made it clear that it does not intend to enact another major fiscal stimulus package like the one in 2009 given the risk of fueling further imbalances in the economy.  So as manufacturing slows and credit issues intensify, China’s central planners are running out of options to support growth.

The energy industry has become accustomed to the impacts of consistently high levels of Chinese demand for coal and gas.  There is certainly a compelling long run story around China’s requirement for energy imports.  But the current risks to China’s economic growth may warrant a review of ambitious assumptions on Chinese energy demand growth over the remainder of this decade.

Security of supply concerns intensify in UK power market

As of June 2013, the official view of security of supply risk in the UK power market has increased again.  Ofgem’s recently released Capacity Assessment report sets out a further deterioration in the regulator’s projections of the UK capacity balance.  The risk of customer disconnections, measured as high as a 1 in 4 chance in a scenario where the impact of the government’s efficiency measures fails to materialise, is again making national headlines.

The capacity crunch unfolds

The risk of a UK capacity crunch mid-decade has been one of the consistent themes of this blog.  In August 2011 we published an article setting out the case for a UK capacity crunch driven by closures of conventional capacity and lower renewable build rates.

In October 2012 Ofgem presented its first UK Capacity Assessment supporting the view that there was an increasing risk of a capacity crunch mid-decade.  At the time, we published another article setting out our view that:

  1. Ofgem’s public concerns and a deterioration in the UK capacity situation would significantly increase the political pressure for regulatory action
  2. Ofgem’s assumptions on capacity levels looked overly optimistic (particularly given risks around the retirement of conventional capacity)
  3. The likely reaction of the regulatory authorities would be to enable Grid to contract reserve to support existing conventional capacity

All three of those views appear to have been confirmed in Ofgem’s latest Capacity Assessment.

What is Ofgem worried about

Conventional plant retirements are a key cause of concern for Ofgem.  Since its first Capacity Assessment (Oct 12) market participants have announced an additional 2GW of imminent capacity closures.  Ofgem estimates a further 1GW by 2015/16.  These factors have caused Ofgem to project a more rapid tightening of the UK power market capacity margin compared to their analysis in October last year (as shown in Chart 1 below).  But we again believe that these numbers may be optimistic.

Chart 1: Ofgem projections of de-rated capacity margins for the UK power market

derated margins

Utilities are still suffering from an historically weak UK spark spread environment.  Generation margins on older CCGT are at the level, or in some cases, below the level of station fixed costs.  This capacity is at risk of mothballing or closure if spreads remain weak.

The most vulnerable CCGT plants for retirement are older, less flexible gas plant built in the 90’s dash for gas.   These assets were not designed for current conditions of low load factor running, with constant ramping and multiple starts causing increased costs through asset fatigue.  With some assets, investment in measures to improve flexibility can improve plant economics.  But there are a number of CCGT plants where flexibility improvements and fixed cost reductions are technically constrained by plant components and configuration (particularly in relation to the Heat Recovery Steam Generator).  It is these assets that are at greatest risk of retirement over the next three years, causing a further reduction in the UK capacity margin.

There are two other key risks to the capacity equation:

  1. Renewable build falls further behind target, with a particular risk around offshore wind as we set out here
  2. Ofgem’s assumption of a 3GW reduction in peak demand by 2018/19 due to the impacts of government efficiency measures does not materialise

Both of these factors depend on an improvement in the fortunes of the government’s EMR policies.

How will Ofgem react

In its first Capacity Assessment Ofgem raised the yellow flag on the risk of a capacity crunch.  Ofgem has taken a step further in this Assessment by proposing policy measures to stem the risk.  Ofgem’s report contains what appears to be a carefully worded joint statement:

Ofgem, DECC, Grid all agree ‘that it is prudent to consider the case for additional tools to help National Grid balance the electricity network during the middle of this decade when capacity margins could be tight.’

But Ofgem also makes it clear that they expect DECC to define an acceptable level of security of supply risk:

We expect DECC to define a reliability standard for the GB market through their EMR Delivery Plan. A reliability standard indicates the accepted level of risk in the market. It represents a trade-off between the level of security of supply and the investment required to achieve that level.

Ofgem’s concern around security of supply has lead it to propose two intervention options outside the wholesale market for industry consultation:

  1. Demand Side Balancing Reserve payments which allow Grid to contract demand side reductions
  2. Supplementary Balancing Reserve payments which allow Grid to contract generation capacity to protect security of supply

The latter payment looks to be consistent with what we were suggesting last October.  A ‘stop gap’ mechanism for Grid to bilaterally contract capacity reserve before the Capacity Market comes into effect after 2018.

This is important news for existing UK CCGT owners and investors.  Balancing reserve payments from Grid represent an additional potential asset revenue stream.  Given these will likely be fixed, off market capacity payments, they also de-risk CCGT returns.  In our view this only strengthens the increasingly compelling case for investing in flexible existing UK CCGT assets at current depressed values.

Controlling an addiction to cheap money

The importance of central bank monetary policy in driving commodity markets has been a key theme of this blog.  Since the onset of the financial crisis, monetary stimulus has become increasingly dominant as the primary risk factor driving global financial markets.  This influence has fed through into physical commodity markets including oil, coal and LNG.

The importance of monetary stimulus to the global economy was highlighted by the market reaction to the US Federal Reserve’s June 19th announcement on ‘tapering’ its Quantitative Easing (QE) program.  The mere hint of the Fed winding back its rate of QE saw a sharp jump in long term interest rates sparking a global asset selloff.

In response, the Fed appears to be dampening speculation of any imminent reduction in QE.  But the market reaction highlights the risks of massive unconventional monetary intervention.  Global economic growth is in a fragile state and is ill prepared to deal with the shock of a sustained move higher in interest rates.

Rising interest rates

QE, the Fed’s purchasing programme of interest bearing assets, has acted to artificially suppress long term interest rates around the world. ‘Tapering’ is the term that has been coined for a reduction in the rate of the Fed’s purchases of US government bonds and mortgage backed securities.  The prospect of QE tapering has been debated across financial markets for the last few months and has been responsible for a steady rise in long term interest rates (driven by government bond yields) from historically low levels.

However the extent of the Fed tapering announcement came as somewhat of a surprise.  The timing and rate of potential reduction in QE (if warranted by economic conditions) was more aggressive than anticipated.  The market reaction to this change in policy messaging is illustrated by the jump over the last 2 weeks in US 10 year bond yields in Chart 1.  Yields across Europe and much of Asia have shot up in sympathy.

Chart 1: US 10 year government bond yield

US10yr

An interest rate shock and global growth

A sustained rise in the yield on long term government bonds has a major impact on the real economy.  Not only does it increase government borrowing costs, but corporate and household borrowing costs as well.  All loans are priced off a spread to government bond yields.

A rise in rates does not necessarily spell trouble if it is driven by an improvement in economic growth prospects.  But the unprecedented scale of central bank intervention in bond markets over the last 5 years has increased the risk of interest rate ‘shocks’ where rate rises reflect market reactions to policy risk or sovereign credit risk rather than to expectations of economic growth.

The potential damage from rising rates has been compounded by a substantial increase in the sensitivity of governments to a rise in borrowing costs.  Sovereign debt has ballooned over the last 5 years as the result of bailouts and fiscal stimulus to fight the financial crisis.

The risks around higher interest rates have been highlighted in a recent report ‘Making the most of borrowed time’ presented on Jun 23rd by the General Manager of the Bank of International Settlements (BIS) in Basel (the ‘bank for central banks’).  Chart 2 from this report illustrates the rapid growth in global central bank monetary stimulus (left hand side) accompanied by a growth in sovereign debt (right hand side).

Chart 2: Growth in monetary stimulus and government debt (source BIS)

monetary stance BIS

The BIS also highlights the risk of rising interest rates to global financial institutions which hold much of the outstanding government debt.  The right hand side of Chart 3 shows the impact of a 3% rise in interest rates on the value of outstanding sovereign debt as a % of GDP for a selection of key G8 countries.  A 3% rise is not a big move when measured against historical yields (shown on the left hand side).  But the increase in impact of such a rise over the last 5 years is clear, more than doubling for most countries.

Chart 3: The risk of rising rates to financial institutions (source BIS)

rate impact BIS

Words of wisdom do not bode well for growth

As well as some interesting data, the BIS report contains a cutting summary of the impact of the way monetary stimulus has been used to fight the financial crisis:

What central bank accommodation has done during the recovery is to borrow time – time for balance sheet repair, time for fiscal consolidation, and time for reforms to restore productivity growth. But the time has not been well used, as continued low interest rates and unconventional policies have made it easy for the private sector to postpone deleveraging, easy for the government to finance deficits, and easy for the authorities to delay needed reforms in the real economy and in the financial system. After all, cheap money makes it easier to borrow than to save, easier to spend than to tax, easier to remain the same than to change.

The BIS also challenges central banks to face up to the reality of the task at hand:

Six years have passed since the eruption of the global financial crisis, yet robust, self-sustaining, well balanced growth still eludes the global economy. If there were an easy path to that goal, we would have found it by now. Monetary stimulus alone cannot provide the answer because the roots of the problem are not monetary. Hence, central banks must manage a return to their stabilisation role, allowing others to do the hard but essential work of adjustment.

Only time will tell whether the Fed and other central banks heed this prescient warning.  The Fed’s public deliberations over QE tapering may be a signal of its own concerns over the risks and limitations of ongoing monetary expansion.

Regardless, the recent market reaction to the prospect of QE tapering highlights the risk of a move higher in global interest rates.  Cheap money may have made it easier for the global economy to absorb the fallout from the financial crisis.  But it has left global growth, and in turn commodity markets, particularly vulnerable to a normalisation in borrowing costs.  As energy companies manage their portfolio exposures to oil, coal and gas, they are increasingly faced with an implicit exposure to interest rates.

Global gas price differentials

‘Asian natural gas prices are four times prices in the US’.  This is a striking statement that has got a lot of airplay over the last two years.   Pronounced inter-regional gas price spreads sit in stark contrast with a relatively narrow global price range for the other global energy commodities, crude oil and coal.

Global price divergence in the gas market is a function of two main drivers:

  1. It is expensive to liquefy, transport and store gas as LNG.
  2. The LNG market is relatively immature, with a limited volume of destination flexible supply (flexibility is constrained by source to destination restrictions imposed by long term contracts).

Physical and technological constraints mean it will always be a more expensive business moving gas than oil and coal.  But rapid growth in the LNG spot market, development of price signals and expansion of infrastructure will over time act to erode global gas price differentials.

Regional price drivers

Spot prices for natural gas delivered in July 2013 are shown in Chart 1 across different regions.

Chart 1: A July 2013 overview of global spot gas price benchmarks (USD/mmbtu)

lng prices

Source: Waterborne, US FERC (prices as at 7th June).

There are distinctly different drivers of spot gas prices across different regions of the world.  Regional pricing is best understood by grouping the markets illustrated in the chart into five regional zones:

North America  is a market where gas pricing is driven by trading at the liquid and transparent Henry Hub (HH).  Current HH spot price levels below $4/mmbtu, reflect the impact of a surge in unconventional shale gas production over the last 5 years.  A rapid transformation from tightness to oversupply and a lack of export infrastructure has effectively left gas ‘trapped’ in the US market.  But contango in the HH forward curve reflects a future of growing US exports and increasing production costs.

Northern Europe is also a market driven by liquid hub prices, primarily at the UK NBP, Dutch TTF and the German NCG.  But unlike North America, hub pricing tends to remain within a band of oil-indexed pipeline contract prices.  This reflects the dominance of these contracts in determining marginal price dynamics at European hubs.

Southern Europe is increasingly influenced by the larger and more mature Northern European market.  The Italian market has largely converged with European hub prices.  Spanish gas prices tend to be higher than those in Northern Europe to reflect the impact of oil-indexed contract prices and at times global LNG prices on marginal pricing.  But the relative isolation of the Iberian peninsula will decline given new interconnection under development with France.  European hub price convergence is likely to follow.

Asia is the key driver of LNG market growth.  Most gas is delivered under long term oil-indexed contract prices, typically signed at a substantial premium to US and European hub prices.  While oil-indexed LNG contract prices act as a loose anchor for Asian spot prices, substantial spot price swings are common.  Asian spot prices typically trade within a range between a European hub price driven ‘floor’ and an Asian oil-equivalency driven ‘cap’.   The prevailing spot price premium over Europe is a barometer for how much spot supply Asia needs to attract to satisfy demand.

South/Central America is a relatively small gas market by volume.  But buyers in countries such as Argentina, Brazil and Mexico can have a disproportionate impact on global spot pricing.  Buyers tend to have low levels of contract cover and often purchase LNG in ‘blocky’ parcels in the spot market or via shorter term tender.  In doing this they are typically competing for available LNG against Asian buyers.  Hence spot price levels tend to trade within a band of Asian spot prices.  Perhaps the greatest global pricing anomaly at the moment is the size of the premium that South/Central American buyers are paying over US gas prices.

What does the future hold?

As with most commodity markets, the market consensus view of future outcomes is heavily influenced by current market conditions.  The prevailing tightness and regional price divergence across the global gas market reflects a post-Fukushima world of strong Asian demand and a temporary hiatus of new liquefaction projects.  While these conditions are likely to remain until 2015, the second half of this decade may be a very different picture.

Pricing beyond 2015 will be driven by the balance of market power in the next phase of LNG market expansion.   Large new liquefaction projects in Australia, Canada and East Africa are looking for long term oil-indexed buyers to underwrite capital costs.  These projects are competing against US export projects that enable buyers to source Henry Hub indexed gas.  To a large extent the next phase of LNG market expansion will depend on the scale of a much anticipated surge in Chinese import demand.  But the drivers behind Chinese LNG demand are complex and any significant disappointment in demand growth could well tip the gas market back into a state of oversupply later in the decade.

The global gas market may currently be characterised by regional price divergence.  But with growth in the LNG spot market and the development of new infrastructure, structural price premiums like the one between the US and Asia will be eroded.  The cost of moving and storing gas will prevent global gas market convergence to the extent it has occurred in oil and coal markets.  But as the LNG market evolves, it is transport cost differentials rather than structural price premiums that will drive inter-regional price spreads.

Beware of proxy risk

Supply contract pricing terms are a key driver of marginal gas pricing dynamics in spot and forward markets. Contract prices can vary widely and terms are typically highly confidential. However similar structures tend to be used to price gas in different regions. For example Russian gas into Germany is predominantly indexed to gas oil and fuel oil on a six to nine month time lag.

The similarity in contract structures mean that proxy curves can be used to project the evolution of contract prices, as we set out in a recent article. Using proxy curves to gain an insight into the evolution of contract prices has important commercial applications. For example:

  • Market analysis: Proxy prices for oil-indexed Russian supply contracts can be used to understand the influence of flexible Russian contract volumes as a key driver of European hub pricing dynamics
  • Asset and contract valuation: Using proxy prices to understand the evolution of existing supply contract price levels is an important input when valuing new gas supply contracts
  • Hedging: Proxy prices can be used to calculate the forward exposures of a portfolio supply contract to liquid traded products in order to support forward hedging decisions

The application of proxy curves however comes with a few health warnings.

Getting a handle on proxy risk

The use of proxy relationships in market analysis, asset valuation or hedging decisions can add additional risk that warrants explicit consideration. Proxy risk is where outturn prices differ from those implied by the proxy relationship leading to unexpected financial loss or gain.

There are two main causes of proxy risk:

  1. A poorly fitting proxy relationship between contract price and the underlying traded products to which it is indexed
  2. Implied exposures evolving or breaking down over time (e.g. from the increasing influence of gas hub pricing on European contract prices).

The first cause can be managed via a diligent proxy development process and common sense in proxy application (i.e. don’t place too much weight on a poorly fitting proxy). The second is more subtle and requires regular reassessment of the proxy curves to test integrity and suitability.

Case study: Proxy risk and the Average German Import Price

Arguably the most important use of proxy analysis in the European gas market relates to the opaque pricing of pipeline import contracts.  It is common to use a proxy curve to forecast the value of the Average German Import Price (AGIP) published by the German ministry.

AGIP is an ex-post assessment of prices of gas imported into Germany.  The vast majority of imported gas is under long term pipeline contracts indexed to gas oil and fuel oil (primarily Russian but also from the Netherlands and Norway).  As such AGIP proxies will show strong relationships to averaged and lagged gas oil and fuel oil prices.  However the basket of imported gas changes over time causing changes in the best fit proxy.

As an illustration, we have fitted a gas oil and fuel oil proxy for each of the last 5 years (i.e. each year, 12 months are added to the data used to calibrate the proxy to assess how it evolves).  For simplicity we have used (9, 1, 1) – 9 month average, 1 month lag, fixed for 1 month – averaging logic for gas oil and a (3, 1, 1) for fuel oil and held this constant over all years for ease of comparison.  In practice a better fit could be found using more complex averaging rules.  The “best-fit” may also vary from year to year.  The table below summarises the constants, coefficients and R2 for each year.

Table 1: AGIP proxy parameters

Constant GO slope FO slope R^2
Oct-08 501 9.4 4.3 99%
Oct-09 159 11.1 2.8 98%
Oct-10 40 11.3 2.7 97%
Oct-11 662 10.9 0.8 93%
Oct-12 1,423 10.6 -1.0 92%

The chart below shows the prices as predicted by each of the proxy curves against the outturn AGIP prices.

Chart 1: Evolution of AGIP proxy curves

 AGIP Proxy Evolution

Both the table and chart illustrate proxy risk in relation to AGIP prices.  This can be seen in the chart where the 2008 and 2009 proxy curves provide a relatively good forecast of future prices, but the relationship starts to breakdown from the end of 2010 as actual prices disconnect from forecast prices.  Relying on the 08-09 proxy relationship would have resulted in realised prices being structurally different from forecast, potentially distorting contract valuations and exposure measurement.

The breakdown in proxy relationship is also shown in the parameters of the proxy curves.  The R2 (a measure of how well the proxy fits the historic data) begins to fall in later years.  The coefficient for each subsequent regression also becomes less stable reflecting the changing influences of the price of German imports.

As an example of proxy risk impacting hedging decisions, AGIP was used as an indexation term in the Ruhrgas release auctions in the mid 2000.  This meant that development of an AGIP proxy curve was important for informing pricing and hedging decisions (i.e. the slope coefficient can be used to imply the exposures to gas & fuel oil).  If the AGIP proxy relationship had not been adjusted for changes in index or market conditions, proxy analysis would have likely resulted in unobserved residual oil and FX exposures.  The gas oil coefficients implied for the proxies are relatively stable but the fuel oil less so (actually changing sign in the last year).

The breakdown and evolution of the AGIP proxy behaviour is consistent with the changing influences over the pricing of German imports.  For example, growing levels of gas hub indexation and changes from reopener negotiations will both influence proxy price behaviour, requiring a re-adjustment of proxy fit.  An initial starting point is to introduce gas hub prices into the proxy to improve the fit.

Proxy risks do not invalidate proxy analysis. Proxy curves are a useful tool in support of market analysis, asset valuation and hedging decisions. But it is important to define and understand the factors that may drive differences between outturn and projected prices. Most importantly an appreciation of proxy risks strengthens the commercial applications of proxy analysis.

Feeling the pain of European generators in 3 charts

Conventional generation portfolios in Europe have had a tough two years.  The policy environment has been hostile and the slide in wholesale power prices unrelenting.  As load factors on thermal plant have declined, utilities have scrambled to reduce their generation cost base and increase asset flexibility.  But these actions have done little to stem earnings erosion at a time when most balance sheets are already under pressure.  Material from a recent RWE investor presentation provides a useful case study for the plight of the generation businesses of European utilities. 

Policy and market headwinds

We have set out in a number of previous articles the drivers behind the deterioration of thermal generation margins.  The key driver has been a substantial and growing overcapacity problem across much of North West Europe, particularly in Germany.  Large volumes of subsidised renewable capacity have been developed by investors who are insulated from market price signals via ‘feed in tariff’ policy support.  This has coincided with a period of weak demand.

The impact on gas-fired generators has been exacerbated by a decline in competitiveness as coal prices have softened.  Gas plants have been driven out of the merit order in Continental Europe as spark spreads have continued their decline into negative territory, illustrated for Germany in Chart 1.  Full auctioning of carbon credits has not helped either, although the influence of carbon has diminished with EUA prices under 5 €/t.

Chart 1: The evolution of German forward spark and dark spreads

spreads

Source: RWE Supply and Trading

Conventional generation has become a value drag

RWE has recently provided some insight into the pain that its 44GW of conventional generation assets are inflicting on its portfolio across DE, UK and NL.  RWE states that 20-30% of its conventional generation assets are suffering negative free cash flow.  This is presumably driven by gas plants that are not earning a return that covers station fixed costs.  A further 20% of plants are under water on an Operating Result (OR) basis (once non-cash overheads are factored in), with OR either negative or below weighted cost of capital (WACC).  This is a pretty grim picture for a generation portfolio that has historically been one of the pillars of RWE’s business model.  It is also illustrative of a problem that most European utilities are facing.

Chart 2: A generation portfolio under pressure

profitability

Source: RWE Supply and Trading

Reacting to the pain

RWE and other utilities are responding to this environment by cutting operating costs, mothballing plant and in some cases closing or selling assets.  Negative sentiment by the big utilities is reflected in unusually high levels of forward hedge cover on generation portfolios.

The decline in RWE’s projected returns on conventional generation assets is illustrated in Chart 3.

Chart 3: RWE’s vision for the future

impact

Source: RWE Supply and Trading

This chart raises the interesting question as to how utilities are going to replace declining generation margins.  Here the approach across European utilities is somewhat different.  But there are some consistent themes:

(i)  An increasing exposure to renewable energy

(ii)  A shift outside the comfort zone of the core utility business model e.g. via growing upstream gas/oil exposure

At first glance (i) appears logical given it is renewable assets that are claiming generation market share from conventional assets.  But when it comes to renewable investment the low hanging fruit have been plucked.  New projects tend to be increasingly capital intensive and/or risky.  An increasing consumer awareness of the cost of policy support is also creating headwinds.

Utilities such as Centrica have been focused on (ii) and there again appears to be an attractive portfolio synergy logic.  Exposure to upstream gas reserves can offset the negative impact of rising commodity prices on retail margins, in a world where tariff increases are under constant regulatory scrutiny.  Centrica is a well managed company and a better bet than most to pull off this transition.  But history has not been kind to energy companies or utilities that have based their growth plans on a step away from core business.  Successful upstream companies have also typically had a very different capital structure and risk profile to utilities.

Time will tell whether European utilities transform or shrink, but in the meantime deteriorating market conditions are likely to cause implicit or explicit writedowns in coventional asset value.  Asset owners are striving for plant with a low fixed cost base and high flexibility.  But for a number of older and less flexible thermal assets, the numbers do not add up.  We suspect a more substantial capacity clear-out is still to come and this is just what is needed to stabilise the returns on remaining assets.

A snapshot of incremental supply and demand in the LNG market

There is set to be a shift in the tectonic plates of the global LNG market in the second half of this decade.  Large uncontracted volumes of new supply in Australia, Canada and East Africa are competing with US export projects to serve what is anticipated to be strong growth in import demand, particularly from developing economies.

However there is little in the way of new LNG supply that will come into the market before 2015.  So the dynamics over the remainder of the first half of this decade are likely to be quite different.  The rapid expansion of new liquefaction capacity over the 2009-11period is now over and LNG supply in the medium term looks to be relatively inelastic.  The evolution of LNG pricing over the next two to three years will to a large extent be determined by fluctuations in demand from uncontracted buyers (e.g. China, India, Brazil and Argentina) as well as Japanese nuclear restarts.  An analysis of incremental supply and demand in 2012, services as a useful indication of things to come over this medium term horizon.

A decline and shift in global supply

Chart 1 shows a snapshot of incremental changes in supply over the 2012 year.

Chart 1: 2012 incremental supply

2012 inc supply

Source: BG/Waterborne

There are two key factors at work.  A number of developing countries that are existing LNG exporters, are struggling with feedgas issues (e.g. Indonesia, Algeria and Egypt).  Strong domestic gas demand is eating into the feedstock for LNG export terminals.  Contractual obligations are typically being met, but there has been a reduction in uncontracted gas exports.  As an offset to this decline in supply, there have been several new LNG projects that have come online (e.g. Pluto in Australia) or existing LNG facilities that have increased exports.  But the net effect is clear.  Global LNG supply declined in 2012, a rare event historically in what has been a rapidly expanding market.

A more pronounced shift in global demand

Chart 2 shows a snapshot of incremental changes in demand over the 2012 year.

 Chart 2: 2012 incremental demand

LNG 2012 Incremental Demand

Source: BG/Waterborne

A clear trend can be seen from this data, with spot market buyers paying a price premium to attract supply away from Europe (and to a lesser extent North America).   Japan is an outlier with its 2012 demand reflecting a continuation of LNG purchases to make up the shortfall of gas post Fukushima.  But the other incremental buyers of LNG tend to be developing economies with relatively low levels of long term contract cover.

Watch these trends going forward

Any changes in the trends shown in 2012 will likely accompany a change in price dynamics.  An increase in feedgas issues or a rise in developing economy demand could materially tighten the global market and increase the spot price premium over European hubs.  On the other hand, a weakening in Asian growth or a sharp decline in Japanese demand due to nuclear restarts could drive global LNG spot price convergence.  The 2012 snapshot provides a useful insight into the drivers that are likely to prevail in the LNG market over the next 2 to 3 years.