A practical view of the flexibility value of gas and power assets

Flexibility value has become a popular concept in energy markets.  At a qualitative level the benefits of flexibility are reasonably well understood.  Increasing intermittency in power markets requires flexible backup.  This has a knock-on impact with gas markets where supply flexibility is evolving in response hub price signals.

What is less well understood is how to analyse and quantify the flexibility value of gas and power assets.  Investors in particular continue to be wary of paying for ‘extrinsic value’, the more technical jargon for flexibility value.  This is with some justification given that extrinsic value is often inflated via theoretical modelling analysis, rather than being demonstrated via a more practical analysis of how asset flexibility can be realised in the market.

But current market conditions are forcing asset investors and owners to confront extrinsic value.  Relative pricing dynamics mean that flexible gas & power assets increasingly have ‘at the money’ optionality characteristics, meaning extrinsic value is a key component of asset value.  Take two examples:

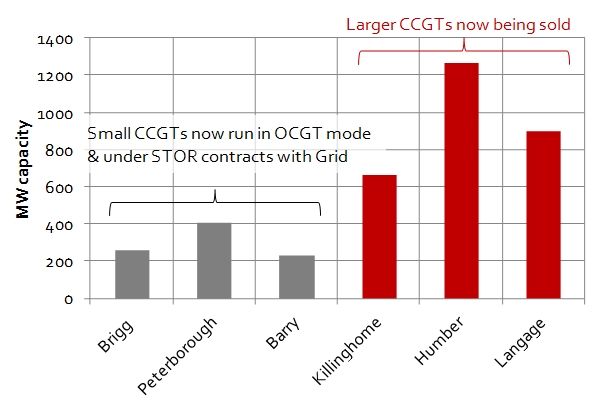
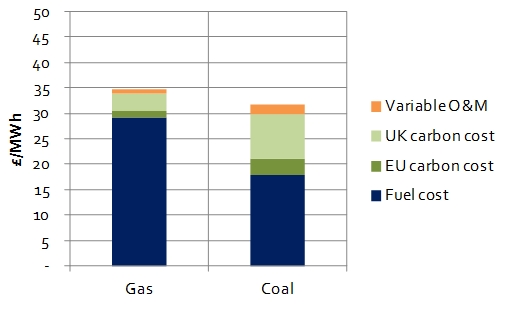
  1. CCGT’s across Europe have been driven out of merit as coal prices have fallen relative to gas prices.  As a result most assets have variable costs that are at or above the level of wholesale power prices.   In other words they can be characterised as strips of ‘at the money’ or ‘out of the money’ options with capture of extrinsic value being a key focus.
  2. Gas storage assets have faced a steady decline in seasonal (summer/winter) hub price spreads over the last 5 years.  As a result the intrinsic value that can be locked in against forward prices has fallen and storage flexibility has become more focused on monetising volatility across spot and forward prices (extrinsic value).

Extrinsic value is about more than prompt volatility

There is a common misconception that extrinsic value is all about capturing short term (or prompt) volatility in market prices.  While a theoretical modelling approach may promise high returns from flexibility to respond to short term price movements, there are practical limitations in monetising this value.  Risk appetite, liquidity constraints and transactions costs all present hurdles.  And given day-ahead and within-day prices for gas and power can be very volatile, forward hedging of assets tends to reduce short term extrinsic value access.

However extrinsic value is more than just prompt volatility.  To appreciate this concept it is important to clarify the two components of asset value:

  • Intrinsic value refers to value that can be observed (and hedged) against current forward market prices.
  • Extrinsic value refers to all other value that can be generated by the flexibility of the asset to respond to changes in forward prices, but cannot be observed/hedged at the time of valuation.

As well as short term price fluctuations, extrinsic value includes more substantial deviations in commodity prices that were not observable in forward prices at the time of asset valuation.  The impact of the current slump in summer gas prices on gas storage asset value provides a useful case study.

Gas storage value from hub price curve swings

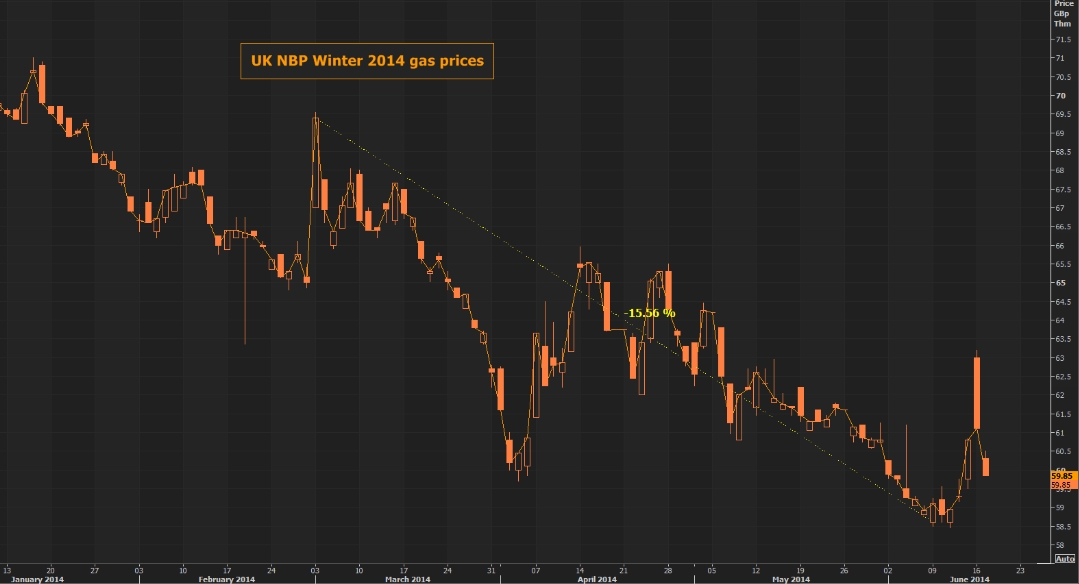
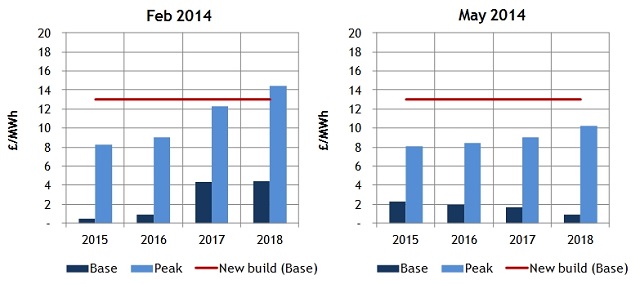
At the start of 2014 the UK NBP price spread between Summer 2014 and Winter 2014/15 was about 6p/th.   With the slump in summer gas prices that has ensued across the first half of this year, the spread between prices this summer and Winter 2014/15 has blown out towards 20p/th as illustrated in Chart 1 (yellow line shows winter contract, purple line NBP day-ahead spot and the white line the spread between these two prices).

Chart 1: UK NBP price spread between spot and Winter 2014/15

UK gas spread 2A

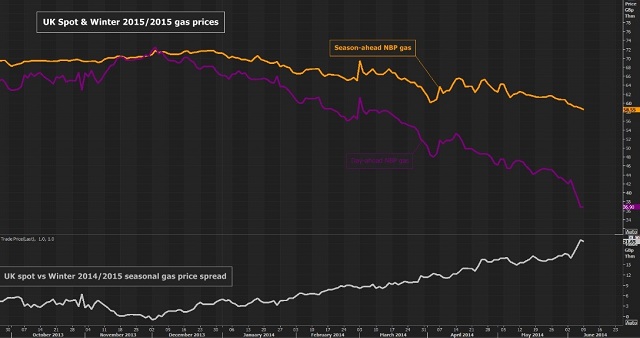
Analysis of gas storage asset value based on the extrapolation of intrinsic forward price spread conditions, misses the extrinsic value generated from price movements like the one shown above.   This is not extrinsic value generated by short term spot price volatility (although spot vol has also increased over this period).  But it is value generated from within year shifts in the relative pricing of gas along the forward curve.  The impact of the current supply glut across European hubs is focused in the current year with limited impact from 2015 and beyond (e.g. the Summer 15 vs Winter 15/16 NBP price spread is only around 8 p/th).

Values for CCGT and gas storage assets have plummeted as intrinsic values have fallen over the last 5 years.  Some of these assets are not viable investments given structural weakness in margins relative to fixed costs.  However there are also increasingly opportunities to buy good assets cheaply (e.g. at a fraction of replacement cost).

In order to do justice to flexible asset valuation under current market conditions, the valuation approach needs to reflect:

  1. A realistic simulated distribution of asset returns capturing potential movements in commodity prices
  2. A pragmatic view as to how price movements can be monetised via asset flexibility response

Over time, assets are increasingly likely to go to buyers who understand how to quantify, risk adjust and monetise extrinsic value.

Europe’s dependence on Russian gas

The protracted standoff between Russia and Ukraine came to a head last week as Russia implemented supply cuts.  But European gas hub prices hardly blinked.  In the short term, the European gas market is well equipped to deal with targeted Russian supply cuts.  Storage levels across Europe are high and a steady flow of LNG into Europe means hubs are well supplied.  Europe also no longer depends so heavily on single transit pipelines, given the development of new transport infrastructure (e.g. Nordstream).

However the Ukrainian supply problems are reminding Europe of its dependence on Russian gas.  European has shown a tougher stance against Russia this year (encouraged by the US).  For example, Bulgaria recently pulled its support for Southstream.   But while some members of the EU are pushing an aggressive stance, the response from large European importing nations has been more measured.  Countries such as Germany and Italy are acutely aware of the key role that Russian gas supply plays in their energy supply mix, both in terms of meeting current requirements and for satisfying future incremental demand.

Broader or more prolonged Russian supply cuts would be a more serious issue, but one that is much less likely.  Russia is well aware of its reliance on gas export income.  And using supply as a political tool does not play well with the customers Russia is courting to the East.  Russia is more focused on building long term export relationships than threatening existing customers.  So the unpleasant reality is that as domestic European production declines, Russia is best placed to fill the gap.  In this article we explore both the short term and long term dependence of Europe on Russian imports.

The short term impact

Anyone waiting for a big rally in gas hub prices as a result of Ukrainian supply cuts was disappointed last week.  When the Russian supply cut finally came, it only acted to illustrate how oversupplied the European gas market currently is.  Prices across the forward curve briefly spiked on Monday in a relief rally, before continuing their 2014 decline.  Chart 1 shows the spike in the NBP Winter 2014/15 contract after the announcement, which was more than reversed on the following day.

Chart 1: Evolution of NBP Winter 14/15 forward contract in 2014

Winter 1415 chart

Source: Reuters

The Russian supply cuts are primarily intended to resolve payment issues with Ukraine rather than as a broader threat to the rest of Europe.  The cuts could not have been timed to have a more benign market impact, given a mild winter, plenty of warning, ample gas storage levels and alternatives for Ukraine to source gas across the summer.

For the Russia – Ukraine standoff to have a more meaningful impact on hub prices it would need to drag on towards winter.  That is not out of the question given that gas supply negotiations are clearly linked to larger geo-political tensions.  But Chart 1 shows little concern as to this outcome reflected in forward market pricing.  Even in the case of a more prolonged dispute, Europe is much less dependent on Russian gas than in the previous periods of Ukrainian supply cuts (e.g. 2006 and 2009).

There are a number of supply flexibility options for filling a temporary import gap via Ukraine.  Gas in storage provides an important backstop (typically flowing based on the opportunity cost of alternative supply sources).  There is also room for increased Russian imports via other transit routes and some flexibility to ramp up Norwegian supply.  But gas flows will be driven primarily by commercial & portfolio considerations.  That is, gas will flow based on hub price signals.

The ultimate backstop in case of broader or more prolonged Russian supply cuts is increased LNG imports.  Europe has large volumes of un(der)-utilised regas capacity.  But importing LNG means paying up to compete with Asian and South American buyers.  Spot LNG cargoes are currently relatively cheap for European buyers given a slump in Asian prices, but prices will likely increase again as Asian seasonal demand recovers into next winter.  The last three winters have seen a 4-6 $/mmbtu price spread between European hub prices and netback Asian spot LNG prices.  That is an unpleasant gap for European buyers to bridge over a more prolonged period.

The longer term problem

In the longer term, Europe faces a more difficult dilemma as to cost of gas versus security of supply.  While there has been plenty of political rhetoric about striving for independence from Russian energy, Europe is facing the reality of declining domestic gas production.  Chart 2 shows the key sources of gas supply into European hubs.

Chart 2: Sources of gas supply into Western Europe

2012 Gas Flows

Source: Timera Energy

We have set out in more detail how these sources interact to drive hub prices.  UK and Dutch supply is now in rapid decline, which could become more pronounced if seismic activity linked to gas production increases in the Netherlands.  Norwegian supply has plateaued and is unlikely to offer significant incremental growth potential (as is North African supply).  European shale gas production is also unlikely to make a substantial impact until well into next decade.

This leaves Russian pipeline gas and LNG imports as Europe’s two main alternatives for meeting incremental demand growth over the next decade.  LNG imports offer supply diversification benefits, with regas terminals providing an important security of supply insurance role.  But the cost issues with LNG imports are similar in the long term to those described above in the short term.   Meeting incremental demand growth via LNG imports means Europe needs to compete with Asia for supply.

With LNG the only credible large scale alternative, Russia is well placed to meet incremental European demand.  Estimates of uncontracted Russian production that could be sold into Europe range from 60-100 bcma.  Russia has both the capacity and willingness to sell additional gas into Europe, as long as it does not undermine the oil-indexed pricing terms of existing supply contracts.  So although it may be an increasingly uncomfortable relationship, Europe is set to remain dependent on Russian gas (and Russia on European payment) for the foreseeable future.

LNG portfolio implications of a tight vs oversupplied market

Until recently there has been a strong market consensus that LNG market tightness will continue well through this decade. But the recent Russia-China pipeline deal and plunging Asian LNG spot prices (shown in Chart 1 below) have shaken that consensus. The LNG industry is becoming increasingly concerned over the possibility of a transition towards a state of oversupply as the decade progresses.

The potential for LNG oversupply has been a theme of this blog over the last 12 months. In a recent article we set out the factors that could drive a transition from tightness to oversupply. We now consider the implications of a tight versus oversupplied market on LNG portfolio value.

 Chart 1: Recent Asian LNG spot price slump

Asian Spot LNG updated

Source: Reuters

A tight versus oversupplied LNG market

Tight market continues

If the post-Fukushima tightness continues the LNG market will continue to favour sellers, with incremental volumes of new supply (e.g. from Australia and the US) absorbed without a major pricing impact. Premium markets (e.g. in Asia and South America) will continue to attract flexible supply with higher prices. However, the flexible nature of US export supply contracts should act to some extent to dampen global LNG spot price differentials and spot volatility.

In this outcome, the long run marginal costs of incremental supply (e.g. from Australia, Canada, the US and East-Africa) are likely to drive longer term supply contract pricing. Producers are also likely to be in a position to ensure oil-indexation remains dominant. But flexible US export supply contracts will increase the influence of Henry Hub (HH) on LNG spot market price dynamics. The majority of US and divertible European supply will likely flow to Asia and South America, but spot market volatility should continue to ensure the ‘fallback’ utilisation of European regas terminals in times of low Asian spot prices (as it has over the last three summers).

Transition to oversupply

If an oversupply situation develops, the LNG market will instead shift to favour gas buyers. Surplus gas will flow into the LNG spot market, increasing liquidity & the influence of both European and US hub price signals. US exports will likely have a disproportionate influence on spot prices given their flexibility and the fact that utilisation of US LNG with a Henry Hub cost base will be driven by netback spot price signals.

This outcome is much more supportive of a transition to hub indexation for new long term LNG supply contracts. Henry Hub and NBP are the obvious candidates, but an Asian spot hub may develop also, although it is likely this would be strongly influenced by the HH/NBP Atlantic price signal. US export and European supply contract flexibility will likely have a more significant impact in driving global LNG spot price convergence & dampening volatility. Global price convergence should support an increased flow of gas back into Europe and the higher utilisation of European regas terminals. This may cause significant downward pressure on European hub prices and spark another round of long term supply contract renegotiations.

Contract and portfolio implications

Recognising uncertainty

In our view the first factor to accept is the reality of uncertainty around the evolution of the LNG market balance and future pricing dynamics. This is an inevitable bi-product of the rapid growth & relative immaturity of the LNG market (e.g. compared to the oil market).

‘Betting’ on market outcomes is a risky business. So commercial or investment decisions that depend heavily on market balance or pricing dynamics should be made with a clear recognition (& pricing) of the risk involved. Several factors could drive structural changes to market dynamics e.g. weaker Chinese LNG demand or supply contract hub price penetration.

Current market expectations reflect the post-Fukushima period of market tightness, price divergence and volatility. The LNG market may transition to a very different state by the end of the decade.

Supply contract pricing

Supply contract terms (e.g. price levels and indexation) will be driven by the balance of power between sellers & buyers. Contract hub price linkage is set to increase, with US exports an important driver, particularly if oversupply develops. We addressed some of the potential outcomes with Asian supply contract pricing in our last article.

An important theme in the negotiation of supply contracts is ensuring contract structures that reflect uncertainty over market evolution, and apportion value and risk appropriately. This may incorporate the sharing of value upside (e.g. from diversion flexibility). It may also include the sharing of downside risk exposure (e.g. oil vs gas hub price risk).

LNG influence on European hubs

The link between LNG spot prices and European hub prices has been convincingly demonstrated over the last three months. Weakness in Asian spot prices (currently trading close to 12 $/MMBtu) has seen a substantial increase in LNG flowing back into European hubs as a liquid alternative. This could happen on a much larger scale if Asian spot prices remained weak for a more prolonged period as a result of a period of global oversupply. The increase in European supply contract flexibility that has been negotiated post Fukushima has resulted in a larger volume of divertable LNG supply that can return to Europe if prices in premium markets weaken.

Europe is unlikely to have a structural requirement for large volumes of new LNG this decade (given pipeline supply options). However, LNG supply contracts may still play an important role in meeting the incremental requirements of larger European gas portfolio players (even if the LNG flows elsewhere). An increase in the volume of flexible US exports as the decade progresses should strengthen the Henry Hub vs NBP relationship over time, even if US gas predominantly flows to Asia.

Case study: European regas terminal implications

The table below illustrates some of the challenges faced by European regas terminal operators, given that the approach to monetising regas terminal value and developing/selling new capacity differs in a tight vs oversupplied market.

Terminal challenges

Tight market continues

Transition to oversupply

Regas utilisation

High Asian spot price levels & volatility. European supply diverted. Continuation of reloads when Asian LNG spot prices are high and ‘fallback’ spot cargo flow into Europe when they are low.

Asian prices reconnect with Europe causing a fall in diversions. Lower spot volatility but an increase in spot trading & cargo flow. Higher European terminal utilisation but decreased cases of reloads.

Regas capacity pricing

Key → extracting value from ‘fallback’ flow + security of supply benefits. Tariffs need to reflect short term nature of spot cargo flow.

Increase in regas capacity value given higher utilisation. Greater interest in long term capacity access. Short term access also key with increase in spot trading.

Existing terminal monetisation

Important to reduce logistical barriers (e.g. scheduling, port/storage access) to maximise capacity value from short term opportunities.

Reducing logistical barriers also important with higher spot liquidity. Profiling of capacity sales to reflect potential increase in capacity value.

Capacity expansion / new terminal development

Opportunistic development driven by reloads, new markets & security of supply (e.g. Baltic, Med).

Higher terminal utilisation may support NW European terminal expansion. Terminal development in new Med/Baltic markets supported by cheaper LNG.

LNG portfolio value impact

Producers face the greatest risk from the transition to an oversupply scenario. Falling prices would clearly threaten the viability of many uncontracted new liquefaction projects. This is particularly an issue in countries where project costs are increasing rapidly (e.g. Australia and Canada). If an oversupply situation does develop, it is the cancellation or delay of new projects that will likely act over time to alleviate the LNG surplus.

Suppliers stand to gain from falling prices in the sense that they may be able to contract new supply on more favourable terms. However, continued concern from some Asian buyers at being exposed to spot prices in tight periods may limit the pressure they apply in negotiations over new supply.  There are some key risk considerations around price exposures on existing LNG supply contracts. European suppliers are familiar with the pain that lower spot prices can inflict on legacy contract positions, given the linkage between spot prices and retail pricing. There are some prudent contract and portfolio structuring measures that can be taken now to manage the risks posed by spot price declines.

There is also an important risk for both producers and suppliers that an oversupply scenario reduces global price spreads and volatility, eroding LNG supply flexibility value. The (re)negotiation of supply contract flexibility value has been a key industry focus post-Fukushima, with market players placing a hefty value premium on access to flexibility.

A view on the risk of an oversupply outcome is an important factor driving commercial strategy in negotiating supply contracts. For example, a view on market outcome is important in:

  • Valuing the flexibility implicit in a supply contract pricing structure
  • Choosing whether to pay for flexibility with cash versus other contract concessions
  • Deciding whether portfolio focus is on ‘buying’ new flexibility versus monetising existing flexibility
  • Timing the purchase or sale of incremental portfolio flexibility

An oversupply scenario may be relatively short lived, or it may not eventuate at all. But the risk around a transition to an oversupplied LNG market is increasing. Now is a good time to take some defensive measures, in case that risk becomes a reality. And defence need not be the only focus. As market uncertainty increases, there are likely to be attractive opportunities to create portfolio value via exploiting differences in company expectations of future outcomes.

Interconnectors – a competitive source of new capacity for the UK power market

The UK Capacity Market is currently being implemented to ensure new flexible capacity is built as older plants retire.  While generation investors are focused on trying to assess the relative benefits of CCGT vs OCGT capacity, new interconnector capacity is quietly looming as an increasingly competitive alternative.

Interconnectors have been excluded by the UK government from participating in the first auction later this year.  But the government has firmly signalled its intention to include interconnector capacity in the 2015 auction.  In addition to Capacity Market support, Ofgem is paving the way for additional regulatory support in the form of a cap and floor mechanism for interconnector revenues.  With a substantial positive power price differential from Continental markets to the UK, interconnector investment projects are an increasingly attractive proposition.

The cost angle

Capex cost is a good place to start when comparing interconnector capacity with power plant alternatives.  The cost of interconnector capacity tends to be a function of the distance of the link and the engineering challenges in laying the cable.

The BritNed line (UK to NL), commissioned in 2011, provides a reasonable benchmark for the capital costs of laying shorter interconnectors across the English Channel.  BritNed cost roughly £500m for 1GW of capacity, or 500 £/kW on a normalised basis.  This broadly compares to the ‘all in’ cost estimates for the proposed Belgium to UK project (NEMO) and a new UK to FR interconnector.

Costs can vary around this 500 £/kW benchmark depending on project characterstics.  The 1GW Eleclink project (being developed by Eurotunnel and Star Capital) is likely to be significantly cheaper, given it involves laying cable through the existing Channel Tunnel.  The proposed 1.4GW NSN link between Norway and Scotland on the other hand is over a much greater distance with costs closer to 1000 £/kW.

But if we assume 500 £/kW as a reasonable cost benchmark for short interconnection projects, then this is a similar level to new build OCGT capex, and compares favourably to CCGT new build at around 700 £/kW (all in).  But cost competitiveness is only part of the picture.  Wholesale energy revenue dynamics also play an important role.

The energy margin angle

There are some parallels between the market exposures of interconnectors and gas-fired power plants in that they can be characterised as strips of spread options.  Interconnector value is driven by locational price spreads.  Whereas gas plant value is driven by gas vs. power price  cross-commodity spreads.

For shorter interconnection projects (to FR/NL/BE), the key driver of revenue is the spread between Continental power prices (predominantly set by coal prices) and UK power prices (predominantly set by gas prices).  The locational forward market price spreads between the Continent and the UK are currently substantial, rising above 20 £/MWh from 2016 as illustrated in Chart 1 below.

Chart 1: Baseload calendar price spreads between Netherlands and UK

UK-NL Power Spreads

Source: Timera Energy

The revenue dynamics for the Norwegian interconnector are even more attractive given Norwegian power prices typically trade at a substantial discount to the UK (in normal and wet hydro conditions).

But as with CCGT investment projects, somebody needs to bear the asset’s market risk exposure (i.e. the fluctuations in locational price spread levels).  This is where regulatory support will play a key role.

Policy support mechanisms

There are two main sources of potential regulatory support for UK interconnector developers:

  1. Inclusion of interconnectors in the UK Capacity Market (targeted by DECC for 2015)
  2. A cap and floor regime being designed by Ofgem to limit developers exposure to market risk

The cap and floor mechanism is a hybrid policy support mechanism based on a combination of the UK’s merchant interconnector model and the regulated asset model used on the Continent.  It is being designed to support the UK – Belgium NEMO interconnector project.  But Ofgem’s intention is to extend this template to support other interconnector projects.  Under the design, if revenues rise above a pre-determined cap level they are returned to consumers.  While if revenues fall below a floor level the asset owner is supported by consumers (via network charges).  Ofgem has proposed that the cap and floor levels are fixed ex-ante and escalated for inflation.

Inclusion of interconnectors in the Capacity Market would allow access to an additional capacity revenue stream, potentially under 15 year fixed price capacity agreements.  But the key regulatory issue that remains unresolved is how interconnector capacity will be de-rated for availability, given dispatch is not directly controllable.  That is a challenge for DECC to overcome before including interconnector projects in the 2015 capacity auction.

Investment dynamics

A combination of the factors outlined above mean that interconnector capacity may be in a strong position to displace new CCGT build:

  1. A number of shorter projects look to be cheaper on a straight capex basis
  2. There is likely to be a significant boost in policy support over the coming year
  3. The widening  spread between gas and coal prices (which is causing so much pain to CCGT owners) is working in favour of interconnector projects, as locational power price spreads between the Continent and the UK increase accordingly

The last of these three factors means that interconnector capacity is actually an attractive diversification option for owners of gas plant portfolios.

The last factor which plays in favour of interconnectors is access to finance.  Unlike gas-fired power plants running at low load factor, the risk profile of interconnector investments is much more consistent with that of traditional infrastructure and pension fund capital.  This is particularly the case with a cap & floor revenue support structure and the ability for asset owners to sell multi-year capacity contracts to reduce market risk.  It is our view that interconnectors can play a central role in providing the incremental flexible capacity that the UK requires into next decade.

Russia – China deal to shake up global gas market

The Chinese have driven a hard bargain in closing a 38 bcma supply deal that is priced on a similar basis to Russia’s existing European supply contracts.  But in return, Russia has secured a central role in supplying the Asian gas market over the next decade.  Russia has also thrown down the gauntlet to LNG exporters courting China.

The Russia – China deal and the associated Power of Siberia pipeline should facilitate both:

  1. Future incremental sales of pipeline gas to China, both from Gazprom and potentially other Russian producers.
  2. The future export of Siberian gas from east coast Russian LNG terminals, on the doorstep of Asia’s largest buyers, Japan & Korea.

These factors present a substantial competitive threat to as-yet-uncontracted LNG producers in Australia, Canada and Africa, particularly given the higher combined production & shipping cost base of these exporters.  The impact of the Russian deal in displacing Chinese LNG demand also increases the likelihood of the LNG oversupply scenario that we set out last month.  As Russian gas starts to flow east later this decade, the Chinese border price could become an important benchmark in driving Asian gas pricing.  China however may have other ideas.

Deal summary

Deal volume & infrastructure

An initial agreement has been reached on 38bcma of gas, which will flow from Russia’s Eastern Siberian gas fields down a new ‘Power of Siberia’ pipeline into gas hungry North Eastern China.  The pipeline within Russia is then planned to continue onto Vladivostok to support future Russian LNG exports.  The route is shown in Chart 1 below:

Chart 1: Route of new gas from Russia into China

Russia gas map

Source: Gazprom

The planned pipeline infrastructure may support up to 60 bcma over time.  Wood Mackenzie estimates 125 bcma of gas demand in northern China by 2025, illustrating the growth potential through this and other pipelines.

The deal also opens up east coast Russian LNG exports.  Volumes from the Kovyktinskoye and the Chayanda field could also supply gas to Gazprom’s proposed Vladivostok LNG project.  And the pipeline also facilitates exports from other Russian producers.

But it is early days and there are large capex hurdles to be overcome before gas flow becomes a reality.  The overall cost for the Kovyktinskoye and Chayandinskoye upstream development, Power of Siberia pipeline and processing costs could exceed $40 billion according to Woodmac.

Deal price

A range of analyst views on deal pricing have been circulating over the last two weeks.  The headline reported deal price was somewhere between 350-380 $/tcm, equivalent to 9.5 to 10.4 $/MMBtu.  But some analysts are estimating slightly higher contract prices by the time the gas flows in 2019 (up to around 11 $/MMBtu).  The deal is oil-indexed and full pricing details have not been revealed, so all estimates are subject to uncertainty.   There are also other factors in play that impact deal value e.g. the Russian vs Chinese share of pipe capex and upstream development costs.

But what is important is that the deal price, at somewhere around 10 $/MMBtu, is comparable to current German border prices for oil-indexed Russian contracts (after the various concessions granted to pricing formulae in recent years).  This appears to be marginally cheaper than estimates of Turkmen gas at the Chinese border (11.00-11.50 $/MMBtu).  And importantly, it is well south of recently signed Asian LNG contracts which are closer to 16 $/MMBTu at current oil prices.

The politics

Russia looks to have accepted price concessions to get the deal done at a time when Europe & the US are expressing concerns around security of supply from dependence on Russian energy exports.  It is no coincidence that the deal has been struck in the midst of the political jousting around Ukrainian sovereignty.

But the Russians have exaggerated the level of competition for Russian gas.   Gazprom CEO Alexei recently has stated that “Europe has lost the competition global for LNG, and in a single day it has just lost the competition for the world’s pipeline gas as well”.  Talk like this makes impressive headlines back in Russia, but Russian exports are not a question of ‘either/or’ to Europe vs China.  The gas for the Chinese deal is currently ‘stranded’ in east Siberia with no infrastructure linking it to the West Siberian producing province (which supplies Europe and which has some 100 bcma of excess production capacity).  If there was really such a squeeze on Russian gas, China would not have been able to beat the deal price down to the extent that it has managed.

The deal is important to China but Russia is only one of a diversified mix of supply sources for the Chinese including:

  • Domestic production – China has a substantial unconventional gas resources with the government targeting 80 bcma of shale gas production by 2020 (although realistically by 2020 production will likely fall well short of this).
  • Turkmenistan, Uzbekistan & Kazakhstan pipeline gas – China is currently importing around 20 bcma a number that could triple by the start of next decade, and with potential to increase further if pipeline capacity can be expanded, given Turkmenistan’s massive reserves.
  • LNG – China imported about 25 bcm in 2013 but is rapidly developing more regas capacity and is an investor in a number of upstream and liquefaction projects, both under construction and planned (e.g. in Australia, East Africa and Canada).

Nevertheless, it is reasonable to expect that the pricing of Russian pipeline gas may take on a very important role in influencing pricing in the evolving Asian gas market.

The importance of pricing

The new Russia-China deal at around 10 $/MMBtu (given current oil pricing) suggests Russia is at least initially willing to sell gas at the Chinese border at a similar price level to that of its European supply contracts.  But the deal also facilitates development of Russian East coast LNG sales.  For Russia this deal is a strategic enabler which allows them to:

  • Increase future pipeline supply from East Siberian fields to China, at (what Russia hopes would be) higher price levels
  • Export LNG to other Asian buyers via east coast terminals on ‘traditional’ oil indexed terms
  • Potentially pave the way for the previously tabled Altai pipeline route to transport West Siberian gas into North West China – thus eventually monetising the 100 bcma or so of ‘surplus’ Russian production capacity

The recent Russia-China pipeline deal (which took 10 years to come to fruition) has clearly improved Russia’s current strategic positioning vis a vis the Asian market.  However future developments in the wider supply arena and China’s future strategic positioning may frustrate some of Russia’s aims in this regard.

Firstly, the monetisation of 38 bcma of otherwise ‘stranded’ East Siberian gas represents a reduction in Asian LNG demand of 38 bcma of LNG (all other things being equal) and hence this volume will be available to challenge Russia’s pipeline gas market share in Europe.

Secondly, a mild European and Asian winter has seen European hub prices and Asian spot LNG fall sharply.  And despite the outlook of a slow restart of Japanese nuclear plants, new supply is on the way with the PNG LNG project soon to start up and the first of many new Australian LNG projects coming onstream next year.  As a result, sentiment is moving towards the ‘oversupply’ scenario that we set out in a recent article.

The Third factor is the degree of future success China has in creating supply options and competition, despite the likely continued rapid growth of its natural gas demand.  In addition to further Russian pipeline supplies (from East and West Siberia) these include upside in Central Asian pipeline imports, shale gas development if successful, LNG projects with Chinese interests and future spot and contracted LNG supplies.

While Russia may be hoping that the pricing of volumes of Russian pipeline gas into China may become an important new Asian price benchmark, it is not clear that this suits China’s future requirements.  China’s aims might be better served by maximising its own domestic production and creating competition between different pipeline gas supplies and LNG imports.  It is quite possible that at some point in the next 5 to 10 years, China declares that all imports into the country be priced on a netback basis from its Shanghai hub, regardless of the aspirations of suppliers.  Such a move is more likely to succeed in a well-supplied LNG market.  The recent Russia – China 38 bcma pipeline deal ironically makes such an eventuality more achievable.

This week’s article included input from Howard Rogers, a Senior Advisor with Timera Energy and Director of Natural Gas Research at the Oxford Institute for Energy Studies.

Centrica asset sales & the current market environment

Earlier this month Centrica announced a major shift in its generation portfolio strategy.  Centrica intends to sell all of its larger CCGT assets and re-focus on smaller peaking plant.  A strategic shift of this scale from a well respected management team will no doubt fuel boardroom discussions across other European utilities.  Weak CCGT returns are source of widespread pain.

Centrica has justified the move based on the declining benefit of CCGTs as a hedge in its vertically integrated portfolio.  Management has made no secret of the fact that it is structurally bullish gas prices.  This is reflected in its major upstream investment program, where it presumably intends to re-invest some of the capital released from CCGT sales.  Like many other utilities, Centrica is also pessimistic about the future recovery of gas plant margins.  So the announcement of a downsizing of its exposure to gas plant is not a major surprise.

However the timing of the CCGT sales is interesting, given what are currently very depressed forward market conditions after a mild and windy winter.  In this article we take a look at Centrica’s asset sales and the forward market dynamics that will have an important impact on what prospective buyers may pay for the assets.

Centrica sale background

Centrica intends to sell 2.7GW of larger CCGT assets, the Langage, Humber and Killinghome plants with a combined book value £500m.  It intends to re-focus on its smaller gas plants which are currently running in OCGT mode under STOR (Short Term Operating Reserve) contracts with National Grid.

However investment in these smaller assets is likely to be predicated on receiving adequate remuneration from the new Capacity Market (e.g. to cover plant refurbishment/upgrades).  Otherwise Centrica has indicated that it will close these plants.  The Centrica gas plant portfolio is summarised in Chart 1 below.

Chart 1: Centrica gas-fired generation assets

centrica plant

Centrica’s strategic shift from CCGT to OCGT plants reflects the changing structure of the UK power market with the introduction of capacity payments.  A shift towards remuneration for capacity vs energy favours smaller scale peaking assets as we described in an article back in April.

CCGT margins may currently be very weak, but the 3 CCGT’s for sale represent an interesting mini generation portfolio with diversification across plant age, efficiency and cost structure.  Value is focused on the newer Langage plant (commissioned in 2010).  The other two plants are lower efficiency ‘dash for gas’ CCGTs from the 1990s, but assets which may offer interesting investment and Capacity Market options.

Given the current weak spread environment and negative sentiment around gas plant, Centrica’s CCGT capacity is likely to price cheaply.  What is unclear is whether Centrica will be willing to sell at these prices.

Current forward market environment

Summer NBP gas prices have fallen by almost 30% (20 p/th) since the start of this year.  We set out the drivers behind this price slump last week.  While this fall in gas costs has slightly improved CCGT margins over the coming summer, this has been outweighed by a significant decline in forward power prices across the curve.  The decline has been particularly pronounced in winter peak prices, in part reflecting the impact on expectations of the mild and windy winter that the UK has just experienced.

Chart 2 shows a comparison of current forward sparkspreads vs those three months ago in February (at a market average 49.5% gas plant efficiency).

Chart 2: UK forward indicative Clean Spark Spreads (Feb vs May)

fwd spreads

A comparison of these charts shows that the gas price fall has done little to help CCGT owners.  In fact indicative pricing further out on the curve (2017-18) shows spreads contracting significantly.  We are wary of reading too much into these later year spreads given that liquidity is currently very poor.  But it appears that any forward market expectations of CCGTs starting to displace coal in 2017-18 have disappeared with the government’s March budget announcement of a freeze in carbon price support.

Although the fall in gas prices has improved CCGT competitiveness vs coal plant, a clear gap remains.  Newer CCGTs (52% efficiency HHV) are still about 3 £/MWh more expensive on a Short Run Marginal Cost (SRMC) basis than large older coal stations (36% efficiency) over the coming summer, as shown in Chart 3.  That gap is equivalent to gas prices falling another 5p/th, coal prices rising 13 $/t or carbon rising 7 €/t.  The CCGT vs coal plant SRMC gap blows out to around 8 £/MWh over the winter given higher seasonal gas prices.

 Chart 3: CCGT (52%) vs coal plant (36%) SRMC competitiveness (June 14)

gas vs coal

With peak power prices and forward spark spreads weakening and a clear competitive advantage to coal plant, this is a tough environment in which to sell CCGT assets.

But… the Centrica assets may still make a smart acquisition  

CCGT asset valuation has traditionally been focused around forecasting sparkspread margins.  This is at best a risky exercise, given changing power market dynamics such as low carbon support, intermittency and capacity payments.  And history has not smiled on bets based on bullish sparkspread forecasts.

But the value drivers for UK CCGT assets are evolving.  Asset margin is now better deconstructed across three categories:

  1. Capacity margin (payments under the new Capacity Market)
  2. Energy margin (sparkspread margin in the wholesale energy market)
  3. Reserve margin (Balancing Mechanism and ancillaries revenue)

Getting comfortable with bounds on capacity pricing is of key importance to valuing CCGT assets, particularly older assets.  If the Capacity Market is to prevent a security of supply crunch it will need to support older CCGTs to remain on the system by remunerating plant fixed costs.  When new incremental capacity is required, capacity market returns may rise significantly above fixed costs.  Capacity payments do not start until 2018, but payments represent a step change in CCGT margins and there will be visibility on capacity pricing when auctions commence later this year.

CCGT energy margin exposure has also evolved with falling spark spreads.  A CCGT asset is best characterised as a strip of options on the underlying spark spread.  Plant fixed costs represent the cost of carry on these options.  Under current market conditions, the return on these options is below the cost of carry for many assets (i.e. plants are making cash losses).  But if the capacity market supports CCGT fixed costs then plant value dynamics change.  What is important in valuing assets is capturing a realistic view of the flexibility (or extrinsic) value that can be monetised from plant optionality, both in the energy market and the Balancing Mechanism.  This is a very different exercise from forecasting sparkspread scenarios (more details on CCGT extrinsic value here).

Reserve margin has traditionally been icing on the cake.  But it will play an increasingly important role in determining asset values as the UK market evolves.  Ofgem’s reform of the Balancing Mechanism is set to drive much sharper price signals for flexible plant and Grid’s reserve payment budget will only rise over time with increased system intermittency.

In our view, the investment case for UK CCGT assets is not materially impacted by the recent weakness in forward market spreads.  There is still a solid investment case that can be built around a recovery in UK CCGT asset values over a 5 year horizon. But this depends on getting the right asset(s) at the right price and defining an effective asset monetisation strategy.  Centrica’s willingness to part with its CCGT assets at low prices is not yet clear.  But these assets sales may represent an attractive acquisition in what is currently a very depressed forward market.


A spring slump in spot gas prices

It is ironic that the growing threat of Russian supply cuts has conincided with a sharp decline in European gas hub prices.  Prompt UK NBP prices have fallen more than 20 p/th since the start of the year.  TTF & NCG prices by more than 8 €/MWh.

This price slump is more than a seasonal decline as winter turns to spring.  It reflects a North West European gas market that is substantially oversupplied into the summer.  But what are the drivers behind price falls and are they structural or temporary?

Oversupply in Europe

It has been a mild winter followed by a mild spring across Europe, with gas demand well below average.  As a result storage levels have remained relatively high coming out of winter.  UK storage for example is currently around 65% full vs around 20% this time last year.  Despite lower demand levels, pipeline flows into Europe have held up well, e.g. robust flows from Norwegian fields.  On top of this, significant volumes of Qatari LNG have started to flow back into Europe over the spring.

The resulting decline in gas prices is illustrated in Chart 1 by the green line (spot NBP prices).  It can be seen that as spring has progressed, hub prices have diverged from oil-indexed contract prices (the dark blue line) and moved sharply lower.  It is no coincidence that on the other side of the world Asian spot LNG prices have also plummeted (the red dotted line).  But we come back to that relationship shortly.

Chart 1: Global gas price benchmarks

gas price chart

Source: Timera Energy

Last year we set out a framework for understanding European gas hub pricing dynamics.  This focuses on understanding the behaviour of the key tranches of flexible (price responsive) supply into European hubs.  Applying the framework to the current market conditions provides a good insight into the behaviour of hub prices.

In describing the framework we set out why hub prices typically trade within a loose band around oil-indexed contract price levels:

Of the flexible sources of supply, pipeline contract swing is of principle importance. Russian and Norwegian oil-indexed contracts are particularly important as a provider of swing flex into Germany. Utilisation of this swing flexibility tends to anchor European hub prices within a band around oil-indexed contract price levels. 

This price band is somewhat flexible, but it is also resistant. It can be stretched by prevailing supply and demand dynamics, but the further prices deviate from oil-indexed benchmarks (e.g. the German border price), the stronger is the force acting to pull prices back. As hub prices fall below oil-indexed contract prices, contract owners utilise swing to pull back on contract volumes which supports hub prices. As hub prices rise above oil-indexed levels, swing gas flows increase acting as price resistance.  A similar logic applies to gas storage.

As prices fall, reduction of swing contract volume take and buying of gas to inject into storage facilities, act to support hub prices.  But this impact has limitations, e.g. storage injection will start to dry up as facilities fill by June/July.  The current disconnect between hub and oil-indexed prices indicates that stronger forces are at work driving prices below the oil-indexed price band.  This is where global LNG dynamics are playing a key role.

Europe as LNG balancing market:

Since Fukushima, flexible LNG volumes (e.g. uncontracted production & divertible supply contracts) have mostly flowed to premium markets in Asia and South America.  European hub prices are a less attractive alternative for LNG that can be sold at higher prices elsewhere.  But the LNG spot market is relatively illiquid and when prices are soft, Europe plays an important balancing role in soaking up excess supply.  This is particularly the case in spring periods given seasonal weakness in Asian LNG demand.

Qatar as the world’s largest exporter of LNG plays a key role in determining flows to Europe.  The Qataris have significant volumes of relatively inflexible uncontracted production that needs to find a market.  Most of this LNG flows to Asia.  But when Asian spot prices are weak and liquidity is poor, additional volumes can act to drive prices even lower.  It is not in the Qatari’s strategic interest to drive a slump in spot prices in their primary market.  So surplus LNG is typically sold into Europe, hence the volume pickup in gas imports to the South Hook terminal in the UK over the last couple of months.

European hub prices (particularly NBP) offer a relatively liquid option for selling surplus cargoes and there is easy access to regas capacity.  So the current weakness in Asian spot prices is compounding weakness in European hub prices.  While most of the LNG is being imported into the UK, the impact is quickly transmitted to the Continental hubs (e.g. TTF, NCG).  The IUK interconnector has been flowing strongly to Belgium (with NBP at discount to TTF) and Norwegian flows also act to balance hub differentials.  But perhaps the most important question is what happens next?

Some factors to watch

This year’s spring decline in spot LNG prices is not unusual.  A similar decline was seen in 2012 and 2013 (see Chart 1).  Asian demand has historically recovered to support prices over the summer period (e.g. to hedge air-conditioning load and the start of preparations for winter).  That will be a key factor to watch this year.

The much anticipated Russian supply cuts for gas via Ukraine are also likely to have an effect from June.  We come back to the impact of these in an article to follow shortly.  But Russian cuts should provide price support also (albeit well priced into the forward market).

But a couple of factors that normally provide support at low price levels, are unlikely to help this year.  High storage levels will reduce injection demand this summer (caveat the impact of Russian cuts).  And gas-fired power plants, which typically increase output as gas prices fall, are currently so far out of merit (vs coal plant) that power sector gas demand will provide little support.

As a result, the timing and volume of spot LNG flows into Europe may be very important in determining the extent and duration of the European hub price slump.  The structural Asian price premium over Europe is likely to return into next winter.  But in the meantime the hub price slump may have further to run.  These dynamics are an interesting preview of what will be a much more dynamic global gas market once flexible US LNG exports start to flow later this decade.

Considering an alternative view on global LNG pricing

A market consensus view has developed that the global LNG market will remain tight for the rest of this decade.  The thesis runs that LNG buyers are nervous about being caught short supply as gas import demand from developing economies surges.  The post-Fukushima squeeze is fresh in mind.  Producers are also projecting a tight market to support their investment cases, given the tens of billions of dollars flowing into new liquefaction capacity.  While this consensus is currently supported by a range of buyers and producers, it is increasingly coming under challenge.

The tight market consensus has developed with some justification. Since the Fukushima disaster and the end of the most recent liquefaction growth ramp in 2011, new supply has struggled to keep up with demand growth. This has driven a structural premium of Asian spot LNG prices over European prices as shown in Chart 1.

Chart 1: Global gas price evolution gas price chart

Source: Timera Energy

It is not difficult to build a compelling case for market tightness to continue as new production is absorbed by aggressive demand growth across Asia, the Middle East and South America.  However a number of key factors driving the global LNG supply and demand balance remain uncertain. In our view that uncertainty warrants the consideration of alternative outcomes.

An uncertain future

Complexity and uncertainty around the global supply and demand balance increases significantly from 2015. Most forecasts of the LNG market balance show a steady growth in demand met by an equally steady increase in supply (see Chart 2 below where BG has overlaid a number of consultant demand forecasts on its estimates of supply growth).  But the actual outcome, whatever form it takes, may not follow such a smooth path.

Chart 2: Demand and supply growth projections

LNG demand forecast BG

Source: BG

On the supply side, large and lumpy volumes of new liquefaction capacity are being developed.  As these projects approach FID, much of the gas will have been signed under long term contract.  But many of these supply contracts are with portfolio players rather than the gas being assigned to dedicated demand sources.

In simplistic terms the development of new liquefaction capacity can be viewed as a response to recent ‘price signals’ from the Asian markets.  But it can also be seen as a consequence of:

  • the monetisation of Australian projects – both under construction and planned
  • the recent ‘surprise’ discovery of a new large gas basin offshore East Africa looking for market
  • a push by Russian players to access the Asian LNG market
  • the much publicised prospective wave of US LNG projects
  • Western Canadian projects also seeking to enter the LNG supply business.

History illustrates the timing risks associated with large new liquefaction projects.  New capacity has consistently faced delays given the cost and complexity of project execution.  This is rightly presented as an argument in support of tighter market conditions.  But it can also result in large volumes of gas coming to market at a similar time (i.e. divergence of actual vs forecast delivery profile).  These volumes can place downward pressure on spot prices even if only on a temporary basis.

There is also the potential for a major new ‘wave’ of supply in the 2018 to 2023 time window (encouraged by the current tight market price levels).  There is clearly significant uncertainty around the magnitude and timing of this new supply.  But once projects are committed, it can be difficult for the industry to respond to developments in market dynamics, given the lengthy (~4 year) liquefaction construction period.

On the demand side, Japan has recently announced its decision to re-start its fleet of nuclear power plant, although the extent and timing of the resulting LNG demand displacement is unclear.  But the elephant in the room is non-Japanese Asian demand.  The strong LNG demand growth projections (shown in Chart 2) are heavily dependent on growth in Chinese and Indian demand.

However uncertainty over the size and impact of a more sustained slowdown in Asian economic growth remains.  China epitomises this problem.  Between recent IEA and Chinese forecasts the uncertainty for 2020 gas demand ranges from 330 to 400 bcma.  The domestic supply situation is unclear and partially driven by views of future shale gas success. The possible use of upside to 65 bcma  in Turkmenistan and Central Asian pipeline imports is perhaps eclipsed in uncertainty level by the ‘Schrödinger’s Cat’ of the deal for Eastern Siberian gas, reported as a 38 bcma deal but with the potential for higher volumes over time .  If China’s LNG imports are the ‘residual’ balancing item in the global market then they reflect a highly uncertain future.

The tight market view

There can be no doubt that the LNG market is currently tight.  There has been little in the way of new liquefaction capacity since 2011 and there have been significant feedgas issues into some existing terminals (e.g. Algeria, Eygpt and others).  This has contributed to the spot price volatility that can be seen since 2011 in Chart 1, although it should be recognised that this volatility is in part driven by the relatively small number of price-disclosed spot sales.  Over the same period Asian demand growth has remained robust (albeit with seasonal variations) and incremental demand has largely been satisfied via the diversion and reloading of European cargoes.  These dynamics are illustrated in Chart 3.

Chart 3: Recent evolution of global LNG market balance

tight mid decade

Source: BG

If Asian LNG demand growth continues to outstrip its dedicated supply for the rest of the decade, European LNG supply will likely retain its current global balancing role.  In other words significant spot price premiums over European hub prices will attract cargoes away from Europe, to be replaced as necessary by ‘back-filling’ Russian pipeline supplies.  Spot price volatility will likely remain, as the marginal drivers of LNG arbitrage dynamics change over time e.g. due to seasonal factors and timing of new supply.  So there may be temporary increases in cargo flows to Europe as the global balancing market in times of lower Asian spot prices (with Russian pipeline supplies to Europe providing the buffering mechanism).

Under these conditions of market tightness, oil-indexed contract pricing is more likely to remain dominant, albeit accepted with extreme reluctance by Asian buyers.  The LRMC of new projects in Australia, Canada and East Africa will be an important benchmark when long term contracts are signed.  In other words it is likely to be a seller’s market where Australian and North American export volumes are absorbed without a structural impact on market and contract pricing.

In this world the majority of US exports will flow to Asia.  However the more flexible structure of US export contracts will likely increase the influence of Henry Hub on LNG spot market price dynamics.  US export projects represent the reconnection of the US to the rest of the global gas market and a Henry Hub/NBP driven ‘Atlantic Basin’ price signal is likely to increase over time.

However, underpinning this view of a long-term tight LNG market is the premise that ‘Economics 101 has failed’ in that suppliers, although each hopeful of supplying what they see as a premium market, collectively fail to execute projects to schedule and so in aggregate constrain supply.

A transition to oversupply

There are a number of factors that could derail the consensus view.  But perhaps the most obvious one is a failure of developing economy demand to materialise to the extent that has been forecast.  This could be for example due to an Asian economic downturn (major setbacks in emerging economies are common even if only temporary). Or it could be due to a combination of Japanese nuclear restarts and the displacement of large volumes of Chinese LNG demand by Russian pipeline imports or other supplies from the back end of this decade.  Howard Rogers explored some of the drivers of an Asian LNG demand induced oversupply situation in a previous article.

Whatever the potential causes, the result of an oversupply situation is likely to be the flow of surplus gas into the LNG spot market.  This will place pressure on global LNG prices to re-converge as they did in 2009-10. It would also tend to dampen LNG spot price volatility and could significantly reduce the value of LNG portfolio flexibility (which is currently at a premium).

LNG volumes ‘in excess’ of Asian requirement would find a home in Europe (as they did in 2010 and 2011) placing pressure on Russia to either reduce pipeline supplies to maintain hub prices at ‘target’ levels or alternatively engage in a price war to reduce US LNG exports.  Such dynamics, in addition to seasonal weather effects could increase price volatility albeit around lower LNG price levels.  This is unlikely to be a good outcome for LNG producers and large portfolio players and unsurprisingly some larger players are starting to downplay the risks around an oversupply scenario (perhaps a barometer for concern).

Such an oversupply scenario may be relatively short lived (e.g. the period over 2009-10) as a result of a temporary mismatch in new demand and supply.  But this could be enough to disrupt long term contract pricing dynamics and to shift the balance in favour of LNG buyers.  The 2009-10 period was an important driver of the development of hub prices in Europe.  A similar oversupply situation later this decade could be the catalyst for an increase in influence of hub pricing on Asian LNG supply.  It is interesting to note that anecdotal references to ‘hybrid pricing’ i.e. the inclusion of hub price as well as oil indexation, are starting to circulate in Asian LNG circles.

Commercial implications of the two alternative outcomes

In this article we have set out two views of LNG market evolution.  The current consensus view that market tightness continues until the end of this decade, and an alternative view that there is another period of global oversupply (either on a temporary or more structural basis).  The actual outcome may indeed differ from both of these.  But in our view the level of uncertainty around some of the key drivers of supply and demand warrants the consideration of a range of outcomes.

The value of considering alternative outcomes comes from a realisation that LNG asset and portfolio values may differ substantially depending on the evolution of the global market balance into the end of this decade.  Spot price dynamics, gas flows, the structure of supply contract pricing and the value of portfolio flexibility will all be strongly influenced by market outcome.  We take a more structured look at the commercial implications of a tight vs oversupplied market in an article to follow shortly.

This week’s article was co-authored by Howard Rogers, a Senior Advisor with Timera Energy and Director of Natural Gas Research at the Oxford Institute for Energy Studies.

Risk management of optionality in energy portfolios

This is the third in a series of articles on the principles of energy risk management, written by Nick Perry.

Energy portfolios are rich with physical optionality.  For example, options to take different volumes of delivery (e.g. supply contracts), options to convert one type of energy into another (e.g. gas into power) and options to store energy for later use (e.g. gas or hydro storage).  The market exposures and values of these options are typically complex.  But they are an inherent part of most energy portfolios.

Earlier in this series we have several times mentioned options in the context of energy risk.  In particular, we suggested that many aspects of risk management in energy are quite challenging enough even before confronting the additional complexities posed by options. But given their prevalence in most energy portfolios, the treatment of options is an important risk management issue.

The inevitability of options

As discussed last time, uncertainties abound in energy markets.  Price risk (exposure to variable prices), volumetric risk (exposure to uncertainty of the amounts of supply or demand to be managed) and basis risk (vulnerability to breakdown in correlations) are all abnormally pronounced, especially in gas and power.

At the same time, reliable physical performance of delivery obligations is commercially and societally critical: we do not tolerate the lights going out.  Energy portfolios must accordingly be designed to be resilient, and in general terms this means building in a great deal of flexibility, in order to be able to respond to a range of contingencies.

Under traditional monopoly models, when ‘risk management’ was not really a term of art, flexibility was conceived of largely in terms of substantial over-capacity in physical systems.  If one power plant trips, we have others in reserve at our command.  But when open markets become the norm, and companies no longer have the luxury of a captive customer base on which to foist the cost of large-scale redundancy, they must expand their understanding of flexibility to embrace commercial and financial tools.  In the language of traded markets, they need to incorporate options in the portfolio.

Of course, various forms of contractual optionality have long existed in energy portfolios alongside physical over-capacity: for example, ‘swing’ contracts for gas purchases and interruptible sales contracts all featured in monopoly suppliers’ repertoires.  Over time they learn to identify these as optionality, albeit as options ‘embedded’ in ‘physically settled’ contracts.  They further observe that in their supply portfolios they have sold a great deal of flexibility to end-users, which again translates into optionality – this time, a short option position, which is generally considered a higher risk exposure.  And they see a need to analyse these various “real options” as one would a purely ‘paper’ option contract.

Physical flexibility as an option

But this new way of describing and analysing old tools does not stop at contracts.  Through this lens, a flexible gas-fired power plant looks like a way of capturing a positive price-differential between gas and power at the relevant heat-rate (the spark spread), while retaining the ability to turn the plant down when the spark spread is negative.

Thus, capacity in a CCGT can be seen as a strip of call-options on the spark spread, yielding positive pay-offs when they are available, and (ideally) never incurring a negative marginal outcome.  The pay-off diagram (shown in Chart 1 below) has an additional dimension to that of the classic call-option on an equity: but it is clearly an option nonetheless.

Chart 1: Representing a gas plant as a spark spread option

Spark Spread Pay-off

The same reasoning can be applied to a very significant set of classic steel-and-concrete energy assets.  Oil refineries, transmission systems and storage facilities are all good examples.  ‘Call-options on spreads’ may not be how they were conceived of by the engineers who built them; but that is how risk managers and portfolio managers need to analyse them.

Complexities galore

One great advantage of this way of looking at energy portfolios is that the financial theorists have equipped us with ways of valuing options as assets, assessing the risks of holding them unhedged in the portfolio, and devising hedging strategies to protect their value.

That’s the good news.  The bad news is that many of these ‘real options’ are particularly difficult to model.

This is intrinsically bound up with the challenge of exercising these particular options optimally.  Option theory tends to start from a simple call option on an equity that can be exercised once only, at a particular point in time, in a market of complete transparency and liquidity.  Optimal exercise of the option is so straightforward, your broker will do it for you.

But consider the case of a coal-fired power plant that is ‘opted out’ under the European Large Combustion Plants Directive.  The owner would like to operate it as a call-option on the ‘clean dark spread’ and generate when and only when there is a positive spread.  This implies on-off actions at the start and end of periods in the day when a positive prevails.  But the output of a coal plant is constrained to ramp up and down relatively slowly, so that some periods of sub-optimal ‘exercise’ of the option are inevitable.

Complicating matters still further, the opted-out plant has only a finite number of running hours permitted.  The dark spread may be high right now: but perhaps it will be even higher in the months to come, and we may regret using finite running hours now rather than generating more profitably later.  Then again, running the plant more aggressively now may advance and/or lengthen the timing of a maintenance outage, when we would lose potentially more profitable generating opportunities.

Addressing the challenge

These problems are multi-dimensional and make our valuations, risk assessments and hedging strategies very challenging indeed.  Financial theory may give us a head-start, providing a framework for the analyses we would like to conduct, and a template for the strategies we would like to deploy.  But at the trickier end of the spectrum we will rapidly encounter severe difficulties, from the complexity of modelling the option to the illiquidity of the market in which hedges must sourced.

Yet the portfolio manager and the risk manager cannot avoid them.  The time-honoured principle – “if we can’t analyse it, we won’t do it” – might deter, say, a hedge fund from buying a power plant.  But is not of much help to a utility whose core business is owning and operating these assets, which represent substantial amounts of their capital at risk.  If the optionality in the take-or-pay structure of a long term gas supply agreement defies analysis, that is a good reason for not signing the contract.  But if it is already a substantial component of the legacy portfolio, avoidance is no longer an alternative.

As in so many real-life situations, the solution will lie in a blend of strong theory and robust pragmatism.  Without the theory, we don’t even know the direction we’d ideally like to take, and cannot begin to optimise our position.  Without the ability to make intelligent compromises in the face of reality, we may find ourselves frustrated to the point of inertia.

Where water-tight text-book risk management solutions are not available, we will still be better placed by bringing to bear the best analyses possible, in combination with experience and judgment.  An 80% solution is a big improvement on none.  And this is nowhere more applicable than in risk-managing real options in energy portfolios.

Nick Perry is a Senior Advisor with Timera Energy.  He has extensive energy industry expertise specialising in portfolio & transaction structuring, risk management, market dynamics and regulatory issues. He has spent over 20 years working in the gas and power industries for Exxon, Amoco and Enron, where he was a Board Director of Enron Europe.


Timera Energy provides tailored in-house corporate training services covering, amongst other areas, energy risk and portfolio management. If you are interested in finding out more please contact us.


UK shale and security of supply

Vladimir Putin’s political brinkmanship has brought security of gas supply firmly back into focus across Europe.  The importance of gas sales to the Russian economy means that disruptions to gas supply are likely to be temporary rather than structural.  But Russia’s use of energy supply as a means of political leverage presents an uncomfortable situation for European governments.

The UK government has displayed a clear concern, given domestic reserves of conventional gas are in rapid decline.  The UK also sits at the outer edge of European gas transport infrastructure network.  Growth in LNG regas capacity over the last decade has increased the UK’s insurance policy against pipeline supply cuts.  But with the cost of LNG supply currently driven by Asian spot prices, this is an expensive insurance policy to fall back on.  As a result, security of supply is a key factor supporting the long term case for investment in UK shale gas.

Government backing

We wrote previously on the gap between rhetoric and reality in the UK government’s case for shale gas support.  Government arguments in support of shale have been refocused in the last six months.  The government appears to have understood that shale gas is very unlikely to have a significant impact on marginal wholesale price setting.  Instead support for shale gas has been re-focused around a more realistic package of security of supply, balance of payments and jobs.   The government has also announced a number of practical policy support measures.

Shale developers will have access to generous tax breaks.  For example they will be granted tax allowances for developing gas fields, where exploration expenditure can be offset against tax for a decade.

The government has also announced incentives to encourage local support, given local planning permission is one of the biggest hurdles to shale gas development.  These are focused on channelling financial benefits from shale gas back into the local communities, for example:

  • Local councils are able to retain 100% of business rates raised from fracking sites.
  • A lump sum of £100,000 plus 1% of revenues may be available for distribution to local communities  when test wells are fracked.
  • Direct cash payments may also be made to property owners living near fracking sites.

As well as direct financial incentives, the other carrot for local communities is jobs.  Diagram 1 illustrates how UK shale gas development potential is focused around a belt across Northern England.  This is an area that continues to suffer from the fallout of the financial crisis and if shale gas development took off it could provide a valuable boost to the local economy.  But in order for that benefit to transpire, shale gas production economics remains the biggest of all hurdles.

Diagram1: Key UK shale gas formations, licenses and sites.

shale diag

Source: BBC

Resource potential vs economic extraction

The British Geological Survey (BGS) published a report with DECC in July 2013 that suggested there could be about 1,300 tcf (36.8 TCM) of shale gas in the Bowland basin in North West England.  Although only a small portion (e.g. 10%) of that is likely to be recoverable.

Recent exploration progress by Cuadrilla has shown some positive signs.  The company has said there is 330 tcf (9.3 TCM) of gas within its licence area, 50% more than previous estimates.  A recent progress report from the Imperial College London was also promising, with analysis indicating that the UK’s onshore shales are rich enough in organic material and have the right petrology for hydraulic fracturing.

But ultimately it will be the drilling of test wells that reveals the economic viability of UK shale.  UK shale formations are more complex than US shale which is likely to significantly increase production cost.  The planning permitting process is also expensive, with 8 or 9 permits required for each test well.  As a result the chairman of Cuadrilla (Lord Browne ) has indicated it will take 5 years and the drilling of 20 to 40 test wells to judge whether the UK has a viable shale gas industry.

Industry money is flowing

Even though the gas is yet to flow, the last 12 months has seen a step up in capital flow into UK shale gas exploration.  The prospects of the Riverstone backed Cuadrilla improved significantly last year when Centrica purchased a 25% stake in the Bowland exploration licence for £40m.  Centrica will also pay an additional £60m in exploration and appraisal costs and £60m if it participates in any development.  Total has also announced in January that is will invest $50m in UK shale gas and has acquired stakes in shale gas exploration licences in the Midlands operated by the US company Ecorp.

These investments represent low cost options for the companies involved.  However the fact that oil majors and utilities are stepping in to invest directly in UK shale licenses is a sign of transition from the speculative exploration stage.  Test wells and time will tell whether shale gas production will have a major impact on UK gas supply.  But across US shale and Australian coal seam methane plays, recent history illustrates that there is at least the potential for main stream investment in unconventional gas reserves to be followed by transformational changes in a country’s gas balance.