Oil and coal pricing back in focus

This blog is focused on gas and power markets.  But every few months we take a step back and look at the impact of the broader commodity market environment.  With front month Brent crude oil plunging more than 20% over the last few weeks and a broader sell off across commodity markets, it seems like an opportune time to revisit this theme.

There are two main factors behind the recent commodity price falls.  Firstly, there are increasing concerns about weakening global economic growth and hence commodity demand.   The IMF last week fired a warning shot on global growth, raising particular concern about Europe slipping into another recession.  Despite massive monetary stimulus, the Japanese economy is also treading water.  And importantly for commodity demand, the Chinese economy still appears to be going through a period of consolidation at lower levels of growth.

The second factor is a surge in the US dollar across the last three months.  This reflects a shift in the balance of monetary expansion away from the US and towards Europe and Asia.  Over the next year or two it looks like both the Eurozone and Japan will rely on more aggressive monetary easing to respond to the dual threats of deflation and weakening economic growth.  The US currently has the healthiest growth & employment scorecard and may start to raise interest rates again next year.  This shift in relative monetary policy stances is driving the movement of capital from other currencies into the US dollar.  This is important for global commodities (which are traded in USD terms) because there has historically been a significant negative correlation between commodity prices and the dollar.

With these two factors as context we now take a look at the recent evolution of oil and coal prices.

Oil takes a dive

The front of the Brent crude oil curve has been trading in a range between 90 and 125 $/bbl since the start of 2011.  The last few weeks have seen a sharp 20% decline in the front month contract to break support at the bottom of this range, a move which has got a lot of press.  As well as the two factors described above there are a couple of other factors of specific relevance to the decline in oil prices:

  • US unconventional oil production keeps expanding to new record levels, which is contributing to the weight of global supply in a weaker demand environment.
  • OPEC does not appear to be presenting a convincing near term response to counter the recent price fall.  In fact Saudi Arabia appears to be comfortable with the current price fall according to Reuters.

As much as the recent move in the front of the oil curve has generated excitement, there has not been much follow through when you look several years forward.  The recent move down in near term contracts has resulted in a very flat curve.  But this is still anchored above 90 $/bbl in 2020.  The current oil price decline will become a much bigger story if the fall below 90 $/bbl in the front of the curve, starts to materially pull down longer term prices in the tail.

Chart 1: Evolution of Brent crude front month contract since 2011 ($/bbl)
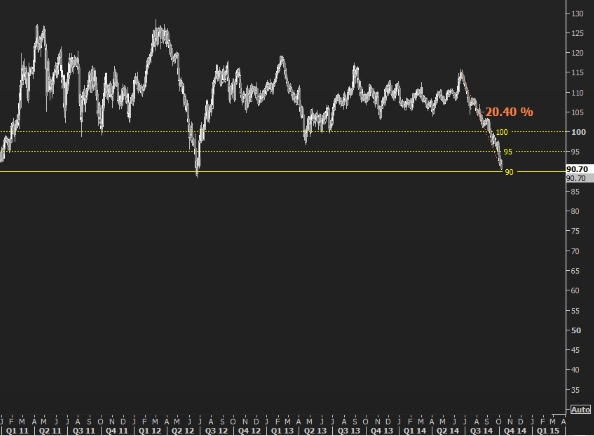
Brent chart

Source: Reuters

Coal continues to slide

The coal market has been a story of steady price decline for the last three years, as shown in Chart 2.  It is well known that China sits at the centre of the global coal market as the world’s biggest consumer.  What is less well known is that China is also the world’s biggest producer of coal.  Although a number of Chinese mines look to be uneconomic at current price levels, China’s production has continued to expand, reducing import demand.  China has also recently slapped tariffs on imported coal in a worried attempt to protect struggling domestic miners.  The situation in China is weighing on an already oversupplied seaborne coal market.  This is not helped by weakening US gas prices which continue to favour gas-fired generation over coal.

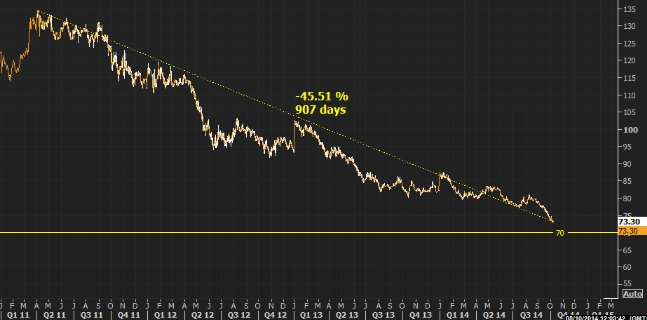
Chart 2: Evolution of coal API#2 ($/tonne)

API2 chart

Source: Reuters

Global coal price weakness is however starting to induce curtailment of supply in large exporting countries.  Australia in particular has had several mine closures and cutbacks as a result of weak export prices and a relatively high production cost base.  More closures of export mines are going to be required to stabilise coal prices.  But prices have been at or below the long run marginal cost of new production for some time now.  So the coal market has progressed to a more advanced stage of reacting to price weakness.  The oil and gas markets on the other hand are only just starting to confront the prospect of a period of oversupply.

LNG vessel charter rates heading south

The upheaval in the global gas market this year is also being felt in the LNG shipping market. LNG charter rates have sunk in 2014 alongside gas prices.   Healthy LNG vessel order books in anticipation of new liquefaction capacity are resulting in a wave of new deliveries from shipyards.  At the same time the fall in demand for gas in Asia is reducing vessel journey times.   The fall in LNG charter rates is having an important knock on impact on LNG shipping costs which are becoming an increasingly important driver of global gas price differentials.

The weight of supply

We published an article at the start of January on ‘Steam coming out of the LNG shipping market’.  Our conclusion was that given the weight of a substantial order book for LNG vessels “2014 may mark the start of the next glut in LNG shipping capacity”.  Spot charter rates have fallen from levels around 90,000 – 100,000 $/day in 2013 to around 50,000 $/day last month.  12 month term charter rates have also fallen to around 58,000 $/day in sympathy as shown in Chart 1.

Chart 1: LNG spot and 12 month term charter rates

LNG Charter Rates Sept14

Source: RS Platou Monthly (Sept ’14)

These rates are now back below those required to support new build of LNG vessels. It also appears that the post-Fukushima boom in shipping charter rates is giving way to a period of oversupply, similar to that seen from 2008 to 2010.

New orders for LNG vessels are drying up. But there is a lot of inertia in the existing order book given the time lag between order and delivery.  Existing orders have been driven by higher LNG prices and charter rates post-Fukushima and a wave of enthusiasm around new liquefaction capacity coming to market in the second half of this decade.  Chart 2 gives an indication of the number of vessels to delivered over the next 3 years.  While many of these vessels are under long term contract in relation to new liquefaction capacity, there are also a number that are not under contract.  These may further weigh on shorter term charter rates.

Chart 2: Global LNG vessels order book

LNG Vessel Order Book Sept14

Source: RS Platou Monthly (Sept ’14)

Changing LNG shipping costs and flow dynamics

As well as a healthy order pipeline, the other factor weighing on LNG charter rates in 2014 is changing patterns of vessel utilisation.   The sharp fall in Asian spot LNG prices over the summer has seen a reduction in the diversion and reloading of European LNG supply to Asia.  This in turn reduces average journey time and unballasted voyages, factors which have supported shipping demand and charter rates over the post-Fukushima period.

Weak spot gas prices and falling charter costs have also reportedly led to a number of vessels being used for storage plays for up to 6 months, i.e. gas can be stored in the summer and re-sold as prices recover into winter.

Vessel charter rates are the largest component of LNG shipping costs. So the fact that charter rates have more than halved since 2012 has significantly reduced the cost of moving LNG.  Chart 3 shows the impact of the recent fall in charter rates in reducing shipping costs for cargo diversions from Spain (Huelva) to Japan (Sakai).

 Chart 3: Illustration of reduced LNG cargo diversion costs from Europe to Asia

LNG Shipping Cost Example Sept14

Main assumptions:

  • Laden leg only, 147k MT vessel, 600 MT fuel oil price
  • 10,014 NM journey via Suez canal, 19 knots average speed,(~22 day voyage) 
  • USD 400k canal transit charge (one way), other costs including port fees, brokerage and insurance.

Source: Timera Energy

The primary driver of LNG flows is locational price differentials.  It appears that we are entering a new phase of global gas pricing where these price differentials may be narrowing (as we set out here).  A reduction in LNG charter rates will likely act to reinforce global price divergence by reducing the cost of moving LNG between locations.  As global LNG market tightness subsides, shipping costs are likely to become increasingly important in driving global pricing.  We look at some of the implications of shipping costs on LNG pricing dynamics in an article to follow shortly.

Tighter UK market, higher gas plant margins?

The last 3 years have been tough for UK gas-fired plant owners. A slump in coal prices has given coal plant a clear competitive advantage over gas plant in the merit order.   On top of this a steady increase in renewable output is eroding CCGT generation margins and load factors.  Yet looking forward over the next 3 years the UK is heading into a period of very tight system capacity margins.  But is the market anticipating a recovery in gas plant generation margins as a result?

Several important things have happened since we last looked at UK gas plant margins. The UK power market has now been given a rulebook for the new Capacity Market, which is likely to have broad reaching implications for capacity decisions and power price dynamics as the decade progresses.  In the more immediate future there are a number of unexpected plant outages into the approaching winter as we set out here.  That has in turn led the system operator National Grid to run an additional tendering process for emergency generating reserve (BSR) into this winter.

A recap on UK gas-fired plant

There is about 30GW of CCGT capacity in the UK market which plays a dominant price setting role. CCGTs can be thought of in 3 tranches (of approximately 10GW each):

  1. Tranche 1: Very efficient and flexible CCGT built in the last few years, currently running mostly as mid-merit plants (e.g. ~50% load factor)
  2. Tranche 2: Plant of average efficiency and flexibility built around the turn of the century, currently running mostly as peaking plants
  3. Tranche 3: Older, less efficient and less flexible plant built in the early to mid 90s, currently running at very low or zero load factors

These 3 Tranches are shown in the UK stack diagram in Chart 1 below (for an illustrative set of forward prices).

Chart 1: UK generation supply stack (with non-controllable generation netted off demand)

UK stack

Source: Timera Energy

Market pricing for plant gas margins

Chart 1 shows the dominance of CCGT in the UK supply stack. That results in a strong relationship between power and gas prices.  This relationship drives gas plant generation margins (sparkspreads).  Market convention is to track sparkspreads based on a defined plant efficiency (49%) and cost structure system, broadly representative of system average parameters.  However actual margins earned by individual CCGT vary significantly based on the efficiencies and cost structures of individual assets.  Two set of clean spark spreads are illustrated for a generic Tranche 1 (52% efficient) and Tranche 2 (49% efficient) asset at current forward market prices in Chart 2.

Chart 2: UK Forward Clean Spark Spreads (CSS)

UK CSS Sept14

Source: Timera Energy (prices from ICE, Sep 2014)

Market liquidity is very limited beyond 2016, which means that 2017/18 pricing is little more than indicative. But there are a few important observations that can be made:

  • Intrinsic value: Plant value that is hedgeable in the forward market is focused in peak periods, particularly for Tranche 2 assets.  This means a significant portion of realised asset value depends on capturing price shape and volatility close to plant dispatch.
  • Margin recovery: Despite sharply declining system capacity margins over the 2015-17 period (due to scheduled closures), the market is not pricing in any recovery in spark spreads (although note the point below on curve rerating).
  • New build: Current forward market pricing is a long way short of what is required to support new build of CCGT (around 13 £/MWh on a baseload equivalent CSS basis), unless a very strong capacity price signal emerges in the new Capacity Market (e.g. 70+ £/kW).

Looking forward

While the current UK market environment is not friendly for CCGT margins, the composition of the supply stack provides a key downside support for CCGT generation margins. Because CCGT plants make up such a large portion of the stack, negative spark spreads are not the problem they are in Continental European power markets.  Even at low levels of demand (& high levels of wind output) gas-fired plants are still typically fulfil the role of marginal price setting capacity.  A buffer against negative spreads may be cold comfort for UK gas plant owners but it does prevent CCGT plant from being driven completely out of merit as has happened in Continental markets (e.g. Germany, Netherlands).

The really important question is when forward sparkspreads may recover. History has shown that structural shifts in forward market conditions are often precipitated by a shock in the prompt market, for example due to a cold winter or major asset outages.  Shocks to the front of the forward curve can result in a rapid re-rating of margins along the curve.  And the UK market is certainly vulnerable to such a shock as the system capacity margin tightens across the next 3 years (as we set out here).  We suspect market pricing reflects a degree of complacency as to the risks over this period.

Looking beyond the UK market tightening over the next 3 years, the evolution of gas plant margins will depend heavily on the Capacity Market.  Capacity payments represent a structural change to gas plant margins, likely to at least cover CCGT fixed costs (as we set out here).  However the Capacity Market is also likely to support higher system capacity levels, a factor that weighs on wholesale prices and volatility.  As important will be the type of incremental capacity delivered (e.g. OCGT, vs CCGT vs interconnectors) as this will impact price shape and volatility.  All these factors point to the result from the 1st capacity auction in December providing some key insights into the long term evolution of gas plant generation margins.

The next phase of global gas pricing

Commodity markets are known for their rapid shifts in supply/demand balance and pricing dynamics. The global gas market is a great case study.  In the space of a decade we have seen a commodity ‘supercycle’ boom, a global gas glut and a post-Fukushima squeeze.  And now price evolution in 2014 points to the start of something new.

Europe is playing a central role in shaping the evolution of the global gas market, as a gas importer and as a provider of LNG diversion flexibility. In turn, global LNG pricing and flows are becoming increasingly important drivers of the European gas market.  LNG import volumes are still low relative to pipeline imports, but they have a disproportionate influence on marginal pricing at European gas hubs.

The return of significant volumes of LNG to Europe in 2014 has been an important factor behind the hub price slump into the summer. Looking forward into the next phase of global pricing, global price differentials are set to play a key role in driving the evolution of the European gas market.

Global gas pricing phases

There have been several quite pronounced phases of global gas pricing over the last decade as described below and illustrated in Chart 1:

  1. 2006-2008 Commodity super cycle: The gas market was dragged along in a highly correlated boom/bust cycle in global commodity markets. However regional price convergence remained relatively strong as did the linkage between spot and oil-indexed contract prices.
  2. 2009-10 Gas supply glut: A surge in US shale production, new LNG liquefaction capacity and a global financial crisis, combined to rapidly shift the global gas market into a phase of oversupply. Importantly in Europe, hub prices went through a significant de-linkage from oil-indexed contract prices, fuelling substantial losses in supplier portfolios and a round of contract price reopener negotiations.
  3. 2011-13 Fukushima tightness: A more than 20% y-o-y increase in Japanese LNG demand precipitated a phase of tight and volatile spot LNG markets, inducing substantial volumes of European supply to be diverted to higher priced markets. This in turn supported a reconnection of European hub prices with oil-indexed contract prices.

Chart 1: Global gas price phases

Global Gas Prices Sept14

Source: Timera Energy

Gateway to a new phase

From the chart it can be seen that a pronounced shift in pricing dynamics is occurring in 2014. As we set out recently, this is no ordinary fall in global gas prices.  Asian spot LNG prices almost halved in H1 2014, from around 20 $/mmbtu to just above 10 $/mmbtu.  European hub prices have slumped in sympathy, to a large extent driven by surplus LNG flowing back into Europe but also by the loss of 57 bcma of demand over the October 2013-April 2014 period  on a year-on-year basis due to a mild winter.  Yet both spot LNG and European hub prices are showing signs of a recovery into the coming winter.

Substantial volumes of new Australian and US LNG exports are looming on the horizon which threaten to tip the global gas market into a period of oversupply (as we set out here). Although new supply starts to come online later this year, volumes do not ramp up in earnest until 2016/17.  That appears to leave the window open for two potential scenarios for the next phase of global pricing:

  1. Transitory volatility:  Emerging market LNG demand growth still looks to be relatively strong.  The 2014 price slump has definitely changed perceptions of the level of market tightness post Fukushima.  But it is possible we are entering a transitory period of uncertainty and volatile spot prices.  Gas prices may exhibit a more pronounced seasonal shape, with global price divergence in periods of tightness (e.g. cold winters).  But after the events of this year, a return to the consistent price divergence of the post-Fukushima phase looks to be much less likely.

This means that the flow of LNG into Europe is also likely to become more volatile with a knock on effect for European hub prices. The length of such a transitory phase is likely to be determined by the extent to which emerging demand growth can soak up the substantial volumes of new supply under development.

  1. Renewed supply glut: A scenario which was widely considered implausible at the start of this year is that the global market is already entering a period of oversupply. For this scenario to become a reality, the ramp up of new liquefaction capacity over the next three years would need to outpace demand growth.  Factors such as Japanese nuclear restarts and Asian economic growth will play an important role in determining this.  For Europe, such a scenario would mean a substantial increase in LNG flow back into Europe.  This would in turn be likely to place pressure on hub prices and lead to periods of disconnection from oil-indexed contract prices as was seen across 2009-10.

In both these scenarios, spot LNG prices will play an increasingly important role in determining the behaviour of European hub prices.

Watch for winter

The coming winter will be an important test case to understand which of these scenarios is more likely. The approach of winter is helping to stabilise Asian spot LNG prices which are now back above 14 $/mmbtu for November delivery.  This is below long term Asian contract levels (15-16 $/mmbtu at $100/bbl crude) and well short of spot price levels at the start of this year.  However it is enough to incentivise the diversion of cargoes from Europe back to Asia.

The diversion of LNG supply back to Asia and the end of a mild summer in Europe should relieve some of the recent downward pressure on European hub prices.   Certainly the forward curve assumes a sharp price recovery in spot NBP prices as is evident in Chart 1.  And the steep NBP (and TTF) curve contango into winter, points to unease at the ongoing threat of Russian supply cuts.

But perhaps the most important uncertainty for European energy companies is the relationship between hub prices and long term oil-indexed contract prices.  The gap between contract and hub prices which caused European suppliers so much pain in 2009-10 has re-opened again this year.  The evolution of this differential will be a key risk factor in the European gas market going forward.  Will the assessment of Russian ‘oil indexed with concessions’ contract price for Russian pipeline gas into Europe remain the important benchmark for European market players?  Or has the rather opaque process of rebates granted by Russia to many of its European long term contract buyers undermined this as a natural gravitational price benchmark?  We will return to revisit the implications of hub vs oil-index divergence in an article shortly.

UK power crunch risk remains

The threat of a mid-decade capacity crunch in the UK power market made national headlines in 2013. Concern around this threat has diminished noticeably over the last 12 months.  This change in mood is down to several factors.  Conditions last winter were benign, a new Capacity Market is on the way, and the system operator has new powers to tender for reserve capacity.  The calmer tone in the regulator’s 2014 Capacity Assessment reflects these factors.

Plant availability was relatively good last winter with a system capacity margin around 10%. However a number of scheduled asset closures are approaching and the UK is heading towards several years of historically low system capacity margins.  System margins are projected to fall below 5% by 2015 as shown in Chart 1.  With the capacity buffer this low, the risk of disorderly market behaviour and periods of system stress materially increases.  A cold winter, further asset closures or major plant outages across this period may cause a sharp rise in power prices and volatility.

Chart 1: Ofgem 2014 Capacity Assessment system capacity margin scenarios

derated CM chart

Source: Ofgem

After raising the alert in its 2013 Capacity Assessment, Ofgem set a calmer tone in its latest Assessment (published in June). This largely comes down to three factors:

  1. An historical downtrend in peak power demand (reinforced by a significant fall last winter)
  2. Steps taken by the government to implement a Capacity Market from 2018/19
  3. The introduction of Supplementary Balancing Reserve (SBR) contracts, which enable the system operator (National Grid) to tender for additional reserve capacity prior to 2018

In this article we take a look at some of the factors that will drive the system capacity balance over the next three years and their potential impact on market price dynamics.

Peak demand uncertainty

The decline in peak UK power demand over the last few years has been quite pronounced (as shown in Chart 2). The drop from 60GW to 58GW in 2008-09 reflected the impact of the financial crisis. There have also been some structural factors reducing peak demand, e.g. an increase in embedded renewable generation (which nets off demand).  But unusual weather was a key driver of the fall in demand in Winter 2013/14 (from around 56 to 54 GW).  Last winter was one of the warmest and windiest in recent history.

Chart 2: UK peak demand evolution and Ofgem projections

PK demand chart

Source: Ofgem

There is a combination of temporary and more structural effects driving the recent historical decline in peak demand.   This makes projecting the evolution of peak demand quite difficult.  All of Ofgem’s projected scenarios in Chart 2 show a continuing decline in peak demand as the decade progresses.  Ofgem also consider high demand sensitivities, although none of these exceed 55.5 GW, i.e. the sensitivities are lower than actual peak demand in Winter 12/13 (56GW).

A cold winter across the next 3 years with a recovery in peak demand back to 56GW (or higher) could lead to a very tight system capacity balance.  This is hardly an extreme scenario on the distribution of possible demand outcomes. 

Generator availability uncertainty

The other important part of the capacity balance equation is generator availability. Uncertainty around available capacity can be split into two categories:

  1. Unplanned generator outages
  2. Retirement or mothballing of capacity for economic reasons (or removal of capacity from the energy market to provide reserve services)

There is significant uncertainty associated with both of these categories, which erodes the effectiveness of scenario based forecasts of future outcomes. It is also an unfortunate characteristic of power markets that events which contribute to system stress tend to be positively correlated.

A number of unplanned outages are impacting the UK market coming into this winter (which are not reflected in the system margins shown in Chart 1). Two of EDF’s nuclear plant at Heysham and Hartlepool (around 2.4 GW) may remain offline until the end of the year given unexpected boiler safety issues.  Units 3 and 4 (1 GW combined) at SSE’s Ferrybridge plant are also out after a serious fire, with Unit 4 likely to remain on outage for the full winter.  There is also an overhang of availability risk associated with switching on older gas-fired plants which are currently sitting cold for long periods.

There is around 10 GW of older and less flexible CCGT capacity that has been running at low or zero load factor over the last two years. Most of this capacity is currently suffering substantial losses given ongoing fixed costs.  Plant owners are hanging on for a sparkspread recovery, favourable reserve contracts or capacity payments from 2018, but their patience to absorb further losses is being tested.  The 1 GW Barking power station recently announced it would close.  In our view it is quite possible that several more GWs of old gas capacity could either close, or be removed from the energy market under reserve contracts with the system operator.

Contracting of additional reserve capacity

In June this year, National Grid announced its intention to contract Supplementary Balancing Reserve (SBR) services as an additional precaution across the period prior to Capacity Market implementation in 2018. Grid also announced the volume of SBR it intended to contract (see table below) and indicated that it would only tender for demand side reserve (DSBR) for the coming winter.

Table 1: Intended SBR volumes announced by Grid in June

Grid SBR

At the beginning of this month, National Grid announced its intention to run an additional tender for SBR this winter. The volume of generation capacity to be contracted is yet to be announced, but the tender is an indication of Grid’s nervousness around unplanned outages and plant closures.

What is important to note about capacity contracted under SBR services is that while it is available to the system operator in emergencies, it is effectively removed from participating in the energy market and balancing mechanism. National Grid’s mandate is to use SBR capacity only as a last resort (i.e. just prior to issuing Emergency Instructions for involuntary demand reductions).  So by contracting SBR capacity, Grid reduces the probability of brown or blackouts.  But the window remains open for a substantial increase in power prices and volatility if the market tightens over the next three years.

Price dynamics in the wholesale energy and balancing markets are driven by the level of competition between generators to provide the marginal MW of capacity required.   Plant closures, outages and SBR contracting all act to reduce competition at the margin.  This in turn acts to increase scarcity rents earned by remaining generators and hence to increase power prices, sparkspreads and price volatility.

After several years of healthy system capacity margins and subdued prices it is easy to assume current market conditions will continue.  But as the system capacity margin falls over the next three years, the probability of a sharp increase in power prices, spark spreads and price volatility increases.  This would provide a welcome relief for the owners of existing flexible gas plants, which will be key to maintaining system security of supply as the capacity margin tightens.

Why the UK will need fast cycle storage

The UK gas market is undergoing two major long term structural shifts. UK import dependency is increasing as domestic gas production declines.  At the same time, short term fluctuations in UK power sector gas demand are increasing as intermittent renewable generation capacity rises.  Both of these factors are driving an increasing requirement for system flexibility.   This will in turn drive the need for investment in new gas storage facilities.

The UK’s gas storage requirements are however commonly misunderstood. As well as specific storage sites, the UK is very well interconnected with other large sources of longer range gas flexibility.  For example pipeline imports from Norway, Belgium, Netherlands and a high level of LNG regas capacity.  As a result, there is ample existing import infrastructure capacity which can be used for seasonal balancing.

However imports can be susceptible to supply disruptions or time lags in response to market price signals. Fast cycle gas storage plays a key shorter term ‘bridging’ role in providing deliverability to insure against issues with imported supply.  It also provides important short term flexibility to enable gas fired power plant to support renewable intermittency.

Structural market changes

The increase in UK import dependency is a function of declining UK Continental Shelf production as shown in Chart 1. The UK is becoming more dependent on several larger supply sources (e.g. Norwegian pipelines, interconnectors and LNG imports) as opposed to a diversified mix of UKCS fields, pipelines & processing plants.  This is resulting in a greater UK exposure to external supply shocks and an increase in dependency on key import infrastructure.

Chart 1: Evolution of UK gas supply mix (2004-2013)

UKCS Decline C1

Source: DECC Energy Trends 2013

The UK’s aggressive targets for renewable generation also have significant implications for the gas market. The UK has around 30 GW of CCGT capacity that is the marginal provider of flexibility in the power market.  As intermittent output from wind and solar capacity rises, so to do the short term fluctuations in gas demand from CCGTs as they respond.  This will over time act to increase UK gas system stress and price volatility.

Increases in import dependency and renewable intermittency both drive a requirement for an increase in shorter term gas deliverability (as opposed to longer term seasonal flexibility).

Why deliverability is key

The UK has ample import capacity across the Norwegian pipelines, interconnectors and LNG terminals. In a medium to longer term horizon (e.g. greater than a 1-2 month horizon), a strong price signal can respond to pull more gas into the UK.   DECC to their credit understand this logic and used it to support their decision not to intervene in the gas storage market last year (a position we supported).

The vulnerability of the UK gas market is to short term swings in demand, infrastructure outages & supply chain response delays. In periods of system pressure what is most important is the bridging role played by short term deliverability, not higher volumes of gas in store.  This importance will increase with intermittency.

Evidence of this short term requirement for deliverability and the longer term effectiveness of the NBP price signal in attracting imports can clearly be seen across the last three winters. For example, the price spikes of Mar 2013 reflected a period of deliverability scarcity over 4 to 6 weeks, until higher prices attracted additional LNG imports (as described here).

It is in these periods of system stress that fast cycle storage facilities play a critical role. There is just under 5bcm of operational storage capacity in the UK.  The large seasonal Rough storage facility represents about 75% of this on a working capacity basis.  While salt cavern facilities such as Holford and Aldbrough are small relative to Rough on a capacity basis, their flexibility to cycle working capacity multiple times a year means they punch well above their weight.

This is illustrated in Chart 2 where Rough is represented by the blue areas and faster cycle facilities by the pink areas. Rough tends to withdraw gas in a reasonably steady pattern across the winter.  The faster cycle facilities on the other hand are constantly cycling and adjusting patterns of injection and withdrawal in response to market conditions.

Chart 2: UK storage delivery and stock drawdown (Winter 12/13)

Storage Util C3

Source: National Grid 2013-14 Winter Consultation

As well as providing deliverability in periods of supply disruption or system stress, fast cycle storage also provides ideal support for increasing intermittency. Fast cycle storage can be thought of as a rapid charge and release ‘gas battery’.  Gas can be withdrawn in periods of low renewable output when CCGT gas demand is high and re-injected in higher output periods when gas demand (and prices) fall.

This cycling flexibility of fast cycle storage acts to reduce market price volatility. It also acts to increase prompt market liquidity (e.g. within day & day-ahead), as storage capacity owners manage their injection and withdrawal exposures in the market.  Both of these factors ultimately contribute to reducing the cost of supplying gas to customers. 

Investment in new storage capacity

Both the government and the system operator (National Grid) recognise the requirement for further investment in storage deliverability. DECC & Ofgem point to a large volume of consented projects in their Oct 2013 Security of Supply Report, included in the green area in Chart 3.

Chart 3: Operational vs proposed UK storage capacity volume Deliverability C2

Source: DECC/Ofgem Statutory Security of Supply Report (Oct 2013)

But a significant volume of this consented capacity is lower cycling seasonal storage that is unlikely to ever be developed, given structural weakness in seasonal price spreads. There is a much smaller volume of consented fast cycle salt cavern capacity.  The development & incremental investment economics of this fast cycle capacity is favourable given a value skew towards volatility (as opposed to seasonal spreads).

The UK market has been delivering fast cycle capacity over the last 5 years (e.g. Aldborough, Holford & Stublach) which reflects this characteristic. However investment approval on this capacity was achieved under more favourable market conditions several years ago.  The current environment remains tough for developers with a strong market price signal yet to emerge to support further investment.

Chris Lefevre provides a telling statistic on proposed vs developed storage capacity in his 2013 OIES report on UK gas storage. In 2005, DECC listed 5 bcm of additional capacity (10 new projects) to come online by 2010.  In reality only 0.35 bcm was actually delivered.  If the current market environment leads to a hiatus in storage investment over the next few years, the UK’s deliverability issues may become much more pronounced next decade as import dependency and intermittency increases.

The timing of a market price signal to support storage may be uncertain. But the structural drivers behind a requirement for additional deliverability in the UK gas market are real.  Fast cycle salt cavern storage facilities represent a relatively cheap and flexible source of incremental deliverability as well as having low incremental expansion costs.  As a result these facilities are going to play a key role in supporting the evolution of the UK gas market.

This is no ordinary fall in global gas prices

The Fukushima disaster in March 2011 precipitated a shift in global gas market balance. A period of market tightness followed, driven by robust Asian demand and constrained supply growth.  This post-Fukushima period has been characterised by global gas price divergence as Asian and South American buyers have had to pay a premium to attract LNG supply from Europe.

But the last six months has seen a seismic shift in global gas pricing.  Step back to the start of 2014.  As the year commenced, Asian spot LNG prices were near all time highs around 20 $/mmbtu.  Buyers were scrambling to cover both short and longer term portfolio exposures.  There was a strong market consensus that this period of tightness would continue at least until the second half of this decade, when large volumes of new supply are due, if not into next decade.  That market consensus has been shattered by the slump in global gas prices across Q2 and Q3 of this year.

Risk of a shift in global gas balance

The risk of a shift from post-Fukushima market tightness towards a period of global oversupply has been a key theme of this blog. For example:

  • In early May 14 we set out in detail the case for a shift to global oversupply and the associated commercial implications.
  • In Feb 14 we showed a breakdown of the key elements of global supply & demand and how these pointed to the risk of a period of oversupply.
  • In Dec 13 we highlighted a list of potential risks entering 2014, at the top of which was a pronounced decline in Asian spot LNG prices and European hub prices.
  • In Oct 13 we highlighted the importance of new US export supply in driving global price convergence & reducing LNG portfolio flexibility value.
  • In Jul 12 we described the risk of a more structural re-convergence in global gas prices.

We do not claim to have forecast the events of the last few months. But for the last two years we have questioned the strength of market consensus around continuing global gas market tightness.   Price risk in our view has been firmly focused on the downside given bullish expectations, large & chunky volumes of committed new supply and uncertainty around the evolution of demand.

However the pace and global nature of the recent decline in gas prices has been alarming. This is well illustrated in Chart 1 which shows the evolution of LNG spot price benchmarks covering the period since the Fukushima disaster.

Chart 1: Global LNG spot price evolution (2011-14) click on the chart for a blow up view

LNG prices Aug14

Source: Reuters (using Waterborne spot LNG data)

The rapid divergence of Asian prices after the Fukushima disaster in Mar 2011 can be seen to the left of the chart. Asian price divergence has remained a structural characteristic of the global market across the proceeding three years, although there have been seasonal dips in Asian spot prices over the summers of 2012 and 2013.

But the period from Apr 2014 marks a shift to a much sharper decline in Asian spot prices towards 10 $/mmbtu. As this has closed out the value from diverting European supply, LNG has flowed back into Europe driving down hub prices.  US gas prices have also declined somewhat, although there has been a pronounced convergence in cross Atlantic pricing as European prices have slumped.  As things currently stand, the state of global price convergence is broadly similar to the period preceding the Fukushima disaster in early 2011.

It is easy to get caught up with market momentum and forget that the recent decline is partly seasonal in nature. Largely due to milder weather, European demand for the period October 2013 to April 2014 was 57 bcma lower than the corresponding period in 2012/2013.  In Asia LNG demand (with the exception of China) appears to have flattened out on a 12 month rolling average basis.  While it is widely claimed that this is a weather-induced effect, there is little evidence for this apart from in South Korea.

Prices are already stabilising from their summer lows and may make a meaningful recovery into the winter. For example recent forward pricing for LNG has exhibited quite a steep contango. Spot Asian cargoes for Aug/Sep delivery have recently been changing hands around 11 $/mmbtu, with cargoes for November delivery pricing above 13 $/mmbtu.  While the extent of this winter recovery is uncertain, the price slump into the summer has already shaken market perceptions of the global supply & demand balance.

Some implications of the price shock

One of the more surprising characteristics of the 2014 decline in LNG prices is the fact that it has occurred in the absence of large volumes of new supply. While the Papua New Guinea LNG project commenced exports of spot cargoes in May this year contributing to pressure on Asian spot prices, its impact is relatively small scale in a global market context.  The more substantial volumes of new Australian and US export supply still loom on the horizon as projects ramp up in earnest from 2015.

In Australia 85 bcma of new capacity (under construction) is set to come onstream by the end of 2018. In the US 40 bcma has achieved FID with 23 bcma of this under construction.  It is the impact of this new supply that is spooking the market.  Of key importance is how the recent price shock effects the development of new liquefaction projects and the negotiation of long term contracts.

The early evidence is pointing towards a sharp increase in reluctance from LNG buyers to commit to long term offtake contracts at price levels required by developers.   Australian export projects are particularly vulnerable as they face the joint threats of weak spot prices, US export competition and a rising cost base.  As an example Chevron’s Gorgon project is struggling to sell any additional long term contract cover as reported by Reuters last week.  The $54b project which is due to start exporting in mid-2015 is only 65% contracted, well short of the comfort mark.  In the absence of long term contract sales, Chevron is left with little choice but to sell volume into the Asian spot market and hope for a recovery in prices.  The risk of delays and cancellation for projects which are at an earlier stage of development in both Australia and the US has increased significantly.

We will come back with more detailed analysis of the medium to longer term implications of this year’s price shock in subsequent articles.

The way forward

A first observation on the current state of global pricing is that in many markets spot prices are significantly below long term oil-indexed contract price alternatives. This creates a strong incentive for suppliers to minimise their contract take and buy spot gas as a replacement if required.  Coming into the winter, this is an important support mechanism both for Asian LNG spot prices and for European hub prices.  As a practical example, one of the world’s largest LNG buyers Kogas has recently been negotiating to defer up to 10 contracted cargoes from this summer/autumn into the coming winter.

It is also worth noting that the LNG spot market still has relatively low levels of liquidity. This means a cargo overhang can have a pronounced impact on price as has happened over the summer.  Illiquidity could also act to drive a sharper LNG spot price recovery over the coming winter if for example it is unseasonably cold or a major Russian supply disruption results in higher European demand for LNG.

European hub prices are also showing signs of stabilisation as the seasonal focus shifts towards winter and the ongoing threat of Russian supply disruptions. European hub prices provide key support for global LNG spot prices, as liquid European hubs act as a market of last resort for surplus LNG cargoes.  The extent of the recovery of both Asian spot LNG and European hub prices into the coming winter will be an important barometer for the state of the global supply and demand balance.

But regardless of how gas prices recover into the winter, we expect significant fallout from the recent price shock. There is a key risk that as new export projects ramp up in 2015 they contribute to an overhang in spot supply reinforcing global price convergence.  While this poses a threat to the contracting and development of liquefaction projects, it is good news for LNG buyers.  These are conditions that may support a strong pickup in LNG spot market liquidity and potentially the evolution of a more meaningful Asian hub price.

The global gas market has been defined by several distinct phases of evolution over the last decade: the commodity super cycle boom, the US shale and financial crisis driven bust and the post-Fukushima phase of market tightness.  It is our view that the global market is now entering its next phase, potentially one of transition to a period of significant oversupply.  This may have profound implications for the evolution of both gas and power markets over the next few years, a theme which we will continue to explore across the second half of this year.

European hub price volatility on the rise

It is a common characteristic of energy markets that prices and volatility tend to be positively correlated.  This reflects the fact that price distributions tend to be skewed to the upside.  Energy prices rarely go negative, but market shocks can cause explosive price spikes. However, European hub price volatility is on the rise in 2014, and the cause has been a slump rather than a spike in gas hub prices.  This is likely to have some interesting implications for the value of gas supply flexibility.

European hub price volatility

Hub price volatility has been at depressed levels for most of the last 3 years.  There have been brief periods of price spikes caused by infrastructure issues over the last two winters.  But market stability has quickly returned as an oversupply of flexibility dampened hub price reactions.  Chart 1 shows the evolution of day-ahead prices and historical volatility at the Dutch TTF hub (as a proxy for North West Europe).

Chart 1: TTF day-ahead prices and historical volatility (2007-14)

TTF DA Prices & Vol

Source: Timera Energy using LEBA prices

It can be seen from the volatility chart that day-ahead volatility ranged around the 80% level across the 2007-10 period.  However over the 2011-13 period volatility slumped to levels below 40% (excluding the price spikes of Feb 12 and Mar/Apr 13 that we have previously addressed on this blog).  A steady recovery in day-ahead volatility can be seen in 2014 as hub prices have rapidly declined.

There is an intuitive explanation for the recent pickup in hub price volatility.  The market has been in a reasonably subdued ‘steady state’ over the 2011-13 horizon with hub prices loosely tracking oil-indexed contract prices and healthy levels of portfolio supply flexibility.   The sharp reduction in hub prices in 2014 represents the European gas market breaking out of that state of relative stability (as we set out last week).

The associated increase in uncertainty around future price levels (assisted by the ongoing Russia – Ukraine dispute) and associated impact on portfolio exposures, is reflected in price volatility as players adjust their portfolio positions.  The 2014 price slump has to a large extent caught the market by surprise and price volatility is rising as a result.

In addition some of the key providers of gas supply flexibility are currently relatively constrained.  For example oil-indexed contract swing is out of the money given low hub prices and seasonal storage capacity across Europe is relatively full.

Implications for gas flexibility value

The oversupply of gas portfolio flexibility and associated slump in volatility over the last three years has dampened market interest in flexible assets and flexibility products.  Gas storage capacity has been particularly hard hit as both seasonal spreads and volatility have declined.  But there has been a renewed interest in supply flexibility as 2014 has developed, particularly in mid to fast cycle storage capacity.

Fast cycle storage is best placed to take advantage of value opportunities from prompt price volatility.  For example taking advantage of the temporary price spike after Russia announced it would cut Ukranian supply or the price dips as high volumes of LNG have flowed into hubs.  The widening of the seasonal spread between Summer 14 and Winter 14/15 also represents a stronger price signal for the seasonal utilisation of slower cycle storage assets.  This reduces the competition that fast cycle storage faces from seasonal facilities in providing shorter term deliverability.  The available capacity product range sold by mid to fast cycle storage buyers has improved over the last few years as new facilities have come online.  There may be a significant increase in liquidity of these products if the 2014 recovery in prompt volatility continues.

This is our last article before the Blog takes a summer break. We will be back towards the end of August. In the meantime have a warm and relaxing summer..

Gas hub pricing in a state of flux

As the summer heats up spot gas prices have continued to slump.  Asian LNG cargoes are changing hands at under 11 $/MMBtu, price levels not seen since Fukushima.   The reaction of European hub prices illustrates the global gas price linkage that has evolved with the LNG market.  UK NBP spot gas prices are now around 35 p/th (TTF spot around 15 €/MWh), a 50% fall from the end of last year.  As surplus gas continues to flow into Europe and re-shape the hub price landscape, we are publishing a two part series on European hub pricing dynamics.

In this article we look at the linkage between Asian LNG prices and European hub prices, as well as some of the characteristics and implications of the current hub price decline.  In next week’s article we look at some of the factors driving European gas supply flexibility value, specifically hub price volatility and price divergence across hubs.  In both articles we again apply the framework we set out previously for understanding European hub price dynamics.

The price slump continues

A mild European winter and spring has blossomed into a warm summer.  Good for the holiday season but not for European gas demand.  Asian LNG demand has also been weak and falling spot prices have resulted in an increase in LNG flow into European hubs.  This is partly the result of surplus Qatari LNG flow (as we explained here) and partly due to a decline in the diversion of European LNG supply given low Asian spot price levels.

The power and gas team at Reuters have put out some good charts recently that illustrate the current price moves in an historical context.  Chart 1 shows the 2014 Asian spot price decline against the context of 2012 and 2013 LNG spot price seasonal shape.  Previously Asian spot prices have found support in the 12-14 $/MMBtu range as at these levels European hubs start to soak up surplus cargoes.  But weakness in European pricing this summer has seen a continued decline in Asian spot prices.

Chart 1: Evolution of Asian LNG spot prices (Japanese benchmark) 2012 – 2014

Reuters Asian LNG s

Source: Reuters

What is driving hub prices now

Our framework for European hub pricing revolves around understanding the marginal sources of flexible supply that drive hub price dynamics.  Gas prices tend to be anchored in a loose band around oil-indexed contract prices, with contract swing, production flex (e.g. Statoil) and storage the main drivers of marginal pricing.  The current market dynamics have knocked European hub pricing dynamics out of this state of relative stability, as shown in Chart 2.

Chart 2: Global gas price benchmarksgas price chart

Source: Timera Energy

Weak demand and surplus LNG flow have caused hub prices to disconnect from oil-indexed contract levels.  This disconnection has happened previously (e.g. post financial crisis in 2009) and it tends to be a temporary or transitional effect (as can be seen in Chart 2).  What is important, is to understand the marginal sources of supply that can react to stem the hub price decline, for example:

  • Storage typically provides summer price support as facilities inject in preparation for the winter.  But after a mild winter, storage balances are relatively high (e.g. average levels above 80% across Germany, the UK and the Netherlands) so injection demand is weaker.
  • Flexibility within supplier portfolios has increased in price responsiveness as trading functions optimise flexibility against hub prices (e.g. substituting cheap spot gas into the portfolio where possible to replace higher cost sources).  However most of this flexibility is likely to have already been utilised (e.g. swing contract volume take minimised).
  • LNG flow is typically relatively price insensitive in times of weak prices, given limited production flexibility.  Although the Qataris are reportedly taking some steps to curb production to alleviate further pressure on prices.

That leaves the power sector to play an important price support role.  Since 2010, coal plants have enjoyed a substantial competitive advantage over gas plants in Europe, given declining coal prices.  This year’s gas price slump has eroded that advantage and coal and gas plants are starting to compete again to set marginal power prices.  This is most visible in the UK power market where new high efficiency CCGT plants are starting to displace older coal plants in the merit order, increasing power sector gas demand.   It is worth keeping an eye on gas vs coal switching levels going forward, because if hub prices continue to decline these will become a key price support benchmark.

Some implications of the price slump

Gas producers are nervously observing the current price decline for an indication as to whether this is a one summer phenomenon or a more structural change.   The deeper the slump and the longer it continues the broader the commercial implications are likely to be.  Of primary interest is the threat of another round of European long term gas contract price re-openers.  Over recent years, suppliers have been relatively successful in recovering concessions from producers as they have suffered the impact of spot (and hence retail) prices falling relative to their contract cost base.

Another key consideration is the impact of the global spot price slump on LNG liquefaction projects.  A number of projects without long term contract cover are feeling the squeeze on both sides.  The spot price slump is reducing their bargaining power with buyers at the same time they are trying to control project cost blowouts.  This is an issue across Australia, Canada and the US.  The Reuters team have provided some interesting background on the impact of falling spot LNG prices here as well as an illustration of the US vs UK spot price spread in Chart 3.

Chart 3: Global spot price evolution squeezing US LNG export projects

Reuters NBP price fall

Source: Reuters

All eyes in the gas market will be on how spot prices recover into this winter.  Weather will of course play an important role (just as it has done this year).  But it is worth noting that consecutive warm winters have been observed in Europe over the last decade (i.e. they can come in groups).  But just as important as the weather will be the way that large portfolio players react to the price declines and how this impacts the marginal sources of supply flexibility.  One of the interesting dynamics that can be observed over the last few months is that hub price volatility is increasing despite the price declines.  We come back to explore that dynamic in more detail next week.


Investment in UK peaking assets

The new Capacity Market may be set to turn UK generation investment on its head.  Power plant development in the UK has historically been focused on combined cycle gas turbine (CCGT) plants rather than peaking assets.  CCGT have a clear efficiency advantage over peaking plants and with 30GW of existing CCGT capacity, UK merit order competition between gas plant is fierce.  As a result it has historically been hard to build an investment case for peaking assets, except as onsite backup or for the provision of ancillary services (e.g. STOR).

But recent clarifications on the Capacity Market rules and the availability of 15 year fixed price capacity agreements have caused a sharp increase in interest in UK peaking asset development.  Peaking units are cheap and scalable relative to CCGT assets.  And unlike CCGTs, the peaker investment case does not rely on volatile wholesale energy market returns.  This means that peaking assets are able to access a more flexible range of financing structures to enhance equity returns.  These are attractive characteristics in a world awash with cheap capital looking to invest in relatively low risk infrastructure projects.

Capacity Markets favour peaking assets

On first consideration it may appear strange that policy decisions could swing plant investment economics in favour of peaking assets.  The main driver behind this is the government’s Electricity Market Reform (EMR) package.   Large scale support for intermittent renewable capacity (wind & solar) is acting to lower wholesale power prices and erode CCGT load factors and generation margins.  The Capacity Market is then intended to enable the government to ensure there is an adequate volume of flexible capacity to maintain a targeted system security standard.

The UK government has designed the Capacity Market such that the underlying product is capacity to generate electricity at four hours notice.  Capacity is de-rated based on availability by technology type (e.g. OCGT at 94% and CCGT at 88%).  There are also different lengths of capacity agreement available (1, 3 and 15 years) based on level of capex incurred, e.g. at least 250 £/kW spend is required to secure a 15 year agreement.  But the definition of ‘capacity’ for the market is quite homogenous (e.g. plant location is not considered).

A homogenous product and capex based capacity agreement lengths bring the costs of capacity provision firmly into focus for investors.  Keeping existing thermal capacity open is set to be the cheapest source of capacity (e.g. by covering plant fixed costs).  But beyond this, investors are increasingly focusing on how incremental capacity can be delivered at close to the 250 £/kW threshold required to qualify for 15 year capacity agreements.  This is where peaking assets may play a key role.  And not necessarily leading edge high efficiency gas turbine units.  Projects based around older and less efficient technology may be more attractive given lower capex costs.

This again sounds strange on first consideration.  The government is implementing EMR to decarbonise the power market, not to encourage investment in lower efficiency thermal peaking units.  But one of the key objectives of the Capacity Market is to ensure that there is enough flexible plant to backup wind and solar capacity in the (relatively few hours of the year) when the wind doesn’t blow and the sun doesn’t shine.  This means a relatively high volume of capacity is required at the back of the merit order, to run for a small number of hours a year (i.e. with a low emissions impact).  For these assets unit efficiency, emissions intensity and variable generation cost are of little relevance.   What is of primary importance is low fixed and capex costs, which are characteristics of peaking units.

windpeak

Peaking asset economics

As CCGT technology has matured over the last decade, unit costs, flexibility and efficiency rates have converged across different plants.  CCGT capex costs on an ‘all in’ basis are around 650-700 £/kW, with fixed costs of 15-20 £/kW/year.  This now buys unit efficiencies upwards of 53% on an HHV basis. And efficiency is key, because an investor in a new CCGT plant wants to displace existing CCGT plants (and over time coal plants as well).  Given higher capital costs, earning a reasonable wholesale energy margin is a key driver of CCGT investment viability.

There is a much broader range of peaking generation technology options.  For example:

  • High efficiency open cycle gas turbines (OCGT), with efficiency levels approaching those of older CCGT plants and capex costs ranging around 500 £/kW.
  • Conventional OCGT, with lower (e.g. 35-40% HHV) efficiency levels, capex costs as low as 350 £/kW and fixed costs around 10 £/kW/year.
  • Small scale diesel generators and reciprocating engines, with lower efficiency, capex below the level of conventional OCGT (e.g. down to 250 £/kW for cheaper units), and with annual fixed costs that can be very low.

A key feature of the investment case in peaking assets is that wholesale energy margin is of little concern.  There may be interesting value opportunities in the Balancing Mechanism and reserve markets.   But large volumes of higher efficiency existing CCGT and increasing renewable build mean that peaking plant load factors and energy margins are set to remain very low.  That sounds unfortunate from an investment perspective, but it has two important benefits.  It removes concerns around:

  1. Wholesale energy market margin risk that CCGT assets face.  The peaker investment case is focused on locking in capacity market margins under 15 year fixed price agreements which reduces risk from volatile and eroded spark spread margins.
  2. Incurring higher capex spend to achieve higher plant efficiency and hence lower variable costs.  If a peaking plant runs at very low load factors then variable cost is a lower priority.

Because capturing energy margin is a lower priority for peaking assets, project focus shifts to achieving low fixed and capital costs.  If a developer can build peaking capacity with a low fixed cost base and a capex cost close to the 250 £/kW threshold (e.g. on a site with existing generation infrastructure), this may form the basis for an attractive bid for a 15 year agreement in the Capacity Market, with returns supported by significant project leverage.  Come the first auction in December, this type of project may be a very competitive source of new capacity.  We will come back and explore the impact of increased peaking asset investment on wholesale energy market pricing in a subsequent article.