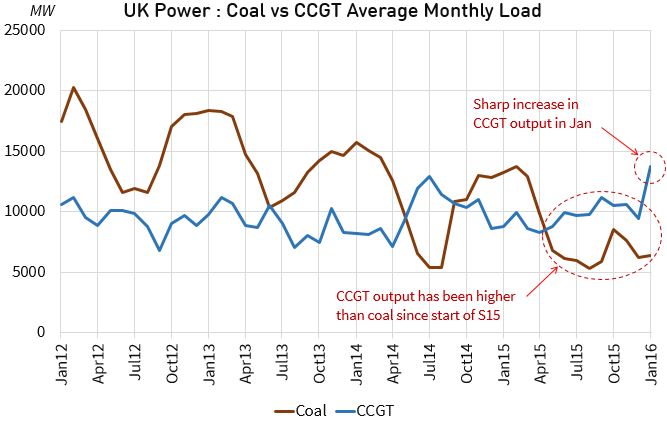
The UK government has issued fresh denials of an imminent capacity crunch this month. This has been prompted by closure announcements for another 2.5 GW of coal plant capacity (Fiddler’s Ferry & Rugeley). But behind the podium in the Whitehall corridors concerns continue to mount.
The closure of large volumes of coal and CCGT capacity mean that delivery of new baseload capacity is now inevitable. CCGTs remain largely uncontested as a source of new baseload generation. Coal is being phased out and the prospects for new nuclear are sinking under the weight of costs and delivery risk.
Any observer of UK power policy over the last decade would be familiar with the ‘when in doubt, intervene’ approach that has been the source of many of the UK’s current problems. So it is unsurprising that policy intervention to support CCGT development sits at the top of the government’s list of potential responses.
But small scale gas-fired peakers represent an under-estimated alternative to burdening the consumer with a large scale roll out of new CCGTs. In many ways gas peakers are a more sensible source of flexible backup for renewable capacity. These include:
- Relatively low capital costs (< 300 £/kW vs 550-650 £/kW for CCGT)
- Quick and easy deployment (e.g. under 12 months in mobile containers)
- Relatively emissions friendly given low load factor running (vs CCGT mid-merit/baseload running)
- Location flexibility, to help reduce transmission & distribution network costs
- Rapid response provision of ancillary & balancing services (e.g. for intermittency)
In this article we explore how gas peakers can earn a return, without needing to pass the hat around Whitehall.
Peaker investment case breakdown
The risk/return structure of a CCGT plant investment is relatively well understood (albeit a challenge in the current market). Plant margin is driven predominantly by (i) capacity revenues and (ii) wholesale market generation margin reflecting clean spark spreads.
Small scale peakers are a different animal. They benefit from much lower and more granular capex costs. But the structure of revenues is less transparent and more complex. Five key sources of revenue are summarised in Table 1 and explained below.
Table 1: 5 key sources of UK peaker revenue
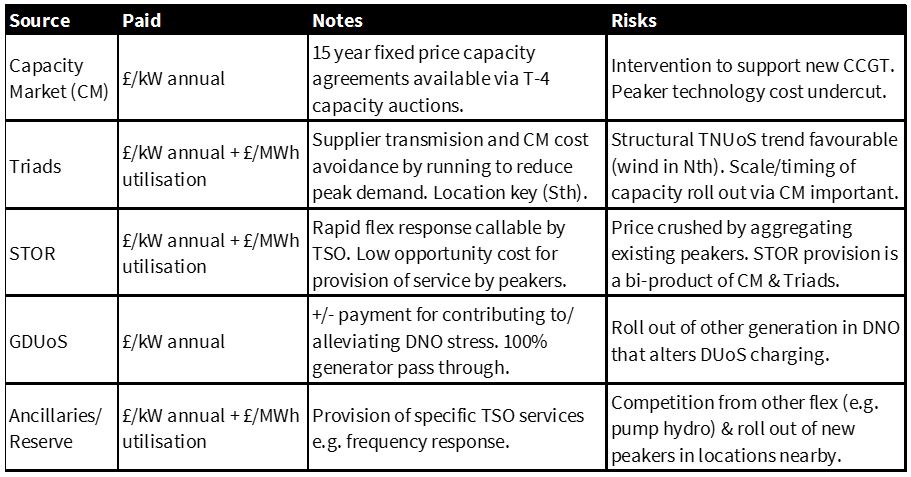
Source: Timera Energy
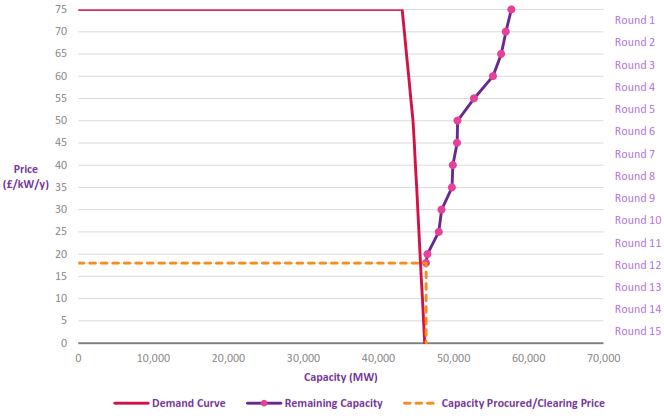
Capacity Market: The small scale peaker investment case is typically built around securing a foundation tranche of capacity revenues. A 15 year fixed price capacity agreement supports project leverage. It provides lenders with comfort around debt payback and allows for higher equity returns. Building an investment case has not been easy in the first two capacity auctions given relatively low clearing prices (< 20 £/kW). But small scale peakers benefit from being the most competitive source of new MW in a capacity market designed to favour low capex costs.
Triads: Triad periods are the mechanism National Grid (the TSO) uses to determine the apportionment of transmission costs and capacity market charges across electricity suppliers based on measured customer demand. If suppliers can run embedded (distribution connected) peakers to reduce their demand in triad periods, it reduces supplier cost burden. Around 90% of these saved costs are passed through directly to peaker owners via embedded benefit contracts.
This is a system unique to the UK. But it is one that has operated relatively smoothly since the inception of a competitive power market in the 1990s. Importantly, the roll out of renewables means that there are strong structural drivers supporting higher transmission (TNUoS) costs and therefor higher triad revenues in southern UK. This is likely to be a big driver of growth in small scale peaker development.
STOR: The Short Term Operating Reserve (STOR) mechanism has also been in place for a number of years. It is used by Grid to purchase ‘on call’ rapid flexibility response to help balance the network, particularly given growth in intermittent renewable output. Revenues were initially very attractive. But this exposed the large untapped potential of existing back-up generators (e.g. small industry, agriculture) that could provide STOR services as a bi-product of other operation. The aggregation of these generators, and ongoing development of new peakers, has reduced STOR revenue by about 70% over the last 5 years. Demand for STOR will increase over time, but so will the bi-product supply of peaker flexibility.
GDUoS: Generator Distribution Use of System (GDUoS) charges relates to costs & benefits that generators impose on the local distribution network. Charges (costs) or payments (revenues) are calculated based on generator location. Peaker developers can therefor benefit by choosing locations that maximise GDUoS revenue e.g. by reducing network bottlenecks or alleviating the requirement for reinforcements. These payments can provide a useful supplementary revenue stream. But caution is required in projecting ongoing availability of revenue as more peakers are rolled out in advantageous locations.
Ancillaries/Reserve: There are a range of additional potential revenue streams that depend on the type and location of generation capacity. These include for example ancillary services such as frequency response. Peakers also have the potential to generate some margin from utilisation payments or wholesale energy market revenue. But these are typically icing on the cake rather than a structural part of an investment case.
Peakers vs alternatives
Small scale peakers are the cheapest form of new capacity (ignoring interconnectors which are not controllable). This has already been reflected in the first two capacity auctions where developers have successfully bid to deliver capacity for under 20 £/kW.
An increase in capacity market demand (& hence clearing price) over the next few auctions seems inevitable given the UK’s capacity crunch. For example, an increase in capacity payments from 20 to 30-35 £/kW could see an explosive roll out of new peaking capacity. Emissions regulations can be altered to ensure this is gas rather than oil fired. Transmission charging can also be adjusted to level the playing field for larger OCGT peakers (and the potential conversion of coal plants to gas).
These measures do not preclude the need for new CCGT plants. But they are likely to result in a much more diversified response to the capacity, transmission and distribution network stresses that threaten the UK power market… and in a better deal for the consumer.
Article written by David Stokes & Olly Spinks