Infrastructure investors are set to feature as prominent buyers of conventional supply assets, as utilities ramp up asset sales in Europe. European utilities have traditionally had the capacity to hold power stations and midstream gas assets on balance sheet. But infrastructure and private equity funds have a much greater focus on creative financing in order to maximise return on capital.
The financing of asset purchases is set to play an increasingly important role in determining transaction structures and prices. A number of assets tagged for sale come with a significant merchant (or market) exposure. Financing of these assets will depend to a large extent on the ability of buyers to secure long term contracts.
Traditionally it has been tough to secure financing without long term (10-15 year) fixed price contracts in place to cover the majority of market risk. However the interaction between Long Term Contracts (LTCs) and financing is evolving, driven by transaction deal flow, development of new assets and the refinancing of existing assets.
Today we explore the interaction between long term contracts and financing in this our final article in a series on the long term contracting of flexible supply assets.
Contracting to facilitate project finance
There are three key counterparty types that feature in a typical conventional supply asset transaction: equity investors, lenders and capacity offtakers (via LTCs). Each of these parties has conflicting interests:
- Lenders are by nature risk averse and primarily focused on ensuring adequate cashflow to cover interest and principal repayment costs. They do not want the equity investors to default, but aside from that they have little interest in asset value upside.
- Offtakers are primarily focused on negotiating a competitive price for capacity, while contracting as much value upside in the form of asset optionality as possible. They also have a strong incentive to push availability risk onto the asset owners (given an inability to manage it).
- Equity investors: need to balance their primary goal of achieving a reasonable expected return on equity, against facilitating lenders with downside protection and managing value upside & availability risk via the structuring of offtake contracts.
LTCs facilitate asset financing via the protection they provide lenders on cashflow to debt. But contracting acts to narrow the distribution of asset earnings in order to achieve downside protection i.e. it reduces expected asset returns and limits value upside to equity. We illustrate this in Chart 1 by returning to our example of a tolling contract on a UK CCGT asset to illustrate the principles involved.
Chart 1: Illustrative annual project cashflow distribution
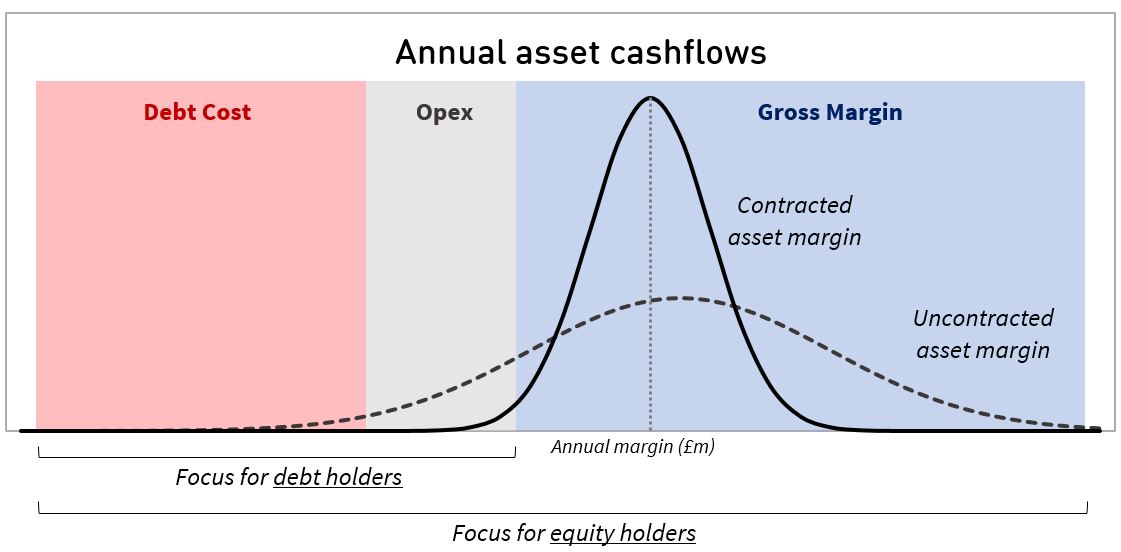
Source: Timera Energy
Chart 1 illustrates the impact of a long term offtake contract in narrowing the asset’s margin distribution. Lenders are focused on the left tail of this distribution. They want to be protected from market downside risk even in the case of more extreme outcomes i.e. lenders want to ensure that the left hand tail of the margin distribution does not extend down into the debt service zone.
As equity investors negotiate offtake terms, they are typically concerned with three important considerations relating to the margin distribution illustrated in Chart 1:
- Expected return: The level of expected asset margin above debt service and fixed costs determines the expected return for equity investors.
- Covering fixed costs: The left tail of the margin distribution determines the likelihood of equity investors suffering negative cashflows.
- Upside access: The right tail of the distribution defines upside potential, with investors being particularly interested in any asymmetric value upside that acts to skew the margin distribution to the right.
The considerations set out above are driving the evolution of financing structures in European power and gas markets.
Financing innovation to incorporate market risk
Lenders have traditionally shown a strong aversity to market risk exposure. This has driven a requirement for high levels of long term contract cover to insulate asset margins from market risk, at least until the majority of debt has been paid down. But record low interest rates and a search for yield is pushing lenders to take a more open minded approach to financing structures.
Hybrid financing structures are now being developed that allow equity investors to retain a certain level of market risk. The key to these structures is giving lenders enough security on cashflow to service debt. Table 1 below sets out a high level example of terms under this hybrid approach, versus the more traditional 100% LTC model.
Table 1: Traditional vs hybrid financing structures
| Traditional 100% contracted model |
|
||
|---|---|---|---|
| Hybrid 50% contracted model |
|
||
Source: Timera Energy
The traditional model usually requires a relatively high level of intrinsic asset margin in order for equity investors to be able to secure an adequate fixed price on a long term contract. However extrinsic value makes up an important portion of overall margin for thermal power and midstream gas assets under current market conditions. This makes the traditional financing model difficult to achieve given the haircuts incurred when contracting extrinsic margin.
The hybrid structure opens up opportunities to finance assets that have lower levels of intrinsic value. This is particularly important for thermal power stations and midstream gas assets which are suffering from cyclically depressed market conditions. The issues involved are best illustrated via some practical case studies.
UK-Continental interconnector
Let’s start with an asset that does benefit from substantial intrinsic margin. The premium of UK over Continental power prices means the owners or developers of interconnectors can sell long term capacity contracts at healthy price levels. This facilitates the traditional approach to asset financing. A base tranche of capacity can be sold to provide lenders with cashflow protection to service debt. As a result interconnector projects can be financed with a high ratio of debt to equity (gearing).
New UK CCGT assets
One of the drivers of the evolution of hybrid financing structures is the requirement for new CCGT capacity in the UK power market. With system reserve margins at historical lows there is a clear requirement for new capacity. However it is difficult to source long term (10+ year) tolling contracts in the UK to support traditional financing.
Project developers are focusing on using the 15 year capacity agreements as protection to secure financing under the hybrid approach set out above. Lenders appear to be comfortable with lending up to the level of capacity payments, but have a strong preference for further margin protection above this e.g. in the form of a shorter term toll or strong equity buffer. As a result, project debt levels are likely to be relatively low. This means that CCGT financing will depend on an equity structure that is prepared to take on the remaining market risk (above and beyond the level of any toll).
Continental CCGT
We finish with an example of an asset type that is likely to require pure equity financing under current market conditions. Given the level of CCGT generation margins on the Continent, it is very difficult to secure a tolling contract at a price that supports any debt. The other key challenge in Continental markets is an absence of the capacity price support that is available in the UK.
The exception to this logic is if an asset has legacy long term contracts in place for power, fuel or steam (e.g. CHP plant with steam and onsite offtake contracts). In this case these contract cashflows can be used to service debt.
These three case studies illustrate the financing challenges facing the buyers and developers of flexible supply assets in Europe. These are relatively simple examples in what is an ongoing process of evolution of contracting and financing structures that are more tolerant towards market risk. This evolution is being fueled by the scale of European asset sales coming to market and the new sources of capital competing to invest.
Article written by David Stokes and Olly Spinks