New CCGTs have not fared well so far in the UK capacity market. Centrica’s repowering of the Kings Lynn plant (0.4GW) has been the only successful project to date. The gravestone raised over the 2.0 GW Trafford project stands as a warning to overly enthusiastic CCGT developers, after it failed to raise capital and reneged on its 2014 capacity agreement.
But it is too early to write off new CCGTs just yet given a policy landscape shifting in their favour. Ofgem has levelled the capacity market playing field by revoking the lucrative triad benefit that has underpinned distribution connected peaker economics to date. CCGT developers are also experiencing tailwinds from improving capital access, capex costs and unit efficiencies. The recovery in forward sparkspreads over the last 12 months helps too.
There is a substantial pipeline of new CCGT project options waiting for the right capacity price. These sit across a range of developers, for example:
- Utilities (e.g. Scottish Power’s Damhead Creek 2)
- IPP generators (e.g. Drax & Eggborough coal to CCGT repowering options)
- Fund backed (Macquarie backed Calon Energy’s Willington project)
But getting the numbers to line up is not easy. Today we take a look at drivers of the investment case for new CCGTs to illustrate the challenges involved.
Margin breakdown of new CCGTs
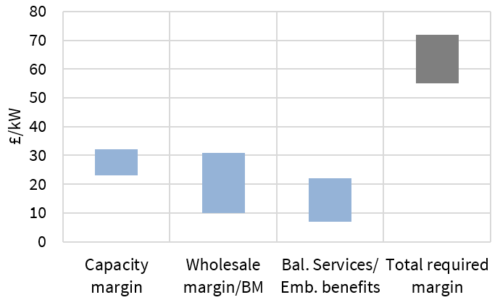
Chart 1 illustrates margin ranges for a generic new UK CCGT. The left hand column represents total asset margin required to earn a reasonable return on capital (i.e. a higher single digit unlevered IRR).
In the other chart columns we have broken margin components into three key buckets:
- Wholesale energy margin: Driven by margin capture in the wholesale energy market, a function of the evolution of clean spark spreads.
- Capacity margin: Driven by the evolution of pricing in the UK capacity market, adjusted for CCGT derating factors.
- BM & balancing services: Additional margin from bidding units into the Balancing Mechanism (BM) and providing other balancing/ancillary services.
Chart 1: Generic UK CCGT (@56% HHV) margin ranges
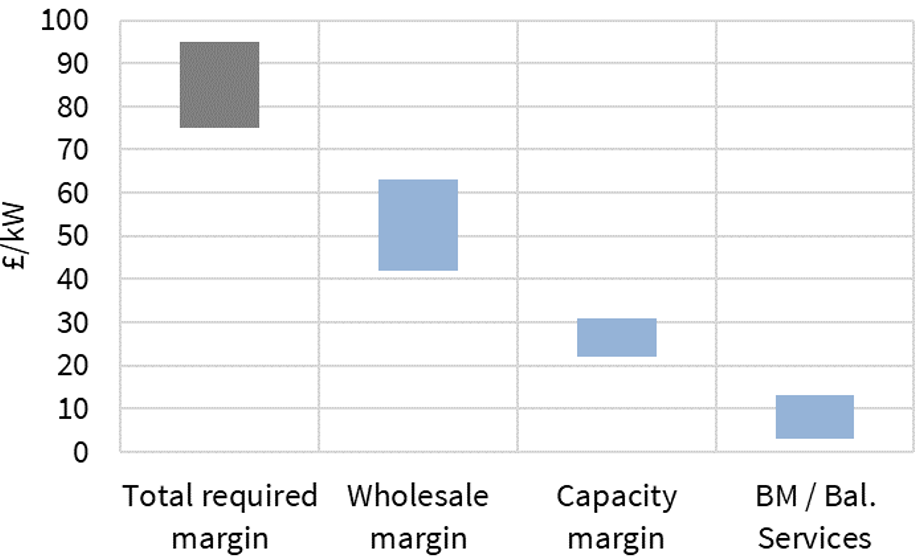
Source: Timera Energy
Wholesale margins
CCGT economics are underpinned by wholesale market margins. High unit efficiencies mean new CCGTs have a significant merit order dispatch advantage over existing coal & CCGT units, as well as gas peakers. This translates into higher load factors and the ability to earn margin rents when higher variable cost thermal units are setting wholesale market prices. This is weighed against a capex cost tradeoff, with new CCGT capex costs in the order of 550 £/kW (vs gas peaker capex of 350-400 £/kW).
The latest CCGTs (H-frame technology) are around 56% efficient (HHV). These units have a 3-10% efficiency advantage over existing CCGTs. Compare for example a 56% efficient new plant with a 52% efficient CCGT from the last wave of build in the late 2000s. The 4% efficiency advantage translates into an approximately 3 £/MWh increase in baseload clean spark spread.
The efficiency advantage of new CCGTs over OCGTs and reciprocating engines widens to 15%+. This translates into a ~15 £/MWh lower variable dispatch cost versus gas peakers.
The challenge in projecting CCGT wholesale market returns is understanding how margin and load factors erode over time. In other words, how a new CCGT asset transitions from relatively high load factors in the early 2020s to an increasing dependency on price shape and volatility by the 2030s.
The pace and scale of this transition depends strongly on evolution of the UK capacity mix and associated implications for pricing dynamics. A robust logic around capital cost recovery in the first 10 years of asset life is critical.
Capacity margin
Capacity margin is key from a financing perspective. A 15 year capacity agreement with a fixed price (indexed to inflation) acts to reduce margin risk. This is important downside protection for project equity. And it also impacts the ability of developers to raise debt financing (typically tested via a debt service coverage ratio against a downside scenario).
A significant part of the reason new CCGTs have not featured in the UK capacity market to date is capacity prices near 20 £/kW (around the level of CCGT fixed costs). Prices of 30 £/kW or higher are likely to be required to support significant volumes of new CCGT capacity development.
BM & balancing services
Margin from balancing and ancillary revenues can be a key component of peaking asset economics. But they are more like ‘icing on the cake’ for new CCGTs, at least in the first years of asset life. This is because relatively high load factor operation in the wholesale market typically constrains other revenue opportunities.
Despite the improved flexibility of new CCGTs, BM margins are typically limited to more opportunistic bidding by wholesale market operations e.g. bidding to ramp down volumes in the BM or pricing up smaller incremental volumes of additional output. Ancillary services can provide useful margin uplift, but tend to be strongly locationally dependent (e.g. higher in South West vs Northern UK).
Understanding competition, decarbonisation and downside risks
One of the biggest challenges facing a new CCGT developer is quantifying the risk/return impact of a range of credible threats. This is particularly key given the risks associated with a 20 year asset lifetime (+ 3-4 year development lead time) in a decarbonising world that is seeing rapid technology & cost innovation.
Some examples of important threats:
- Cheaper capacity from alternative sources (e.g. peakers, batteries, life extensions of existing CCGTs)
- Rapid deployment of offshore wind capacity, displacing thermal plants
- Substantial build of other new CCGTs, eroding load factors & margins
- Disruptive technology developments e.g. wide scale deployment of load-shifting batteries or technology induced changes in consumer behaviour.
Some CCGT value drivers can be complex and counterintuitive. For example:
- The ramp up of electric vehicles may erode peak price shape, but also result in significantly higher system electricity demand, providing some support for load factors of more efficient CCGTs.
- High volumes of gas peaker and short duration battery deployment may reduce the number of new CCGTs built, but at the same time increase wholesale margin rents in peak periods for those CCGTs that are developed.
Capital structure and route to market
One of the key factors bringing down the cost of new CCGT projects is the evolution of project capital structure. The traditional tolling contract model (tried by Trafford) is broken. But new sources of equity willing to bear market risk are emerging to underpin asset financing structures. This process is being helped by a strong willingness from turbine manufacturers to try and kick start a new generation of European CCGTs.
Route to market has also historically been a major hurdle for non-utility developers. Monetisation of CCGT value depends on access to sophisticated trading and optimisation expertise at a reasonable cost. The expense of developing this capability in-house has seen a growing ‘route to market’ service offering from established trading desks (e.g. Macquarie, Centrica, Gazprom Marketing & Trading). As services become more standardised, costs are also declining.
Ultimately a successful CCGT investment case is likely to be built around:
- A creative capital structure & competitive cost of capital
- An ability to quantify a robust breakdown of asset margin, recognising credible threats
- A capability to monetise that margin in the wholesale market and BM
- One or more specific value enhancing characteristics of the project
Specific project value sources are likely to be the difference between project FID and shelving. Capacity prices are unlikely to support substantial volumes of ‘generic’ CCGT projects. Instead successful projects need some competitive edge e.g. locational benefits, existing infrastructure, CHP revenue streams or short haul gas tariff benefits.
The UK government has tried to distance itself from picking winners. But it has created a policy and competitive landscape that has moved in favour of new CCGTs, despite the questionable logic of this given its emissions reduction goals. This may see several GW of new capacity developed by the mid 2020s. But the CCGT investment window is likely to be limited given the combined forces of decarbonisation and flexible technology innovation.