At the beginning of 2016 we started a tradition of publishing 5 surprises to watch out for on the radar screen. In 2016 we focused on major reversals in market prices given cyclically depressed market conditions. Our surprises included major price reversals in oil & German markets, a recovery in spark spreads and an energy credit shock.
After the market fireworks of 2016, 2017 has been a relatively calm year. But there has been no shortage of surprises along the way.
As 2017 draws to a close, we revisit the 5 potential surprises we set out in January. We also use the benefit of hindsight to look at 3 other major surprises that turned heads this year.
Revisiting our 5 surprises from Jan
As we set out in Jan, our surprises are not forecasts or predictions. They are areas where we think it is worth challenging prevailing industry consensus. A quick status check on each.
1. Macro shock – e.g. political upset, rising inflation &/or interest rates
In a sigh of relief from markets, Macron & Merkel prevailed and the Italian government limped through the year. Broad based global growth continued and there were no major macro shocks to interrupt it. However there was a step up in inflation in some European countries, e.g. UK breaching 2% target rate with Germany hovering just under 2%. Watch for a reversal in monetary stimulus in 2018 if inflation continues to rise.
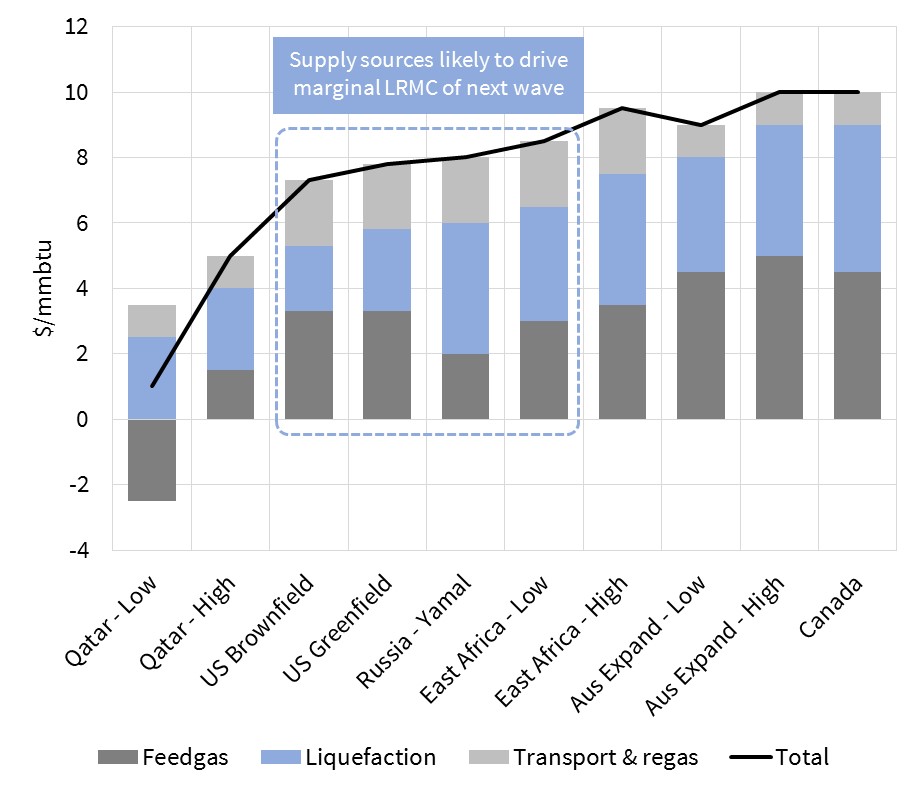
2. Asian LNG demand upside surprise
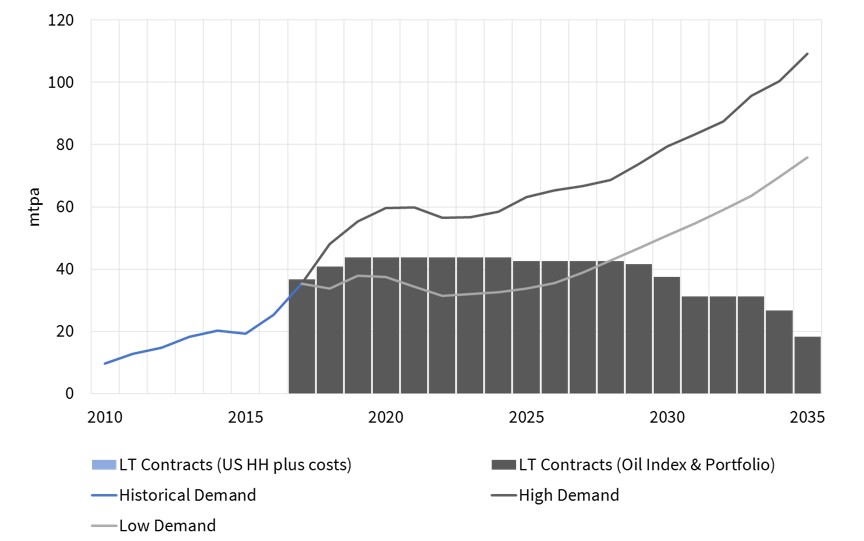
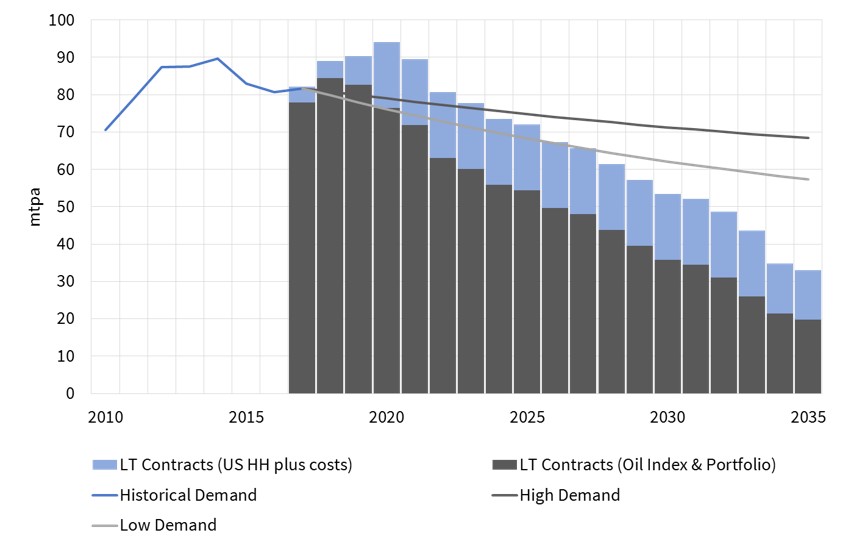
Asian LNG demand growth was definitely one of the surprises of 2017. This has underpinned a recovery in spot LNG prices in Q4 2017 to 10 $/mmbtu as Asian buyers have been competing for spot cargoes. China has played a pivotal role with LNG imports increasing 40% vs 2016 as shown in Charts 1 & 2. The surprise within China has been the effectiveness of the government’s pollution driven policy shift to gas. Despite the absence of market based mechanisms, the Chinese authorities have implemented a rapid shift to gas, focused on industry, space heating and some power-generation near key cities.
Chart 1: Historical Asian LNG Demand
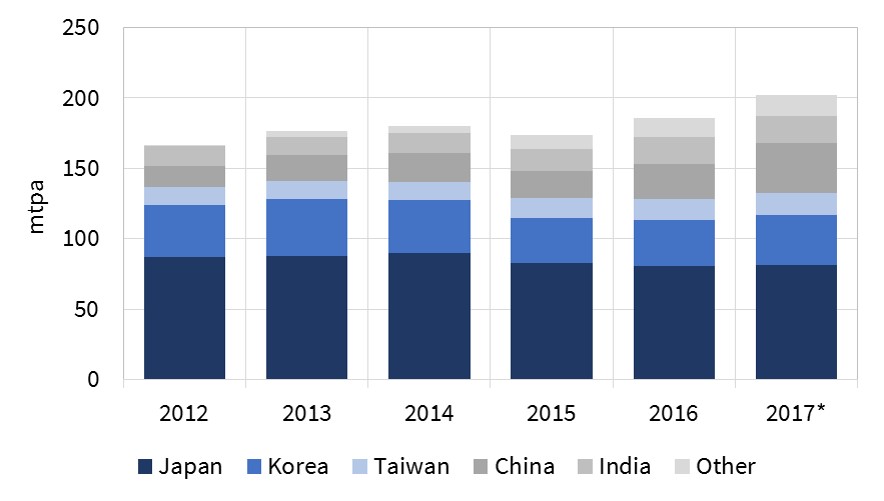
*Note: 2017 has been estimated by combining actual demand data up until the end of October with demand estimates for November and December.
Chart 2: 2016 vs 2017 Asian LNG demand
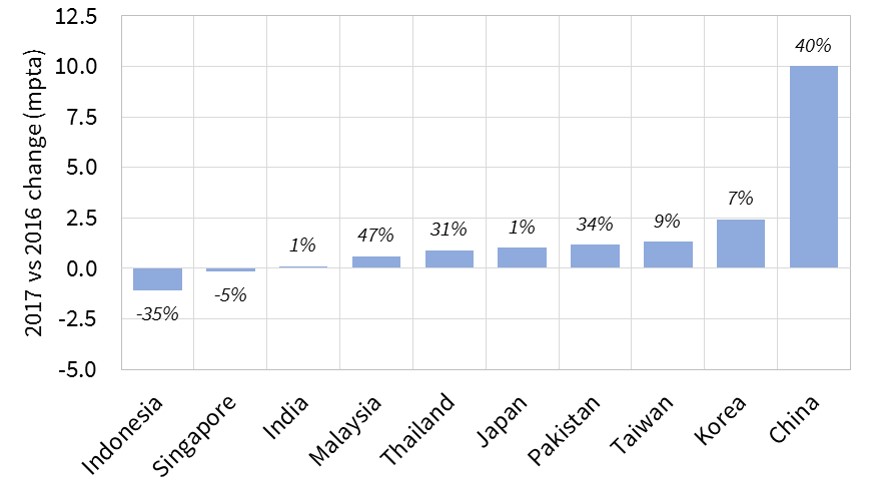
Source: Timera Energy
3. Growth in European gas & power M&A
There has been a steady pick up energy transactions activity flow in 2017. Fortum’s ongoing €8 bn bid for Uniper has featured (& may be the catalyst for further German portfolio restructuring). Utilities have also continued to sell assets e.g. Engie’s $1.5 bn upstream LNG portfolio sale to Total, DONG’s $1.3 bn oil & gas sale to INEOS and Centrica’s E&P and CCGT sales. The proposed SSE/Innogy retail merger suggests that utility restructuring is set to continue. There has also been a significant pick up in infrastructure & private equity fund competition to acquire energy assets.
4. Capacity payments becoming more widespread in Continental power markets
There was no watershed moment in 2017, but capacity price penetration continued to grow. France joined the capacity market club in Jan 2017, with capacity prices for 2017 & 2018 clearing at 9-10 €/kW. Italian capacity market plans took a step forward this year. Some issues remain with clarifying the structure and pricing of the reliability options that will underpin Italian capacity pricing. But these are likely to be resolved in 2018 to pave the way for implementation. The EU also turned up the heat on Germany to move to a more market based capacity solution, announcing a probe into its strategic reserve mechanism.
5. Jump in value of gas supply flex
The UK gas market has seen a major shift in supply flex value in 2017. The permanent closure announcement of Rough storage has seen a step change in buyer interest to acquire flexibility. Part of this is portfolio repositioning to replace Rough capacity. But there is a broader focus on accessing gas deliverability, particularly with the demand recovery driven by the power sector. The UK transition has not yet spilled over into Continental gas markets, where seasonal price spreads remain structurally weak and spot volatility is well below UK levels.
Major 2017 surprises in hindsight
As well as those above, there have been 3 other surprises that have caught our attention this year.
1. Ongoing strength in coal prices
Despite the looming reality of ‘peak coal’, prices have had a very strong year in 2017. Spot European (ARA) coal prices have consistently held above 80 $/t and look set to close the year near 95 $/t. As with spot LNG price strength, the drivers are focused on China (responsible for half of global coal demand). Chinese authorities have stuck to their policy announcements and significantly reduced the overhang of inefficient and unsafe domestic coal production. This has seen a surge in Australian coal exports & prices, with a knock-on impact in Europe.
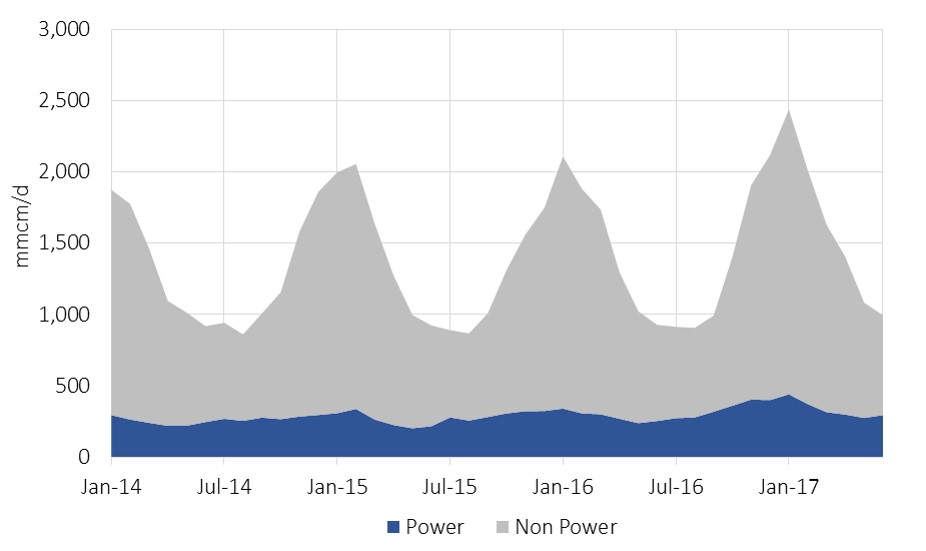
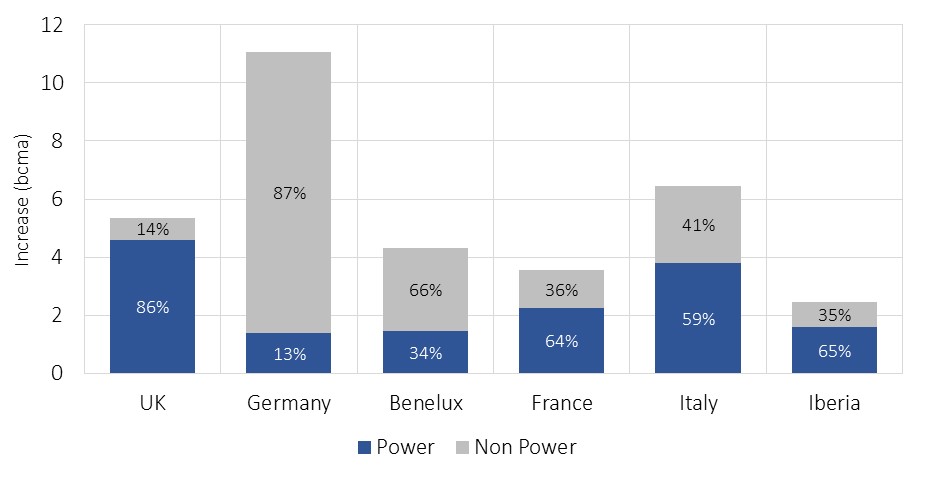
2. Strong European gas demand
European gas demand is likely to rise around 6% in 2017 after a similar strong increase in 2016. Power sector demand growth has played a pivotal role. The coal to gas switching transition that took off last year, continued to gain momentum in 2017, helped by higher coal prices. French nuclear outages in Q1 supported higher gas plant load factors. There were also unusually dry conditions on the Iberian peninsula which saw substitution of CCGTs for hydro capacity.
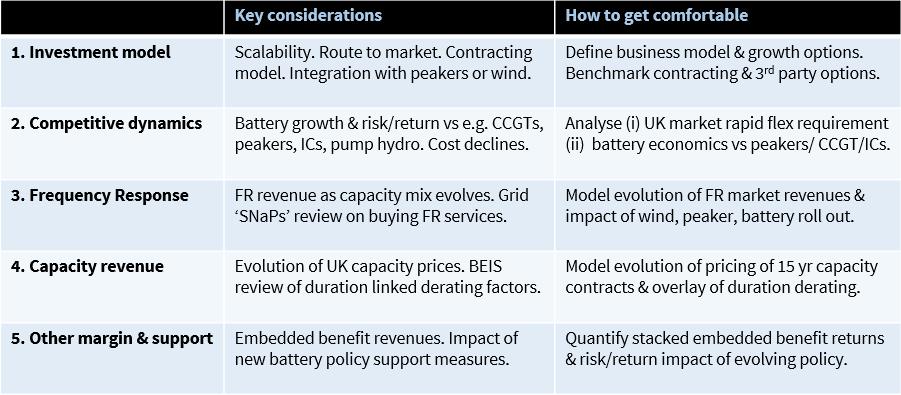
3. Renewable & battery cost declines
Wind and solar capacity costs continued to steeply decline. UK offshore wind costs in the 2017 CfD auction (58 £/MWh) were half the level of the previous auction in 2015. Solar panel costs have continued to plummet, driven by cheaper Chinese production. This was evident in the first non-subsidised UK solar farm at Flitwick (developed in combination with batteries). Battery costs have also fallen sharply with shorter duration lithium-ion batteries breaching the 200 $/kWh level. Longer duration battery costs are falling too, but are still well short of levels that support widescale commercial deployment.
These surprises set up some of the issues on our radar screen for 2018.
Timera news
The Timera team has been growing in 2017. New members include:
- Phil Robinson, previously the commercial head of UK power producer Calon Energy, who will play a key role in growing Timera’s power advisory business.
- Henry Crawford, coming from a gas trading and analytics background from Nova Energy, who is strengthening our commercial analysis expertise.
- Sonia Youd, previously commercial director of Centrica Storage Ltd, who is providing commercial subject matter expertise to support our midstream gas work.
Their experience is also feeding valuable additional insights into our blog material.
Our client base has continued to expand in 2017 with new clients including Fluxys, Interconnector UK, Sembcorp, Arcus & Stonepeak Infrastructure. Transaction work with existing clients has also been a focus this year, advising on acquisition & development of flexible power and midstream gas assets.
We launched a new blog format in August 2017, with the addition of two new columns (Angle & Snapshot) and a revamped Blog Archive. The additional content has been well received with a big jump in blog subscriptions, allowing free access to a weekly subscribers list of new content. We are also publishing blog content now via Linkedin & Twitter.
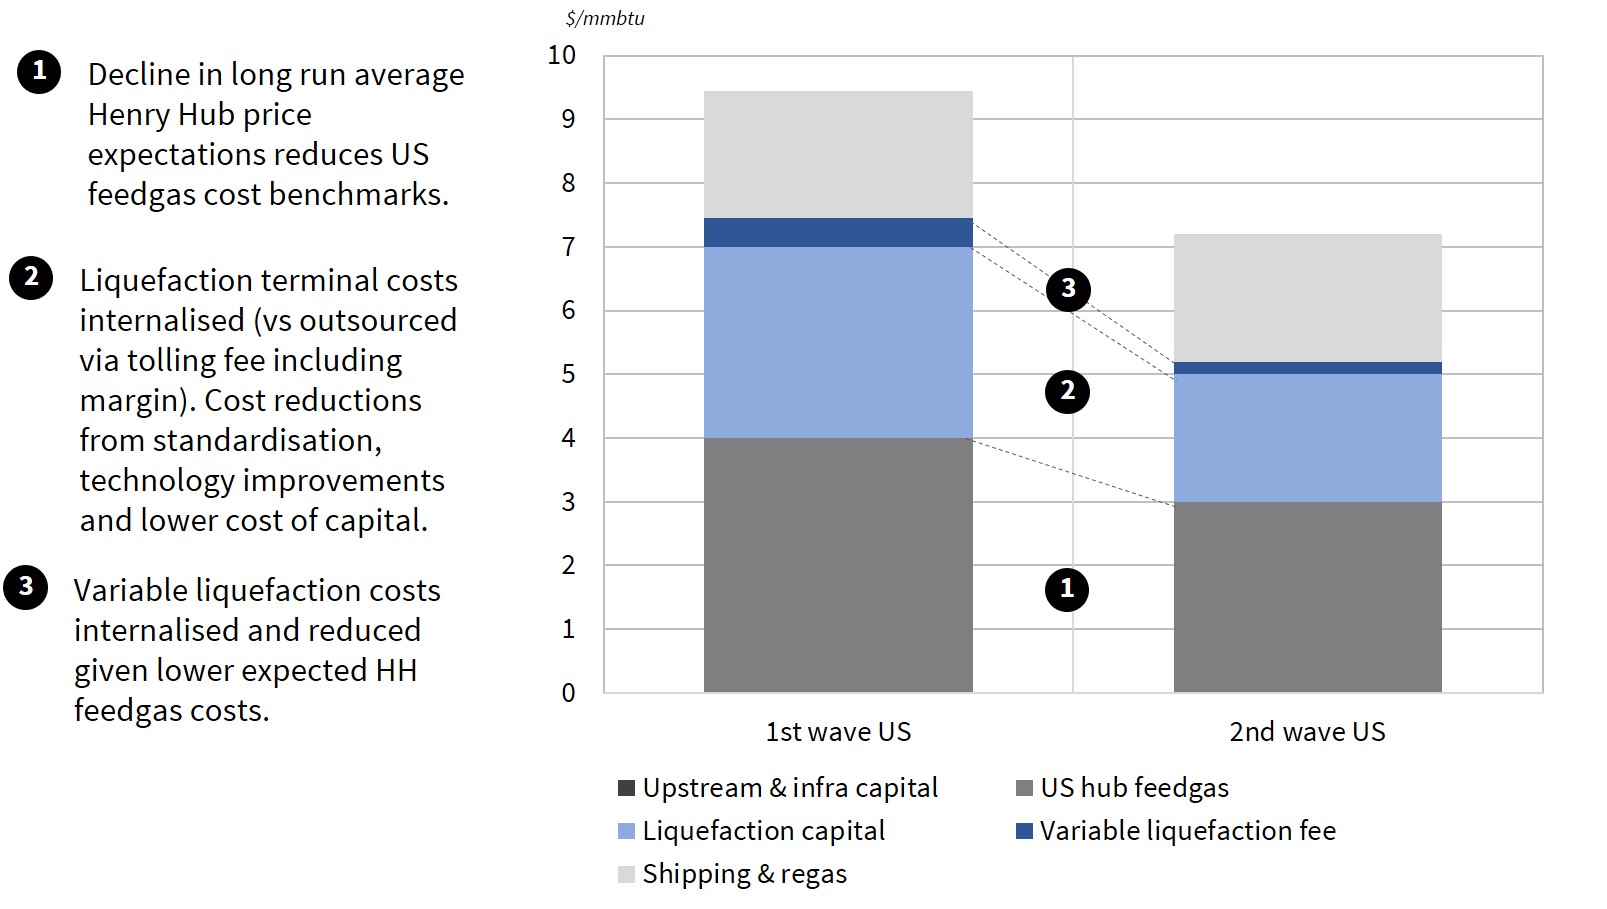
This is our last feature article for 2017. We will back in early Jan with 5 new surprises for 2018. In the meantime we will be continuing to publish material via the Angle and Snapshot columns. We have also published a briefing pack on LNG market transformation over the next 5 years (see link in blue box below).
All the best for a relaxing and enjoyable festive season.
| Briefing pack: LNG market transformation A Timera Energy briefing pack on ‘How the next 5 years will transform the LNG market’ can be downloaded here: LNG market transformation |