UK battery investment 1: business model transition

Battery storage broke through the investment viability barrier in the UK’s 2016 capacity auctions.

200MW of batteries were successful in the 2016 Enhanced Frequency Response (EFR) auction. Battery bids were so low that they caused the price for 4 year frequency response contracts to crash below the prevailing shorter term price for Firm Frequency Response (FFR), despite EFR being a faster response service.

A further 500MW of batteries gained capacity agreements in the 2016 T-4 Capacity Auction. This wasn’t just a big story in Europe, but a huge boost to the global deployment of storage as an economic source of flexible capacity.

But UK battery developers have been forced to regroup after this initial surge. The viability of the business model that underpinned 2016 success has been eroded by three factors:

  1. FFR: The sharp reduction in Firm Frequency Response (FFR) market prices as battery penetration has risen.
  2. EB: Policy intervention to reduce the level of embedded benefits (EB) for distribution connected assets.
  3. CM: Steep reductions in the de-rating factors applied to short duration batteries in the UK Capacity Market (CM).

As a result, battery developers and investors are now refocusing on generating margin from price arbitrage in the wholesale market and Balancing Mechanism (BM).

In this week’s article we explore the different business models that battery developers are adopting and look at the economics of storage investment.  In an article to follow we consider the practical challenges of value capture from wholesale price arbitrage.

Battery business models

The success of batteries in 2016 was underpinned by frequency response and capacity market returns.  Substantial reductions in these sources of income have forced developers to evolve their business models.

The current range of battery projects being developed vary widely in both scale and business model. However, business models can be broadly grouped into 4 categories:

  1. Behind the meter
  2. Distribution connected
  3. Transmission connected
  4. Hybrid

We summarise each in Table 1 below.

Table 1: Summary of four battery business models

Business Model Description
Behind the meter Batteries are being deployed behind the meter to optimise onsite load, reduce supplier charges and provide DSR services. Behind the meter deployment presents specific opportunities and challenges. Each site is typically relatively small in scale. Business models typically focus on avoiding supplier levies which requires a thorough understanding of customers load profiles and supply contract terms.

Batteries also often interact with onsite load to create value. The economics of behind the meter energy are ‘use case’ specific and hence business models tend to focus more on client engagement, onboarding and technology allowing control over multiple sites efficiently and effectively.

Distribution connected The advantages of distribution connection of batteries are driven by embedded benefits revenues (e.g. triads, GDUoS). Business models are therefor more closely aligned to those for gas engines, where opportunities for embedded benefits are driven by location and site/connection specific factors. As the opportunities for lower voltage connections are becoming increasingly competitive and as policy changes have eroded embedded benefits, the gap between transmission and distribution connected battery economics has narrowed.
Transmission connected The advantages of transmission connection lie principally in connection costs and scale economics.  Grid connection precludes access to embedded benefits. But there can be cost advantages with grid connection as well as the opportunity to generate TNUoS related revenues from location in the right locations. Scale also typically brings down project costs, particularly in relation to supporting technology and infrastructure.
Hybrid There are also several hybrid approaches being adopted where batteries are deployed in conjunction with other assets e.g. Limejump’s recent Virtual Power Plant. These include siting batteries alongside wind and solar projects, as well as integrating with gas engines and EV charging stations. The benefits of such hybridisation lie in shared infrastructure (e.g. grid connections) and different risk profiles which may tip a borderline investment case into the green.


Battery economics & margin stacking

Beyond these four basic business models, lies the question of how a battery investment can capture adequate value across different margin buckets. Solving this margin stacking problem underpins a viable investment case (as it does for gas reciprocating engines).

But the original margin stacking model adopted in 2016 has been transformed by the reductions in FFR, EB & CM margins (described above).

As a result, battery developers are transitioning to merchant business models that focus on capture of market price fluctuations in the prompt wholesale market and BM.  Chart 1 shows a breakdown of margin required to support a merchant battery project.  A merchant gas engine breakdown is shown for comparison.

Chart 1: Battery technology & economics

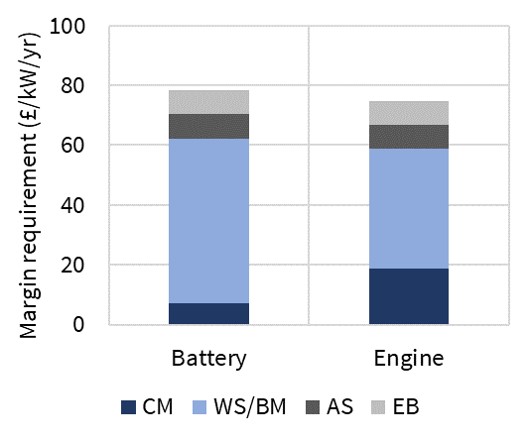
Source: Timera Energy. CM = Capacity Market. WS/BM = Wholesale/BM. AS = Ancillary Services. EB = Embedded Benefits.

Chart 1 is based on a 1 hour duration lithium-ion battery project. At the moment, the cost advantages of batteries of around 1 hour duration outweigh the revenue benefits of higher volume load shifting from longer duration batteries (e.g. 4-6 hours). This could change in the 2020s depending on the relative pace of decline in storage technology cost curves.  But for now, short duration L-ion batteries are the big player in town.

The ‘all in’ costs for short duration battery projects are in the order of 400 £/kWh (i.e. 400 £/kW for a 1 hour duration battery). That means an average annual real return of about 80 £/kW/yr is required (assuming a mid-life refresh of battery units to boost performance).

Capacity market margins for shorter duration batteries took a big hit from last year’s policy change to reduce derating factors. This means that battery investment returns are now even more focused on wholesale & BM value capture than for gas engines (typically 50+ £/kW/yr of margin required).

This brings us to the two biggest challenges that battery developers are currently facing:

  1. Quantifying a realistic level of wholesale market & BM value capture
  2. Presenting a robust view of asset risk/return profile to investors to raise capital

We come back to explore these value capture considerations in an article to follow shortly.

European gas hub linkage to the LNG market

LNG imports account for about 10% of European gas supply (~60 bcm in 2017). Remaining supply is split fairly evenly between domestic production (dominated by Norway, UK and the Netherlands) and pipeline imports (dominated by Russia).

LNG imports may seem a relatively small portion of the supply mix. But they have a disproportionate influence in setting hub prices. This is because of the flexible, price responsive nature of LNG supply into Europe.

These characteristics also mean that European LNG import volumes ebb and flow based on market prices. The benchmark price signal driving LNG flows is the spread between TTF and Asian LNG spot prices. In today’s article we look at the recent evolution of this spread and its impact on European hubs.

Europe vs Asian price spread

The grey line in Chart 1 shows the evolution of the spread between a Singapore LNG spot price marker and the front month Dutch TTF hub price (against the right hand axis).  If you prefer to think of spot prices in North Asian terms then you can add 0.5 $/mmbtu to the Singapore price as a rule of thumb.

The bars in Chart 1 show European LNG reload volumes (against the left hand axis). Reloads have a clear relationship to the price spread, particularly in 2017 & 2018, with volumes typically rising significantly with spreads above 1.50 $/mmbtu. But there are other logistical and contractual factors that can incentivise reloads at lower spreads. For example, in 2016 a number of cargoes reloaded from France related to contractual incentives to on sell volumes to Japan (despite a relatively low prevailing spot price spread).

Chart 1: Asia vs TTF front month price spread & European LNG reload volumes


Source: Timera Energy, ICIS, SGX, Spectron

There has been a pronounced seasonal profile to the Europe vs Asian price spread over the last three years. This has reflected stronger Asian demand for LNG in winter given relatively low volumes of domestic storage (particularly in China).  To attract additional winter volumes, Asian LNG spot prices rise above European hub prices, creating an incentive to re-route or reload European LNG cargoes to Asia.

Until this year, Asian spot prices had tended to re-converge with TTF over the summer months. But 2018 has seen a sharp move higher in summer price spreads given unseasonably strong Asian demand.

LNG demand in Asia was up 12% (y-o-y) in H1 2018. Demand growth was driven by China (+5 mtpa), India (+3 mtpa) and Sth Korea (+3mtpa). This demand growth trend has extended over what has been an unusually hot summer.

In addition to strong Chinese & Indian demand across summer, Japanese LNG demand (subdued in H1) has surged across July & August as heatwaves have seen air-conditioning driven demand depleting gas inventories.

So what does all this mean for European hub prices?

LNG swing one of 3 marginal hub price drivers

European hub prices are currently being set by the interaction between 3 key drivers at the margin:

  1. Power sector switching: As coal and carbon prices have risen in 2018, they are lifting gas for coal plant switching levels. This is increasing gas burn in the power sector and pulling up hub prices.
  2. LNG supply flexibility: Asian vs TTF price spread dynamics (described above) are driving the volume of LNG flowing into European hubs. Higher Asian/TTF spreads across 2018 have seen LNG supply diverted away from Europe, also helping to lift hub prices.
  3. Russian flows: The supply gap resulting from switching (1.) and LNG diversions (2.) is largely being met by Russian imports. This is via a combination of oil-indexed swing contract volumes (increasingly being managed via the TTF price window mechanism that Gazprom has conceded in a number of major supply contracts) and Gazprom’s sale of additional uncontracted volumes at European hubs.

We have explored the pricing dynamics of 1. and 3. in previous articles. Today we focus on 2.

3 price states driving LNG supply flexibility

The behaviour of LNG supply flexibility can be related to Asian/TTF spread ranges in Chart 1. There are broadly three states of this price spread as described in Table 1 below.

Table 1: 3 states driving LNG supply flexibility

State Spread range Flow dynamics
Converged 0.0 – 0.5 $/mmbtu

(grey in Chart 1)

TTF/Asian spread does not compensate for the incremental variable cost of moving LNG to Asia. As a result flexible LNG supply tends to flow to Europe, putting downward pressure on hub prices. TTF typically act as a floor for spot LNG prices given hub liquidity to absorb surplus cargoes.
Ranging 0.5 – 1.5 $/mmbtu

(blue in Chart 1)

Spreads in this range signals Asian requirement for incremental LNG supply. Flexible supply is diverted from Europe accordingly in order to balance the LNG market. Cargo reloads typically start to become viable towards the top of this spread range.
Diverged 1.5+ $/mmbtu

(red in Chart 1)

A spread blow out above ~1.5 $/mmbtu typically signals a temporary constraint in supply flexibility to service Asia. Higher prices are required to incentivise diversion of less flexible cargoes & more expensive reloads.


It should be noted that the spread ranges in Table 1 are approximate only. Flow drivers for individual cargoes can be much more complex, depending on factors such as internal portfolio costs, contractual incentives and charter rates.

Spread behaviour and arbitrage dynamics

The structural Asia vs European price divergence that characterised 2011-13 is gone. Arbitrage response from rapidly growing volumes of flexible LNG supply and liquidity ensures that spread divergence is now only a temporary phenomenon.

Think of the Asia vs TTF price spread as a rubber band attached to a heavy but movable object. The spread can temporarily stretch to respond to higher Asian demand. But there are strong market forces acting to alleviate spread divergence (or release tension from the band). Diversion of flexible LNG from Europe puts upward pressure on TTF and downward pressure on the Asian spot price.

Fluctuations in the Asia/TTF spread are set to remain, particularly if Asian demand strength continues. Spread volatility reflects inherent constraints or inertia in the LNG supply chain to respond to market price signals.

The influence of these LNG price moves on European hub prices is set to grow over the next 3 years. This is a natural consequence of a steep rise in flexible LNG supply volumes (particularly from US exports). This makes the Asia/TTF price spread an increasingly important barometer to watch in Europe.


European emissions: Germany in focus

European carbon emissions have declined 10% over the last decade, mainly driven by a reduction in power plant emissions. Renewables have led policy efforts to decarbonise the European power sector. But renewable deployment has not been the primary factor driving national emissions performance.

Germany has led the renewables investment charge. The renewable share of German generation output has increased from 15% to 33% across the last decade, a huge rise given the scale of capacity roll out required. Yet Germany is one of Europe’s worst performing countries when it comes to emissions reductions, with only a 5% decline (2008-17).

The best performing country from an emissions reduction perspective is the UK, with a 29% drop across the last decade. The UK has had steady (if somewhat wayward) policy support for renewables. But this has not been the primary driver of emissions reductions. The heavy lifting has been done by the UK carbon price floor, which has effectively driven coal out of the generation mix.

Germany’s poor emissions performance is about to make its mark. Domestic and international pressure to address emissions is driving a shift in Germany policy focus. This will have important implications for the German power market and knock-on effects across neighbouring power markets.

European emissions in numbers

Chart 1 shows the emissions performance of a grouping of Europe’s major countries and regions over the last decade.

Chart 1: European carbon emissions % change (2008 vs 2017)

Source: Timera Energy, BP statistical review

Although Turkey sits within European borders, it has characteristics that are more consistent with emerging economies. Turkey’s increase in emissions has been driven by rapid economic growth, fuelled predominantly by coal.

Turkey aside, it is Germany’s poor emissions performance that stands out. This has become the source of much public debate within German borders and abroad.

Germany in focus

Germany is heading towards a big miss of its 2020 emissions target. This is forcing the new German government to confront emissions policy.

A recently published German Climate Projection Report estimates that Germany will only achieve a 32% reduction by 2020 (vs 1990 levels), compared to the 40% target. The Agora Energiewende think tank suggests the reduction could be as low as 30%.

That would represent a humiliating 25% shortfall against Germany’s headline climate change target.

Germany’s emissions problems do not just relate to the power sector. Increasing economic growth & immigration related population growth are causing higher emissions across all sectors. Emissions in the German transport sector have been particularly poor due to the slow roll out of lower emissions vehicles.

However, as we pointed out in our previous article on global emissions performance, it is the power sector that will do the heavy lifting if Germany’s emissions performance is to improve.

German power sector: what has gone wrong?

Germany’s power sector challenge is illustrated in Chart 2.

Chart 2: Gross German power generation by source (2008-17)

Source: Timera, AG Energiebilanzen

Almost 60% of emissions reductions from renewables deployment have been offset by the closure of nuclear power plants across the last decade.

At the same time lignite output has increased as new plants have been built, despite lignite’s very high emissions intensity. Hard coal output was also relatively steady across the last decade, excluding the dip in 2017 which related to coal to gas switching given higher coal prices.

In summary, Germany’s renewable efforts have been undermined by closing nuclear plants and doing nothing to reduce net coal emissions.

It is likely that it is politically ‘too late’ to reverse Germany’s nuclear closure program. That is set to magnify the focus on coal plant closures into next decade.

The resilience of coal to date, reflects the strength of local political support for coal in some parts of Germany.  But the emissions target miss is setting up a showdown between Germany’s emissions agenda and its coal lobby.

The German coal plant policy challenge  

Germany does not face an easy challenge to get its emissions performance back on track. But the quickest solution (short of halting nuclear closures) is to close older hard coal & lignite power plants.

The impact of closures is clearly quantifiable. Germany is also already in the process of defining an implementation plan for coal plant compliance with the Industrial Emissions Directive (IED) requirements. Although this is focused on NOx emissions, it provides a powerful policy lever via which to close coal & lignite.

A new German coal commission was launched in June to develop a plan. The commission is anticipated to revert with a set of recommendations before the COP24 Poland climate summit in Dec 18.

Whether it is via this process or subsequent ones, Germany’s coal & lignite plants risk facing accelerated closures. From an emissions perspective they are the low hanging fruit. But closing coal at the same time as nuclear will be challenging from a security of supply perspective.

Knock-on impact of German coal closures

We finish by setting out 5 key implications of German coal closures for European power markets:

  1. Capacity rebalancing: Closing coal and nuclear plants at the same time across the early 2020s will sharply tighten the German capacity balance. This will drive a rebalancing of NW European capacity, particularly given coal & nuclear closures in other markets.
  2. Energy squeeze: Dual coal & nuke closures creates the risk of a significant wholesale ‘energy’ squeeze in NW Europe in the mid to late 2020s. It will be very difficult for a combination of renewables & storage to keep pace.
  3. Flex deficit: Germany by nature of these closures will become more import dependent for both energy and flex. There is a risk that neighbouring markets will also increase their import dependency at the same time
  4. Price setting: Gas will quickly displace coal as the dominant source of marginal power price setting by the early 2020s. That will act to reduce power price differentials across Europe.
  5. Gas market impact: German thermal closures are supportive of European gas demand, given relatively high volumes of underutilised gas-fired capacity. This is set to have a knock-on impact on demand for gas supply flexibility e.g. from gas storage, pipeline & LNG regas infrastructure.

When Germany sneezes, the European power market catches a cold.

Global emissions: running to stand still

Decarbonisation has rapidly become one of the driving forces of energy market evolution across the last decade. It is shaping the energy policy landscape, propelling rapid evolution of new technologies and spurring vast investment in new infrastructure.

Yet at an aggregate global level there has been no decarbonisation. Global carbon emissions have risen 10% (3.1 billion tonnes) over the last decade (2008-17). After stabilising for three years (2014-16), global emissions stepped higher again in 2017 (rising 426 Mt).

The COP21 Paris agreement laid out a broadly adopted plan to address decarbonisation, with a view to containing global warming. The current trajectories of policy and technology do not look close to being consistent with achieving the sub 2 degree target.

The lack of results to date is unlikely to erode the decarbonisation agenda. Instead it increases the probability of accelerated action over the next decade. That action will likely have a magnified impact on the power sector, and in turn shape the evolution of global gas markets.

In today’s article we take a step back to try and better understand the potential impact of decarbonisation. Specifically we look at the evolution of:

  1. Global carbon emissions over last decade (broken down by regions)
  2. Generation fuel transition across the global power sector.

Global emissions in numbers

We start with the emissions evidence. Chart 1 shows the trajectory of aggregate global carbon emissions over the last decade. Chart 2 shows the breakdown of emissions across a grouping of 4 major regions.

Chart 1: Global carbon emissions

Chart 2: Global emissions grouped by region


Source: BP Statistical Review 2018

The 10% increase in global emissions across the last decade does not follow a steady path. There are some interesting drivers that influence this:

  • GDP growth is important, given it is fuelled by rising energy consumption e.g.
    • the 2009 dip is driven by the financial crisis (particularly its impact on Nth America & Europe)
    • synchronised global growth has supported rising emissions in 2016-17.
  • Asia is the primary force driving the shape/growth of the global emissions trajectory. The huge emerging economies of China and India are key (although a significant portion of these emissions relate to manufacturing exports to Europe and North America).
  • Coal usage is also important, particularly since it is the dominant fuel for power generation in emerging economies as well as the key fuel source for new generation capacity (e.g. the 2011-13 growth in Indian & Chinese coal plant capacity).

In contrast to rising emissions from emerging countries, emissions have declined across the more developed European and North American economies.

European carbon emissions have fallen by 10% across the last decade driven by lower levels of economics growth, gradual power sector decarbonisation and some improvements in industrial emissions. North American carbon emissions have fallen 8%, largely the result of the shale revolution driving down gas prices and eroding coal generator load factors.

The problem at a global level is that these modest reductions in Europe and North America are being overrun by much faster emissions growth from emerging economies in Asia (+26%) and ‘Other’ regions (+21%, predominantly Latin America).

Decarbonisation momentum

The COP21 Paris roadmap stops short of being a cohesive policy implementation plan to drive global decarbonisation. The policy response across signatory countries has been somewhat sluggish and disjointed, not helped by Trump’s attempts to stall progress.

Yet COP21 has marked a shift in the balance of global political and business wills in favour of decarbonisation. This transition is being supported by market price signals e.g. declining cost of capital for renewables, rising cost of financing coal and the substantial increase in climate change related insurance premiums.

Companies across the US, Europe and Asia smell huge profit opportunities from growth in decarbonisation driven investments such as renewables, CHP, storage, EVs, SMR nukes, smarter appliances & enabling software. Capital markets do too.

5 conclusions on decarbonisation & power sector evolution

The power sector is at the frontier of global decarbonisation efforts. From a technical and cost perspective, power is easier to decarbonise than heat, transport & industry. The sharp impact of market price signals on generation shares can facilitate rapid adjustments (e.g. US shale, UK coal). Power sector decarbonisation also sets up the electrification of other sectors (specifically transport & heat).

Chart 3 shows an interesting analysis of the evolution of generation shares across the global power sector, using data from BP’s latest Statistical Review.

Chart 3: Global electricity generation by fuel share

Source: BP Statistical Review 2018

Drawing on this chart, we believe there are five key conclusions that can shape a pragmatic approach to decarbonisation over the next decade.

  1. Close coal plants – Coal represents the highest share of global generation (38%). It also has the highest carbon intensity (aside from some forms of oil, already in rapid decline). Yet coal’s share of the global generation mix is unchanged over the past 10 years. Closing coal not nuclear should be the global policy focus.
  2. Retain & replace nuclear – The declining share of nuclear across the last decade is driven by post Fukushima reactor closures in Japan and Europe. This has offset much of the carbon impact of renewables. Yet closures look set to continue across next decade. It is much easier to keep existing baseload low carbon capacity than to try and replace it. Extending reactor lives may also bridge the gap to safer and more scalable Small Modular Reactor (SMR) technology from the 2030s.
  3. Accept gas transition – Fighting gas at the same time as coal (& nuclear) is counterproductive. A meaningful switch from coal to gas generation in emerging economies over the next decade, particularly in China and India, buys time for renewable & new nuclear roll out and broader technology innovation. Local pollution problems may be as big a driver of the switch to gas as decarbonisation. Gas leaves a second phase carbon problem mid-century, but it is not insurmountable.
  4. Engage demand – Huge untapped sources of demand side efficiency and flexibility have the potential to substantially reduce the problem of emissions from electricity supply. Part of this depends on rapidly evolving smarter technologies & software. But the largest constraint is regulatory reform to enable & incentivise greater efficiency & participation (e.g. via developing market structures & price signals). This is key to supporting incremental demand growth from electrification of the transport & heat sectors.
  5. Accelerate renewables – Renewables have risen to 8.4% of the global generation mix in 2017, with an accelerating growth rate. Technologies are improving (including storage as a compliment to intermittent renewables), costs are falling and capital is flooding in. ‘Stand alone’ renewable investment may further accelerate growth in the 2020s. But renewables are not enough to be the primary driving force behind global decarbonisation. As a result, expect a policy shift to focus on 1. 2. 3. & 4. in parallel.

In summary, the decarbonisation engine is relying too much on one cylinder… renewables. Watch out for a transition to other cylinders sharing more of the load across the next decade. This will have an important impact in shaping the evolution of both power and gas markets.

This is our last article before the summer break. We will return in mid-August to look at the evolution of carbon emissions in Europe and the implications for European power markets. In the meantime we wish you a sunny and relaxing summer.

How FSRU’s are impacting LNG market evolution

Floating Storage and Regasification Units (FSRU) combine the key elements of an LNG vessel and regas terminal in a single unit. This can significantly reduce the capex costs and lead times for connecting LNG to new markets or access points. It also adds commercial flexibility that is increasing in value as the LNG market evolves.

The emergence of FSRU

The FSRU business started relatively recently in 2001 when El Paso contracted with Excelerate Energy to build the first such vessel for the Gulf Gateway project.   FSRUs are closely related to standard LNG vessels.  But they have additional equipment to regasify the cargo and send it out onto customer or gas networks.

For several years FSRUs remained a relatively niche opportunity.  But more recently there has been a significant pick up in deployment of the technology as costs and capability have been optimised and FSRU units are being used to access new markets.

FSRU fleet size

The global FSRU fleet currently consists of approximately 30 vessels. In addition there is an order book of 6 vessels to be delivered by 2020, with options on another 10.

The first FSRUs were based on nominal 130,000 m3 LNG tankers with send out rates of 2-3 mtpa.  However the more recent vessels are larger – typically 173,000 m3 with send out rates up to 6 mtpa. The FSRUs currently under construction provide the same full processing capability as land based terminals including full boil-off gas management facilities using recondensers.

The three key reasons supporting investment in FSRUs are summarised in Table 1.

Table 1: 3 Key FSRU advantages

Advantage Investment drivers
Lower capital cost
  • The cost of a new FSRU can typically represent only 50-60% of an onshore terminal.
  • An onshore 3 mtpa terminal with one 180,000 m3 storage tank is likely to cost $700-800m, compared to $400-500m for a similar capacity FSRU.
  • However lower capex needs to be set against higher opex of FSRU (depending on charter rates).
  • Opex can be between 0.4-0.7 $/mmbtu dependent on commercial terms & load factor.
Shorter lead time
  • FSRUs can be delivered in half the time of an onshore terminal.
  • Lead time is typically driven by construction of onshore infrastructure (not development of the FSRU unit).
  • A new FSRU unit takes around 2.5-3 years to contract and a conversion of a conventional LNG vessel around 1.5 years.
  • But lead times can be accelerated by utilising/moving existing FSRU units e.g. the second Egypt FSRU was completed in just 5 months.
Greater flexibility
  • FSRU can be used as either a floating regas terminal (with storage), a floating storage unit or as a conventional LNG vessel.
  • This additional optionality can add significant value given the right market conditions.
  • FSRU can provide an early gas option prior to a decision to build a permanent onshore terminal
  • There is also an ability to ‘retire’ (& re-use) FSRU infrastructure at relatively low cost which reduces risk around stranded regas assets (4 have been retired to date)
  • Combined FSRU/power combinations (FSRU tethered to a barge with gas-fired generators) are gaining traction in emerging markets
  • FSRU physical flexibility translates into greater commercial flex for operators (e.g. ability to redeploy).

Source: Timera Energy

In addition to FSRUs there are currently 4 floating storage vessels (FSUs) in operation, one in Malta and 2 in Malaysia. All are converted LNG tankers. There is also a small-scale FSU operating in Bali. A further FSU is currently being constructed for Bahrain LNG.

LNG market impact

The main impact of FSRU technology on LNG market evolution is to provide quicker and more flexible access to new sources of demand.

Markets that currently rely on FSRUs to import LNG include Colombia, Pakistan and Egypt. Bangladesh (4 mtpa) and Bahrain (6 mtpa) are currently developing facilities due online in 2018-19.

Potential future locations are focused on emerging markets or locations more isolated from other gas infrastructure.  These include Hawaii, Caribbean, additional Indonesian & Malaysian archipelago markets, Sth Africa, Kenya, Vietnam, Phillipines, Croatia, Myanmar and developing African coastal states.

FSRUs are also supporting the evolution of commercial flexibility in the LNG market.  Commodity traders are targeting FSRU projects because of their flexibility and optionality.  Trafigura and Gunvor are developing projects in Pakistan and Bangladesh.  Vitol is looking to partner with Total to do a further Pakistani project.

This interest reflects the capability of FSRUs to be a significant source of growth in supply chain flexibility.

Timera is recruiting power analysts
We are looking for a Senior Power Analyst and a Power Analyst with strong industry experience. Very competitive & flexible packages. Further details at Working with Timera.


Renewables can plug the French capacity gap

We recently considered Belgium’s challenges in replacing thermal capacity with renewables.  The conclusion: the viability of this approach is risky at best, particularly given current Belgian policy mechanisms.

Today we shift our focus to the much larger French power market. In contrast to Belgium, France is in a strong position to replace retiring thermal capacity with renewables.  Existing flexibility and high volumes of interconnection support the viability of this solution.

But there is one big caveat: this approach relies on France maintaining a relatively steady nuclear share.

In this article we consider the role of French nuclear, the mechanics of the power market and how France’s capacity mix is likely to evolve over the next decade.

France is heavily invested in nuclear energy

The dominance of nuclear power in the French capacity mix is unique.  France ramped up a vast state nuclear investment program after the 70’s oil shocks, building more than 60GW of capacity between 1977 and 2000.  This was specifically aimed at ensuring competitive and reliable energy and insulating the French economy from a dependence on imported fuels.

French politicians have recently flirted with the idea of reducing nuclear dependence. One of President Macron’s 2017 campaign pledges was to reduce nuclear’s share to 50% of generation output by 2025 (from more than 75% today).  But it took his government just 5 months to release the implications of such a promise for emissions, security of supply and electricity prices, before beating a rapid retreat.

French nuclear closure aspirations have not disappeared.  But targets are likely to remain loose and beyond an actionable policy horizon.  In other words, the policy importance of emissions reduction, security of supply and industrial competitiveness trumps nuclear closures.

The potential threat to this logic is a systemic safety issue with the nuclear fleet.  For example, safety issues resulting in temporary reactor closures in 2016-17 related to components manufactured in the same forge.

While nuclear safety is an unpredictable factor, the French state (85% owner of EDF and 90% owner of Areva) is heavily invested in preserving a nuclear future. In the analysis we set out below we work on the basis that a steady nuclear share can be maintained.  The alternative would almost certainly involve large scale deployment of new gas-fired capacity.

The French power market in a nutshell

At a simple level the France’s capacity mix can be cut into three slices that shape market operation:

  1. Nuclear: low variable cost, baseload and the cornerstone of production, typically accounting for 75-80% of generation output.
  2. Renewables: dominated by hydro (including substantial reservoir storage flex), with relatively low but growing volumes of intermittent wind and solar output.
  3. Thermal flex: dominated by a fleet of CCGTs and gas & oil peaking plant which typically run at relatively low load factors but are important for security of supply.

Chart 1 shows a de-rated view of the current French capacity mix as well as an illustrative scenario for its evolution to 2030.

Chart 1: French capacity mix scenario (derated capacity)

Source: Timera Energy

The key mechanics of the current operation of the French power market are as follows:

  • A significant surplus of generation capacity (~125GW) over peak demand (88GW).
  • Strong structural export flows (40-60TWh a year) across IT, CH, UK, DE, BE & ES.
  • A dominance of nuclear & hydro generation resulting in:
    • low system carbon emissions
    • large volumes of low variable cost output.
  • Marginal price setting dominated by thermal capacity and cross border flows:
    • gas typically drives price setting in winter/peaks
    • German coal driven border pricing has a stronger influence in summer/offpeaks.
  • Flexibility from reservoir hydro, CCGTs, peakers and cross border capacity facilitates system balancing.
  • Flexibility requirements are currently driven more by load swings (given high penetration of electric space heating) than by renewable intermittency.

Over the next decade, the evolution of the French market is likely to be driven by decline in the thermal tranche of the capacity mix, offset by steady growth in the renewables tranche.  In other words replacement of coal, oil and gas capacity with wind, solar and storage. This is not only already in motion, it also appears to be the path of least political resistance.

France’s capacity replacement challenge

As with all European power markets, France’s thermal power fleet is ageing. Coal plant closure has been accelerated under Macron with a complete coal exit (~3GW) targeted now for 2021. Emissions regulations will see oil-fired peaking capacity (~1GW) exiting in a similar time frame.

The retirement profile of gas-fired plants is less certain. 2017 implementation of a capacity market (clearing prices around 10 €/kW) is supportive of plant economics.  But CCGTs typically face major life extension capex around 25 years of age and there is not currently a clear price signal to facilitate this. It is reasonable to assume that France could lose 3-5 GW of gas capacity over the next decade.

Chart 2 sets out an illustrative scenario for replacement of this retiring capacity.  In contrast to Chart 1, capacity volumes are shown in nominal rather than derated terms (to allow a cleaner view of renewable roll out).

Chart 2: Cumulative French capacity replacement scenario (nominal capacity)

Source: Timera Energy

Development of new nuclear plants is back to the drawing board after the problems with the Flamanville plant (which EDF hope will be commissioned by early 2019). But we think it is reasonable to assume the modest ramp up of a ‘new wave’ of reactors from the later 2020s, allowing the older current generation of plants to retire.  If we are wrong on timing here then we expect life extensions to be managed in a way that prevents any major discontinuity in nuclear output. On a net basis we assume a gradual decline in nuclear capacity (i.e. retirements outweigh new build).

This sets up a key role for roll out of renewable capacity. In our illustrative scenario we assume by 2030 the addition of 18GW of onshore wind, 4GW offshore wind and 30GW of solar.  Under Macron, policies are falling into place to support this roll out (e.g. wind & solar capacity auctions). French energy giants EDF and Total have also both announced aggressive targets for solar capacity deployment.

That leaves the flexibility problem.  Incremental gas capacity is likely to be required through the 2020s, but in relatively low volumes (3-5GW) and with a shifting focus towards distribution connected engines.  Storage is likely to play a key role, skewed towards the later 2020s (we assume 5GW by 2030).

France also has strong potential to more efficiently manage its demand side (e.g. via smarter appliances & space heating management) to reduce peak load requirements over time.  But despite this, peak/off-peak price shape is set to increase over time. This is a function of wind and solar output pulling down offpeak prices while high variable cost peaking capacity (engines, batteries & DSR) supports peak prices.

The ultimate security of supply backstop for France is its high volume of cross border capacity (~20GW by 2020). But this may turn out to be a dangerous insurance policy (as Winter 2016-17 illustrated). France’s largest neighbour, Germany, is banking heavily on imported flexibility and there may not be enough to go round in times of system stress.  In an article to follow we will look at the much more challenging problems facing the German power market in replacing thermal capacity.

Timera is recruiting power analysts
We are looking for a Senior Power Analyst and a Power Analyst with strong industry experience. Very competitive & flexible packages. Further details at Working with Timera.


LNG supply next wave: the challengers

We set out the prospects of the ‘Top 5’ LNG producers club last week. Amongst these, Qatar is the only ‘sure bet’ contributor to the next wave of LNG supply (2023-2030).  The other members of the Top 5 have substantial gas reserves, but all could face major cost hurdles in bringing these to market.

This opens the door to competitive challengers from a group of ‘second tier’ LNG producing nations.  These challengers are not merely also rans.  Advantaged liquefaction projects from within this group will almost certainly displace some projects from the top 5 producers.

In today’s article we take a look at several of the less well known producing nations that may contribute to the next wave of LNG supply in the 2020s.   These are considered in alphabetical order rather than ranked, with an illustrative scenario for volume growth shown in Chart 1.

Chart 1: Illustrative scenario for next wave supply from non Top 5 producers

Source: Timera Energy

Equatorial Guinea

Equatorial Guinea has been on the verge of breaking into the LNG producers club for the last two years with the Ophir LNG project (Fortuna).

But in 2018, this project has hit difficult waters in finalising financing arrangements. Nic Cooper, the CEO has resigned, and the company has received a government ultimatum that it will lose its licence if it can’t achieve Final Investment Decision (FID).

As a result of these challenges, it looks like Ophir has slipped to a 50:50 prospect for commissioning in the mid-2020s prospect.

Indonesia

Indonesia is already member of the producers’ club with the Tangguh Train 3 project expected to start in mid 2020.

The most developed of Indonesia’s other prospects is the Abadi/Masala project (Inpex & Shell).  This is now an onshore liquefaction project with 9.5 mtpa capacity.  FID looks possible in 2019-20, which would set up commissioning in 2024-25.

Mauritania/Senegal

BP and Kosmos hope to take FID in late 2018 for an initial floating LNG facility of 2.5 mtpa capacity. This project is split 50:50 between Mauritania and Senegal.  Production is expected to commence 2022. It is reasonable to assume a second phase of 2.5 mtpa by 2025.

Mozambique

Mozambique has been one of the big African LNG growth hopes in the 2020s. Many substantial offshore gas discoveries have been made, but a lack of government experience in dealing with large upstream projects has slowed the pace of projects towards FID.

The leader of the pack has been the Coral South floating LNG project (ENI Operated, 3.4 mtpa).  This achieved FID (mid 2017) with production expected in 2022.

There are also some other promising next wave candidates, the most prominent of which are:

  • An Anadarko project which received government approval in March 2018. This would entail two liquefaction trains with a total of 12.88 mtpa capacity. Contract sales for the first train are advancing – suggesting FID in early 2019 and production in 2024.  A second train may follow (e.g. online in 2025).
  • An Exxon-led project is also advancing and could take FID in 2018-19. Details have not yet been announced but our best guess is a 6 mtpa train online in the mid 2020s.

The scale of Mozambique gas reserves would definitely support additional projects in the late 2020s/early 2030s if costs prove competitive.

Nigeria

Nigeria is a long established LNG producing nation. After a lengthy hiatus for investment in liquefaction, momentum appears to be building for NLNG Train 7.  This would be a 8.5 mtpa train.  Given the propensity for delay in Nigeria we think a conservative assumption of an FID in 2020 with start-up in 2025 is reasonable.

No further specific LNG export projects have been announced yet, but reserves support the possibility of further trains in the late 2020s/early 2030s.

Papua New Guinea

The Exxon operated PNG plant has been a success (aside from a temporary earthquake related stop earlier this year). Commissioning went smoothly and the plant has frequently operated above nameplate capacity.

Expectations are now building around an expansion of 8 mtpa, likely to reach FID in 2019 and come onstream by 2025.

Tanzania

Tanzania was considered another strong East African prospect several years ago given large scale gas discoveries.  But progress towards monetising these has been slow given a number of regulatory challenges.

The first LNG project (which we assume is notionally a 5 mtpa train) has been delayed due to lack of decisive government decision making and challenging economics. As a result FID looks to be 5 years away, suggesting commissioning in the second half of next decade.

The longer shots

In addition to the main challengers above, there are several other producing nations that could also contribute volumes in the 2020s.  These include Brazil, Egypt, Iran, Israel, Norway and Oman.  New projects in these countries are more likely to proceed in a higher global demand growth scenario or if Henry Hub price rises unexpectedly disadvantage US export projects.

Shape of the next wave

The conditions are falling into place to spark an onset of new liquefaction project investment decisions. Global gas demand remains strong.  This month’s run up in Asian spot LNG prices towards 12 $/mmbtu is also flashing on producers radar screens.

But the volumes, timing and source of next wave of LNG supply still remain highly uncertain. 2019 is set to be a key year for first mover FID decisions that will shape the next wave.

Timera is recruiting power analysts
We are looking for a Senior Power Analyst and a Power Analyst with strong industry experience. Very competitive & flexible packages. Further details at Working with Timera.


Next LNG supply wave: the 5 major players

The current wave of new LNG supply consists of more than 150 mtpa of committed liquefaction projections coming online between 2015 and 2022. But considerable uncertainty remains as to the size, source and timing of the next wave.

In today’s article we take a tour of the 5 countries likely to dominate the provisions of additional liquefaction capacity to meet LNG supply growth across Asia, Europe and Latin America.  Chart 1 shows an illustrative scenario of next wave supply across the top 5 players.

Chart 1: Next wave LNG supply by country

Source: Timera Energy

Qatar

Qatar is currently the world’s largest LNG supplier. A relatively low feedgas cost base means it is best placed to participate in the next wave, albeit with volume constraints.

The North Field supplying feedgas to current trains has been under a moratorium (self-imposed in 2005) preventing further development until a technical assessment of impact on the rapid rise in output on the reservoir was completed.  Most recently Qatar has announced it intends to expand its output from 77 mptpa to 100 mtpa by building 3 new trains (assumed 8 mtpa each).  A further debottlenecking project could also add an additional 7 mtpa at low cost (a future possibility should not be discounted). The 3 new trains are likely to come onstream in 2024-25.  We set out more detail on new Qatari supply here.

US

US export projects feature strongly in the current supply wave. Projects under construction include Elba Island (2.5 mtpa, 2018), Sabine Pass T 5 (4.5 mtpa 2019), Freeport T 1-3 (15 mtpa 2019-20), Cameron T 1-3 (13.5 mtpa 2019), Corpus Christi T 1-2 (9 mtpa 2019).

As long as Henry Hub remains around current levels (~ 3 $/mmbtu), a new wave of US export projects looks likely over the next few years.  Key prospects for the next wave include:

  • Sabine Pass Train 6 – 4.5 mtpa project with FTA and FERC approvals in place; FID awaits sufficient customer contracts to attract financing. FID likely in 2019 with start-up in mid 2023. There may be further upside from Sabine Pass (online in the later 2020s).
  • Freeport Train 4 – An additional 5 mtpa train for which Freeport have non-FTA approval (which allows cargoes to be delivered to countries with-out a free trade agreement with the US) and awaits final FERC approval to construct. It is assumed FID is taken in mid 2019 and start-up in 2024.
  • Corpus Christi future trains – Train 3 (4.5 mtpa) has been securing contracts with an FID taken this year setting up commissioning around 2023. There could be further trains online in the later 2020s.
  • Magnolia LNG project – based in Lake Charles, Louisiana, has both non-FTA and FECR approval to build four trains, each of 2 mtpa capacity. FID of train 1 and subsequent trains, awaits the negotiation of contracts with customers for offtake. Reasonable prospects to come online across second half of next decade.
  • Lake Charles project – Three trains, each of 5 mtpa, with non-FTA and FERC approvals and Shell as the key project investor. It has recently sought to extend the construction start deadline to Nov 2019 (i.e. it has delayed the project).  Start-up timing likely 2024-26.
  • Golden Pass project – Three trains each of 5.2 mtpa. ExxonMobil, ConocoPhillips & Qatar Petroleum make up a strong base of sponsors/investors, but little progress recently. An FID around 2020 would see trains online mid-decade.
  • Driftwood LNG project – developed by Tellurian as a multiple train concept aiming for total export volumes of 3.4 bcfd (26 mtpa). Final FERC approval is not expected until early 2019.  The project is searching for a new business model to secure finance.
  • Calcasieu LNG project – likely to comprise two trains each of 5 mtpa. Recent contracts with Shell have increased the likelihood of this project proceeding (e.g. online from mid 2020s).

Russia

The Sakhalin project on Russia’s eastern seaboard has operated successfully with Shell as a major partner since 2009.  More recently Novatek has, against all expectations, successfully commissioned the first of three trains at Yamal LNG on the Yamal peninsula of northern West Siberia.  The second and third trains are expected to come onstream in September 2018 and January 2019 respectively.  Novatek will proceed with a small Train 4 (0.9 mtpa) to test a novel ‘arctic cascade’ liquefaction process which, if successful, will be used in later trains. Start-up of Train 4 is scheduled for end 2019.

Novatek is then planning to proceed with a second project ‘Arctic LNG 2’ with three trains of 6.1 mtpa each, starting in end 2023 onwards. Sakhalin 2 expansion is also an even money bet, which would result in an additional train of 5.4 mtpa from around 2024.

Canada

Canada was anticipated to be a big next wave player a few years ago.  But Canadian projects now face major challenges in the form of overly complex regulatory/fiscal hurdles, cost base (particularly labour availability) and a waning Asian buyer interest in oil indexed long-term contracts. Two projects currently remain as ‘live’ prospects for nearer term FID:

  • Woodfibre – This is a relatively small (2.1 mtpa) project. It took ‘conditional’ FID in 2017 – subject to meeting many environmental commitments – some of which are with First Nation groups. In late 2017 it announced it would push back its ‘decision on construction start’ until these had been resolved. A 50:50 prospect with likely start from 2023.
  • LNG Canada – A Shell-sponsored project which was delayed but is now been actively progressed again. It comprises 2 trains of 6.5 mtpa located at Kitimat. Momentum is building to achieve FID before end 2018. Start up likely to be around 2024.

No other LNG export projects are approaching maturity at present.

Australia

Icthys & Prelude projects are due to be commissioned in 2018. No other new LNG export projects are approaching FID at present. Woodside’s large Browse project was shelved in 2015/16, but resurrected in 2017 and is a possibility for FID in the early 2020s.  There are a range of other projects which could come online the late 2020s/early 2030s, most of these brownfield extensions.  Given Australia’s poor recent track record of project slippage and cost overruns, both buyers and investors are likely to be wary.

What about the others?

While these top 5 producers are likely to dominate the next wave, a number of other producing countries are also likely to contribute. If market consensus on Henry Hub is wrong and prices recover towards (or above) 4 $/mmbtu, then countries in East Africa & South-East Asia may step up to displace US export projects.

We’ll return next week with a summary of the ‘second tier’ competitors.

Timera is recruiting power analysts
We are looking for a Senior Power Analyst and a Power Analyst with strong industry experience. Very competitive & flexible packages. Further details at Working with Timera.


Monetising European gas storage value

Storage capacity is a feature of most European gas portfolios.  Traders and portfolio managers use storage as a key source of midstream flexibility to manage volume and price risk within portfolios.

Storage capacity may be acquired or developed in order to manage inherent ‘short flexibility’ positions in a portfolio e.g. to service retail load swings or fluctuations in gas-fired power plant demand.

Alternatively, storage may be contracted purely as a value play e.g. by a trading desk that expects higher seasonal price spreads or spot price volatility.

In either case, the hedging and optimisation of storage capacity is typically driven by hub price signals.  In today’s article we look at some of the practicalities that drive the monetisation of storage in Europe.

Overview of strategies

There are three core strategies for the hedging and optimising of storage against hub prices: spot, rolling intrinsic, spot & delta hedging.  The risk/return profiles of these 3 strategies are illustrated in Chart 1.

Chart 1: 3 core storage monetisation strategies

Source: Timera Energy

Spot:

A spot monetisation strategy involves optimisation of capacity against current and expected future spot price levels.

Under a pure form of this strategy no forward hedging is undertaken. This results in the broader red distribution shown in Chart 1 (higher expected value, higher risk). The advantage of not hedging is that there are no associated transactions costs. The disadvantage is the strategy results in a relatively wide distribution of asset returns (i.e. higher risk).

Pure implementation of a spot strategy is rare – it forms one extreme of the spectrum of monetisation approaches. But modelling of spot strategies often provides storage traders with an important benchmark that feeds into their optimisation decisions.

Spot strategies are particularly important in capturing prompt price volatility, where storage flex is difficult to hedge given available tradeable products.

Rolling intrinsic:

Probably the most common strategy adopted for monetisation of flexibility value is the rolling intrinsic strategy. Asset flexibility is optimised & hedged against the forward curve, with the owner ‘rolling’ or adjusting hedges if better opportunities present themselves.

In other words, re-optimisation and hedge adjustment is only undertaken if profitable (i.e. adjustments are risk free). Most importantly it enables the capture of some extrinsic value on an ongoing (rather than a one off) basis. The owner does not retain any downside market risk as the intrinsic hedges are only unwound if profitable adjustments can be made to the strategy.

This strategy results in the unusually shaped blue distribution in Chart 1. Value downside is limited to the value of the initial intrinsic hedge. Value upside beyond this depends on the correlation and volatility of prices.  Expected value is however always lower than for the pure spot strategy due to the negative impact of transaction costs (20% value reduction as a broad benchmark).

Delta hedging:

The delta hedging strategy is a more complex approach for the dynamic hedging of storage optionality. But greater complexity does not necessarily mean higher returns.  Liquidity constraints and transaction costs are also key practical challenges in implementing the strategy.

Under a delta hedging strategy, storage flexibility is optimised against current & expected future spot prices as for the spot optimisation strategy. But probabilistic forward ‘delta’ exposures are also calculated and hedged using linear products (i.e. fixed price/volume futures or forwards) in the underlying market. Forward delta exposures are then hedged and hedges are dynamically adjusted as deltas change with market price movements.

The theoretical benefit of a delta hedging strategy is that it targets capture of the ‘full’ option value of storage capacity, whilst reducing earnings risk when compared to a spot optimisation strategy.

Delta hedging requires exposures generated by complex analytical tools (which have ‘black box’ characteristics).  Exposures generated by these tools depend heavily on the robustness of the pricing engine in representing price uncertainty. If actual price behaviour structurally deviates from the model then large losses can occur.  For example, a structural change in summer winter spreads may cause rapid changes to delta exposures and result in losses on existing hedges (outside the expected distribution of values).

Practical strategy implementation

Defining 3 core strategies helps with categorisation of storage value capture strategies.  But in practice traders typically use hybrid strategies that draw on elements of some or all of these approaches.

Most storage buyers also purchase capacity for use as a component of a broader physical portfolio (e.g. to manage production flow, LNG deliveries, customer/power plant load).  Storage positions are still hedged & optimised against the market.  But portfolio considerations also come into play.

Rolling intrinsic is the dominant hedging strategy in European markets. This involves placing initial hedges on the summer/winter spread, then optimising hedge positions as contracts cascade.

As part of a rolling intrinsic strategy, traders typically exercise price views via leaving open exposure legs (e.g. sell winter, but retain summer exposure to buy at lower price). Risk limits however typically constrain a trader’s ability to carry large open exposures.

Faster cycle storage naturally has a more open exposure into the prompt given greater flexibility to respond to short term price fluctuations. Hedging strategy focus here is on capturing the value of prompt price volatility.

Delta hedging has a more limited use in practice.  Trading desks may use elements of delta hedging to feed into a storage monetisation strategy.  But value erosion is a real issue given analytic complexity and the impacts of liquidity/transaction costs (e.g. bid/offer spread costs and the inability to execute hedges at modelled prices given liquidity related slippage).

Storage value is transitioning to the prompt horizon

At the start of this decade, summer/winter price spreads at TTF were above 5 €/MWh. For the last 3 years spreads have mostly traded in a 1.0-1.5 €/MWh range. The substantial decline in seasonal price spreads has pushed the value of both seasonal and fast cycle storage assets into the prompt horizon nearer to delivery.

The importance of capturing spot price volatility is likely to increase going forward.  Increasing European import dependency means that the European gas market will become more exposed to outages and response delays in gas supply chains e.g. via imports of LNG and Russian pipeline gas. The extreme volatility at TTF and NBP across Feb-Apr 2018 is a good example of this. Rising power sector intermittency is also set to translate into greater swings in gas demand as power plants ramp up and down.

Storage value capture from prompt price volatility is strongly influenced by the variable costs of cycling. The lower cycling costs are the lower the strike on the spread option between two time periods.  This translates directly into a greater number of value capture opportunities and the generation of higher margin from cycling.

From a storage monetisation strategy standpoint, an increasing focus on prompt value means a greater proportion of extrinsic vs intrinsic value.  That creates a challenge for traders who are pushed towards holding a higher level of exposure into the prompt, with an associated increase in risk.  It also creates a challenge for storage asset investors given a higher portion of asset margins are exposed to short term price fluctuations.

Timera is recruiting power analysts
We are looking for a Senior Power Analyst and a Power Analyst with strong industry experience. Very competitive & flexible packages. Further details at Working with Timera.


A new UK CCGT despite no price signal

The 8 £/kW clearing price in this year’s capacity auction presented a serious roadblock for new CCGT projects. But Scottish utility SSE has mounted the sidewalk and driven around it.

SSE announced it is about to commence construction of its Keadby 2 North Lincolnshire CCGT project. SSE will invest £350m in the 840MW plant with a headline efficiency of 57% (HHV).  It is developing the project in partnership with Siemens.

There are three reasons why this decision is a big surprise:

  1. There is currently no clear wholesale / capacity market price signal to support new CCGT economics
  2. SSE is proceeding without the support of a 15 year capacity agreement
  3. Scottish Power’s Damhead Creek 2 project looked to have a significant ‘first mover’ advantage over other new build CCGT options given a favourable location near London.

In today’s article we explore some of the potential drivers behind SSE’s decision.

Risk/return deconstruction

The market risk associated with the development of Keadby 2 sits firmly on the shoulders of project equity investors.  Without a 15 year capacity agreement the project will struggle to gain any significant advantage through debt financing.

SSE’s is likely to require a significant recovery in wholesale and capacity prices versus current market conditions in order to make a return on capital invested.

Chart 1 illustrates the margin gap between current market price signals and what we estimate is required to pay back capex on a 57% efficient CCGT.

Chart 1: CCGT current vs required margin gap

Source: Timera Energy

Calculation of ‘current margin’ in the chart is based on:

  • Q1 2018 8.40 £/kW capacity clearing price
  • Current forward clean spark spreads for capacity year 2018-19
  • Assumptions on opex and ancillaries consistent with a generic new CCGT in North Lincolnshire

Calculation of ‘required margin’ in the chart is based on annual margin required to cover an 8% post tax nominal return on a latest generation CCGT plant in this location (estimated at 90 £/kW).

Chart 1 illustrates what we estimate to be a gap of at least 25-30 £/kW/year versus current market price signals. What factors could drive such a recovery?

Wholesale & BM margin:

There are structural drivers that are working in SSE’s favour to support a recovery in CCGT wholesale margins by early next decade.  Lower variable cost coal and CCGT plants are retiring and being replaced by high variable cost engines, DSR & batteries. This is set to support peak prices, driving value into the top 20% of hours of the price duration curve.

Keadby 2 will be the most efficient CCGT in the market when it’s commissioned. This will help it to run at high load factors (avoiding start costs) and to pick up margin rents when other more expensive CCGT units are setting prices.  The plant is also likely to be highly flexible, supporting margin capture in the Balancing Mechanism.

However, the plant also faces margin threats over its lifetime, likely to extend into the 2040s. These include the gradual erosion of load factors and margins due to penetration of renewables and the broader risks around a policy drive towards decarbonisation (e.g. possibility of emissions standards or higher carbon prices).  Paying back a high proportion of capex in the first 5 years will be key to mitigating these risks.

Capacity margin:

The 2018 auction clearing price cleaned out the majority of the UK’s remaining coal plant.  It also presented an existential threat to a number of older and less flexible CCGTs.  Further exit of thermal capacity and competitive value erosion headwinds facing engines and batteries are likely to drive a recovery in capacity prices towards 20 £/kW over the next 2-3 years.

Ancillaries & other margin:

Ancillaries revenue is typically icing on the cake but there may be favourable factors in play for Keadby 2.  From a TNUoS zoning perspective the plant may benefit from a transition to negative costs over the next few years, but there are more advantaged locations in Southern England.

In summary, SSE (& any other equity partners) are bearing substantial market risk and are likely to need a structural recovery in margin for the project to be a success.  But behind the headline margin drivers there are likely to be a number of other considerations that have a tangible impact on project economics.

Other investment drivers

SSE have not announced details of their agreement with Siemens. But it is reasonable to assume that Siemens are providing substantial support (e.g. equity, efficiency /availability guarantees, favourable maintenance contract, risk sharing). Siemens and GE have been locked in a head to head battle for the last 5 years to try and deliver a bankable CCGT project that could be used as a template to support further turbine sales.

Keadby 2 is not a greenfield project. There are likely to be important ‘end of life economics’ considerations associated with the existing CCGT plant on the Keadby site (commissioned in 1996). SSE will also be able to re-use some existing infrastructure, reducing costs.

SSE may also attach value to the Keadby 2 project from a portfolio perspective. This is complicated by the proposed merger of the SSE and N-power retail operations.

SSE is set to lose most of its flexible generation capacity over the next few years (given closure of Keadby & Peterhead CCGTs and Fiddlers Ferry coal units).  Keadby 2 helps maintain a footprint in the UK thermal generation sector. Depending on the nature of the retail merger, SSE may also see a new CCGT providing protection from price shape exposure from its retail customer book.

Time will tell if SSE (& Siemens) get paid for the risk they are taking in developing Keadby 2. But pulling the trigger first makes it even more difficult for other new CCGT projects to follow.

Timera is recruiting power analysts
We are looking for a Senior Power Analyst and a Power Analyst with strong industry experience. Very competitive & flexible packages. Further details at Working with Timera.