Value drivers for Spanish CCGTs

Foreign investor interest in the Spanish power market has ebbed and flowed since deregulation. Over this period, Spain has benefited from substantial foreign ownership and investment in energy assets.  But investment conditions over the last 5 years have been tough.

Spain was one of Europe’s leaders in renewables deployment at the start of this decade.  But the previous conservative government slashed policy support in 2013 given cost blow outs, with cuts applied on a retroactive basis.  Investor’s backed off accordingly with renewable investment grinding to a halt.

A significant overhang of thermal capacity also emerged across the first half of this decade. This was the result of robust investment in new generation last decade, just in time for the financial crisis to erode power demand.

But there are early signs of a shift in the winds.  A new minority government is stepping back behind renewable investment (reinforced by a pickup in PPA deals) and is accelerating coal closure timelines. Generation portfolio owners are also mulling over the sale, mothballing or closure of gas & coal fired assets in what could precipitate a major market shake-up.

Action is likely to be centred around Spain’s 26GW CCGT fleet. In today’s article we look at key value drivers for Spanish CCGTs.

Spanish market 101

A 40,000 foot perspective of the current Spanish supply & demand balance is useful background to understand asset value drivers.

Spanish power demand peaked in 2008 and then declined with economic growth after the financial crisis. Demand has however steadily recovered since 2015, in line with economic growth. Demand peaks in the winter, although summer peak demand levels are approaching the winter peak as air-conditioning load increases.  Demand is likely to rise in the 2020s due to a combination of the electrification of transport and space heating/cooling.

The Spanish capacity and generation output mixes are summarised by technology type in Chart 1.

Chart 1: Spanish generation capacity (GW) & production output (TWh)


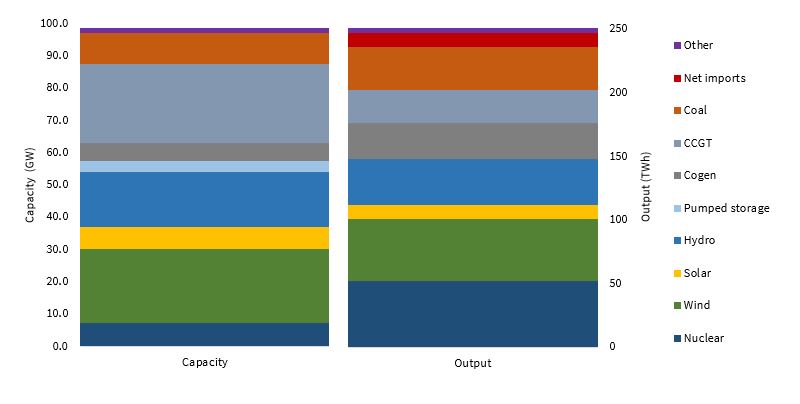
Source: Timera Energy, Red Electrica

The bottom half of the Spanish supply stack is dominated by low variable cost capacity.  Nuclear and wind account for around 20% of annual generation output each.  In addition there is another 5% of solar output (set to expand as investment picks up again) and 3-5% of net imports (cheaper power from France & Portugal).  Coal and gas-fired plants then provide the flexibility required to balance the market.

Spain has substantial swings in hydro output dependent on rainfall & storage levels as shown in Table 1.

Table 1: Historical hydro output versus system demand


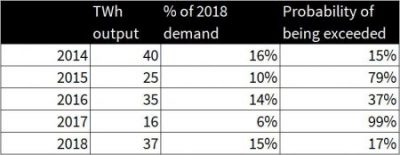
Source: Red Electrica

In a dry year (e.g. 2016), Spanish hydro accounts for around 6% of demand.  In a wet year that can rise above 15%.  The right hand column gives an indication of the probability of exceeding the level of hydro output in each year (low % if a wet year, high % if a dry year). Swings in hydro output are an important driver of gas and coal plant load factors (which rise in dry years).

The other important dynamic that impacts thermal asset load factors is relative commodity price levels.  The overhang of capacity and falling demand, pushed CCGTs into a peaking flex provision role by the middle of this decade. But CCGT load factors have started to rise again across 2018-19, as falling gas prices and rising carbon costs erode coal plant competitiveness.

CCGTs have also benefited from a Q4 2018 cut to the ‘green cent’ tax on gas consumption, reducing variable costs (by ~4 €/MWh).

These shifts in competitive balance are reinforcing the importance of gas in setting marginal power prices in Spain.

Key issues impacting CCGT value

From a CCGT owner’s perspective, the list of concerns about value evolution can be grouped into 3 buckets.

1.Capacity payments

As load factors have declined, CCGTs have been ‘kept alive’ via two forms of capacity payment:

  1. Availability payment (~5 €/kW)
  2. Investment subsidy (~10 €/kW)

But this life support is being pulled.  The availability payment was suspended last year given government concerns around EU state aid review.  Around 70% of Spanish CCGTs will lose the investment subsidy by 2021.

There is a strong lobby voice from CCGT owners against capacity payment removal, with legal challenges underway on subsidy suspension.  Some revised form of capacity payment support is likely going forward, but the risk around the timing & level of this is borne by asset owners.

2.Capacity mix evolution

Changes in the Spanish capacity mix will be key to alleviating the current overhang of capacity that is undermining CCGT margins.  The ability of the new government to revive renewable investment, will be an important factor across the 2020s. But there are some more immediate factors in play.

Half of the Spanish coal fleet (5GW) will close by Jun 2020 driven by EU emissions legislation, removal of coal subsidies and the closure of domestic coal mines.  The new government is now aiming to close the remaining 5GW of coal capacity by 2025. Adverse market conditions (low gas & high CO2 prices) could accelerate this.

Plant owners have also faced regulatory constraints around closing or mothballing CCGTs, exacerbating excess system capacity. But these are likely to be eased as capacity payments are removed.  This should see older and less flexible CCGTs coming offline e.g. Naturgy (the rebranded Gas Natural Fenosa) is currently seeking approval to mothball 2GW.

Significant closures of Spanish nuclear plants are likely to start in the second half of next decade.

3.Load factors & wholesale margins

The average load factor across the Spanish CCGT fleet is currently around 20%.  Behind the average utilisation of individual assets can vary significantly based on efficiency, flexibility and location. But it is difficult for owners to cover fixed costs with such low load factors.

Closures and mothballing of coal and gas capacity over the next two years will be a key driver of a more structural recovery in load factors. Commodity price evolution will also be important.

But in the meantime, Spain faces a conundrum The market needs CCGT flexibility across the 2020s, firstly to backup increasing wind & solar intermittency and secondly to offset swings in hydro output. This is the case even under the most optimistic scenarios of future battery deployment. Yet under current market arrangements it is not clear how CCGTs will earn an adequate margin to remain open.

That is the essence of the challenge facing both CCGT owners and policy makers.

Building a Spanish CCGT investment case?

The suspension of capacity payments may mark the point of capitulation for many CCGT owners, after 5+ years of poor margins. Naturgy’s decision to pull 2GW of capacity offline is likely to be followed by other asset sales, mothballing or closure decisions.

CCGT ownership in Spain is dominated by utilities with transitioning business models. Boardroom focus is shifting away from conventional thermal generation portfolios towards renewables and energy services. This smooths the way for sale of thermal assets, along with the fact that asset values have already been written down.

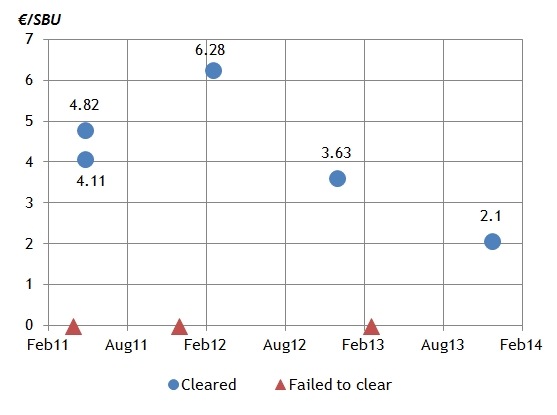
The investment case for prospective asset buyers is focused on acquiring cheap options.  CCGT capacity assets may transact at less than 50 €/kW (vs new build costs of 500 €/kW+).  While that may seem like cheap capacity in a market that has a structural requirement for CCGT flex into the 2030s, some of the 26GW of assets are worthless (i.e. margins don’t cover fixed costs).

The challenge is paying a ‘premium’ for CCGT assets that fairly reflects the value of asset optionality (or flexibility). This premium does not just include the acquisition cost.  It also involves paying annual plant fixed costs (~20 €/kW). Defining adequate risk adjusted margins above fixed costs is not a simple exercise.

Building a robust investment case comes down to:

  1. Identifying unique asset benefits (e.g. ramping flex, lower variable & start costs, locational benefits, additional margin streams)
  2. Minimising fixed costs i.e. ‘cost of carry’ of asset optionality (e.g. via renegotiating maintenance contracts & cutting overheads)
  3. Understanding the evolution of the Spanish capacity mix (& associated uncertainty) and the impact of this on pricing and CCGT margin dynamics
  4. Ability to quantify the value distribution of CCGT optionality i.e. flexibility to respond to price fluctuations (via probabilistic dispatch optimisation modelling)
  5. Understanding Spanish regulatory risk and developing an associated management / diversification strategy.

An environment of distressed asset owners and capitulation creates opportunities. But in a nutshell, it comes down to the combination of getting the right assets at the right price.  That combination is starting to look more achievable given a growing queue of owners looking to exit.

Resurgence in UK gas storage value

Investment in gas storage, like most energy asset classes, has strong cyclical dynamics.  Storage cycles are reinforced by relatively long project construction lead times. It can take 3 to 5 years to bring capacity online after making an investment decision, by which time market conditions can have shifted from ‘boom’ to ‘bust’.

The UK gas market (along with other European markets) saw a storage investment ‘boom’ later last decade. This was driven by robust levels of seasonal price spreads and spot price volatility, the two key price signals for storage investment. As a result, relatively large volumes of new storage capacity were commissioned earlier this decade.

This ‘boom’ quite quickly transitioned to ‘bust’.  Gas demand across Europe fell by almost 20% from 2010-15, reducing the demand for supply flexibility. On the supply side, new storage capacity contributed to an emerging overhang of flexibility.  Seasonal price spreads and spot volatility declined accordingly, creating a tough margin environment for storage across most of this decade.

But this prolonged bust has sown the seeds for the next boom in UK storage. Price signals for supply flexibility in the UK gas market are signalling a tightening market.  Both seasonal price spreads and prompt volatility are continuing a structural recovery that started in 2016.

In today’s article we analyse the evolution of UK gas storage margins and set out how and why they have surged across the last two years.

Structural drivers behind UK gas flex recovery

The most important driver of the recovery in the value of UK gas supply flexibility has been the closure of Centrica’s Rough storage asset. Rough accounted for more than 70% of UK working gas volume and 25% of daily deliverability.  Its closure upended the UK supply and demand balance for flexibility.

The impact of Rough’s closure has been reinforced by the roll off of long term contracts (with low variable flow costs) on the IUK interconnector in Q4 2018. This has transitioned the IUK to a higher variable cost peaking provider of flexibility.  Ebbs and flows in LNG imports across the last two years are also supporting higher NBP price volatility.

Looking forward over the next 5 years, market conditions do not look conducive to another bust.  There are 3 important structural drivers that support a continuing recovery in the value of gas supply flexibility:

  1. Increasing import dependency: as domestic production declines, the UK and European gas markets are becoming more dependent on import supply chains which are slower to respond to price signals (supporting price volatility)
  2. Greater power sector flex requirement: rapid growth in intermittent renewable capacity and the closure of coal-fired plants is increasing the requirement for flexibility from gas-fired generators
  3. Ageing infrastructure: Rough is illustrative of ageing gas supply infrastructure across the UK & Europe, with owners reticent to invest in (or even maintain) assets given low margins experienced this decade.

Salt cavern fast cycle storage is the asset class best positioned to respond to recovering market price signals.  Margins of existing assets have seen a significant recovery since 2016 (as set out in the section below).  Across the last two years, there has also been a strong increase in interest from gas suppliers and traders looking to secure fast cycle storage contracts or offtake agreements.

Analysing UK storage margin evolution

In order to understand the evolution of UK faster cycle storage value we have modelled historical margin capture for a storage asset with the capability to cycle ~6 times per year (30 days injection, 30 days withdrawal).

This analysis does not involve ‘black box’ storage modelling.  It is based on a transparent & objective ‘rolling intrinsic’ margin capture strategy that could have been achieved against historical NBP forward curves.  In other words analysis does not involve any unrealistic assumptions such as inflated extrinsic value capture or perfect foresight.

Chart 1 shows annual achieved margin capture for each gas storage year (starting Apr, ending Mar) from 2009 to 2018. We calculate storage margin capture by:

  • Taking daily NBP gas forward curves across the horizon (bootstrapped settlement prices)
  • On each day, identifying & executing any profitable hedges & hedge adjustments against observable forward prices (accounting for variable cycling costs & BO spreads)
  • Injecting & withdrawing gas based on final hedge positions
  • Calculating the annual captured margin as the sum of hedge cashflows minus variable costs across each storage year.

Chart 1: Historical UK storage margin capture


Source: Timera Energy

The chart shows that the first half of this decade was a tough period for UK storage margins, with a steady decline from 2010 to 2015.  Both spot volatility and seasonal price spreads fell across this period pulling down storage margins as described above.

But these factors started to reverse from 2016.  UK gas demand has steadily recovered, particularly in the power sector.  And there have been large net closures of storage capacity (mostly Rough, but some from Hornsea as well).

This has ignited a sharp increase in achieved storage margins, particularly in the 2017 and 2018 storage years.  The 2017 storage year (Apr17 – Mar18) value increase was focused on ‘market shock’ events where prices spiked.  The most important market shock driver related to price volatility caused by the ‘beast from the east’ weather system in Feb-Mar 2018.  The impact of the beast from the east can be seen in Chart 2, which shows the spread between Day-Ahead and Month-Ahead NBP prices (a simple benchmark for prompt margin capture).

Chart 2: NBP Day-Ahead minus Month-Ahead price spread


Source: Timera Energy

Every 3 to 5 years, storage can generate high margins from shock events such as the beast from the east.  As the UK gas market becomes more import dependent, these shocks are likely to increase.  But there is significant uncertainty around the timing & frequency of shocks occurring.  This risk has to be borne by capacity buyers and is reflected in capacity value.

What is interesting about high margin capture in the 2018 storage year (Apr-18 to Mar-19) is that margin capture was not focused on large shock events. Instead value across the year has been the result of higher underlying volatility. We have annotated the chart with some examples illustrating this.

A storage margin recovery trend has been in place since 2016.  But 2018 conditions represented a more encouraging stability evolving in margin capture. It would not surprise us to see an investment decision taken on at least one new UK salt cavern storage facility across the next year.

Timera is recruiting analysts
We are looking for analysts to join our growing team. Very competitive & flexible packages. Further details at Working with Timera.


The relevance of a near zero UK capacity price

The latest T-1 UK capacity auction cleared at 0.77 £/kW on Wed last week. That is 87% lower than the last T-1 clearing price (at 6 £/MWh).  77 pence represents back pocket change.  If you tipped a waiter this amount you’d risk your having your coffee ‘spilled’ all over you.

Shock is a natural first reaction to a near zero capacity price.  How will the market deliver capacity to keep the lights on if there is no price signal?

But there are important reasons why last week’s auction has little relevance as a guide for future UK capacity prices.  Today we look at the causes of such a low price and consider implications for the UK power market.

The auction in context

The first important point to note is that the T-1 auctions are essentially ‘top up’ or supplementary auctions to balance any capacity discrepancies from the main T-4 auction.  Only about 5% of 2019-20 capacity is actually subject to the 77p price.  The remaining capacity will receive much higher T-4 prices, with the main T-4 auction for 2019-20 clearing at 18 £/MWh as shown in Chart 1.

Chart 1: UK capacity market cleared auction volumes & prices by delivery year


Source: Timera Energy

The receipt of any capacity payments (T-1 or T-4) is of course dependent on the reinstatement of the capacity market (currently suspended after the ECJ ruling). But the government has indicated it expects to make retrospective payments on capacity to cover any delays.

Why did the price clear near zero?

The most obvious cause of a low clearing price was that the auction was very well supplied.  9.4 GW of capacity was competing to meet a 3.6GW demand target.

This overhang of capacity was exacerbated by several factors that weren’t anticipated at the T-4 stage e.g. survival of the 1.2GW Peterhead CCGT (as a result of a favourable transmission charge ruling) and the early commissioning of the NEMO interconnector and a number of gas engine and waste energy generators.

All capacity that cleared, except the last few marginal MW, was effectively priced at zero i.e. owners were committed to providing capacity regardless of price outcome. As well as capacity that came online earlier than anticipated, it appears that several of the larger existing thermal units also bid zero e.g. Centrica’s Kings Lynn, Killingholme and Peterborough plants.

This is where the relevance of the auction was undermined by a very short timeline to delivery.  An auction in mid June for a capacity year starting in October, represents a 3.5 month lead time.  There is very little that capacity owners can practically do in response to the auction price signal over that time frame.

Over the usual 9 month T-1 horizon, capacity owners have more flexibility to consider responses such as mothballing or delaying investment decisions. But at the 3.5 month stage, most costs involved in operating capacity are already sunk (or unavoidable).  In that situation the rational response is to bid capacity at or very close to zero price levels. These conditions effectively undermined the purpose of the auction.

Impact & implications of a low price

A near zero price has dashed any remaining hopes of larger thermal units that didn’t secure a 2019-20 capacity agreement at the T-4 stage.  3.5 GW of coal plants will close over the next 9 months: 2GW Cottam (EDF) in Sep-19 and 1.5 GW Fiddlers Ferry (SSE) in Mar-20.  West Burton A (EDF) has a capacity agreement in 2020-21, but may have to run at a significant cash loss if it stays open to fulfill this. Another 0.5GW of gas-fired plant (ESB’s Corby and Centrica’s Brigg) are on the highly endangered list.

But beyond these closures, the dynamics driving last week’s T-1 auction have virtually no bearing on pricing of the main T-4 capacity auctions.

The ‘top up’ nature of T-1 auctions mean that supply, demand & pricing dynamics differ substantially from T-4 auctions. T-1 capacity volumes are relatively low, with what are typically steep and ‘chunky’ supply stacks.  If the market is oversupplied at the T-1 stage, prices lurch to low levels.  But the opposite is also possible if the market is tight e.g. because of unanticipated closures and capacity shortfall at the T-1 horizon.

Step forward to next T-4 auction and there are a number of factors supporting higher capacity prices:

  1. Engine headwinds: Achieved gas reciprocating engine margins across the last 12-18 months have been significantly lower than expected, effectively acting to increase capacity bids on future investments.
  2. DSR: The success of DSR from previous auctions is set to be substantially impacted by revenue reductions resulting from rule changes set to be implemented under the Transmission Charging Review.
  3. Coal economics: The economics of remaining coal units have deteriorated significantly across 2018-19 as gas prices have fallen & carbon prices risen. This will likely lift the bids of the remainder of the UK coal fleet.
  4. Batteries: Steep reductions in battery de-rating factors and declining frequency response returns have stemmed the tide of batteries bidding aggressively into the capacity market.

The 77p capacity price is an unwelcome outcome for the 5% of capacity owners that will receive it across the next year. But it has little bearing on what happens going forward in the UK power market.

Timera is recruiting analysts
We are looking for analysts to join our growing team. Very competitive & flexible packages. Further details at Working with Timera.


Gas vs coal plant switching practicalities

The switching dynamics of European gas for coal plants have never been more important than in 2019.  Falling hub prices are tipping the competitive balance in favour of gas-fired plants. Front month TTF prices last week plunged towards 10 €/MWh (3.60 $/mmbtu) as near record volumes of LNG & Russian imports continue to flow into European hubs.

This shift in competitive balance is causing an increase in the influence of gas in setting marginal power prices across Europe.  It is also helping support gas demand, allowing European hubs to absorb high gas import volumes.

The importance of relative gas vs coal plant variable cost dynamics means that a lot of attention is currently focused on switching price levels. But the concept of switching levels oversimplifies the dynamics driving the swings in gas and coal plant output. In today’s article we look at some of the practical drivers beneath a simple line on a chart, using a German power market case study.

Switching level is not just a line on a chart

The coal for gas switching price level is often drawn as a simple line overlaid on a gas price chart.  This implies a clean transition from gas to coal plants as gas prices shift either side of the switching line.

In Chart 1 we show a switching range as opposed to a line.  This reflects a gas price range across which CCGTs displace coal plants, given differences in plant efficiencies and variable costs.  But even this significantly oversimplifies underlying swings in gas & coal plant output.

Chart 1: Forward European gas for coal plant switching range

Source: Timera Energy

The ability of the power sector to absorb incremental gas and the importance of gas in setting power prices fluctuates in real time. This is best illustrated with a case study in Chart 2 which shows German generation output across the last 10 days in May 2019.

Chart 2: German hourly generation output by plant type (GW)

Source: Fraunhofer Institut

The variable cost competitiveness of coal vs gas plants is relatively stable across such a short time horizon. In other words, nothing of note is changing on the switching chart.  Yet despite of price stability, there are three additional factors that have an important influence on the relative levels of gas vs coal output:

  1. Renewables output

In periods of high wind and/or solar output, both gas & coal units are increasingly being driven out of merit, regardless of fuel costs. In these periods we are increasingly seeing lignite or even nuclear units on the margin in Germany.

  1. Plant level dynamics

There are important factors driving output at an individual plant level that are not related to fuel & carbon prices. For example, there are minimum output levels associated with CHP offtake commitments for both gas & coal plants. There are also a range of other factors that vary widely across plants such as ramping flexibility and coal transport costs.

  1. Power demand

The level of power demand varies on both an intraday and seasonal basis. This (in combination with renewable output volumes) influences thermal plant load factors.  If overall power demand is low then there is limited switching potential.

Relative fuel & carbon price levels clearly favour gas over coal plants in Chart 2.  When thermal flexibility is required, gas plants are claiming a greater portion of the pie. But the three other drivers described above are just as important in determining how much switching & incremental gas demand volumes are actually occurring in practice.

Decarbonising European gas: value chain impact

Decarbonisation of the European gas market will involve very large scale investment across the supply chain, regardless of the pathway via which it is achieved. European energy companies are in a strong position to lead a gas market transition, just as they are currently doing in the power sector.

Gas decarbonisation will require major changes in infrastructure, business models & regulatory frameworks.  It will also result in structural changes to the value and risk profiles of existing gas assets.

But decarbonisation brings substantial growth opportunities for companies that are positioned for change. The challenge is that the growth areas going forward may be very different to those of last two decades.

Today we focus on:

  • how the European gas value chain may be impacted by decarbonisation
  • what this means for the key categories of market players (producers, network owners, suppliers & midstream flex assets).

We do this with the aim of identifying both risk mitigation actions and growth opportunities for the players involved.

How decarbonisation pathways impact the gas value chain

In last week’s article we set out 3 potential pathways that the European gas market could follow toward decarbonisation (2020s to 2050s). All of these pathways involved structural changes in the gas supply chain by the mid 2030s.  A quick recap:

  1. Gas transition: Steady transition to large scale hydrogen networks by 2050s. Transition supported by ‘blending’ of hydrogen (& potentially bio-methane) in existing networks across 2020s-30s. Large scale methane reformation into hydrogen at European border entry points by the 2050s.
  2. Steady displacement: Gas retains a structural role, but with a changing/shrinking footprint. From the mid 2030s gas starts to be displaced by electrification of power/heat/industry (by default). By 2050s, fragmented & localised gas networks are focused on flex backup in the power sector & hard to reach areas of heat/industry.
  3. Rapid displacement: Electrification broadly displaces gas from the energy mix by the 2050s. Displacement from the power sector across 2020s-40s (by electricity storage) & heat/industry across 2030s-50s. The residual role of gas is focused on smaller scale local applications (e.g. biogas), with progressive closure of gas T&D networks.

So what could these different pathways mean for infrastructure & companies across the European gas value chain? In Table 1 we summarise the potential impact.

Table 1: Value chain impact of 3 decarbonisation pathways

Pathway Value chain impact
 Gas Transition Headline: Extensive but managed infrastructure & business model transition

  • Blending of hydrogen & bio-methane supports: (i) continued usage of existing gas infrastructure (2020s to 2040s) & (ii) the role of gas as a transition fuel e.g. displacing coal & lignite across 2020s
  • Existing producer supply chains (e.g. Russia/Norway/LNG) may continue to deliver methane to European borders for reforming to hydrogen
  • Steady transition to hydrogen networks & infrastructure across 2030s-50s, requiring large scale new investment (from production to burner tip)
  • Adaption/upgrade of some existing midstream infrastructure (e.g. storage, regas terminals) to support hydrogen networks
 Steady displacement Headline: Time for ‘fast movers’ to adapt (or exit) as new role of gas defined

  • Relatively high utilisation of existing methane infrastructure into 2030s, before displacement by electrification gathers pace in power, heat & industry
  • Steady decline in gas demand & asset utilisation from mid 2030s, with networks & infrastructure becoming more localised/fragmented
  • Flexibility/peaking role of gas infrastructure increases over time as utilisation falls e.g. to support peaking flex in the power sector
  • Asset risk/return profiles change as gas evolves into ‘peaking’ role, with associated changes in regulatory, ownership and business models
  • Significant retirement of existing methane supply chain infrastructure by 2050s
 Rapid displacement Headline: Industry wide disruption to asset values & business models

  • Gas infrastructure utilisation starts to decline from late 2020s with a more limited role of gas as a transition fuel
  • Peaking flex role of gas in the power sector diminishes with rapid electricity storage evolution in 2030s & 40s
  • Large decline in gas infrastructure utilisation across 2040s-50s
  • Broad based redundancy of existing methane supply chain infrastructure by 2050s, including stranding of existing assets

Source: Timera Energy

Balancing the 30 year horizon with the 10 year one

At first glance, the impact of these pathways seems to be a major threat to existing gas asset portfolios & business models. But there are some important considerations to balance against this.

Under all three pathways gas could well see somewhat of a resurgence across the next 5 years. There are two key drivers behind this:

  1. Coal & nuclear closures: Substantial volumes of coal, lignite and nuclear capacity face regulatory driven closure over the next decade, much of this over the next 5 years (e.g. Germany 25GW). This is set to increase the load factors of existing gas-fired plants & therefore gas demand.
  2. Low prices: Large volumes of new LNG supply (2019-21) are pushing down European hub prices. This is causing coal to gas switching in the power sector. But it may also induce other demand side response.

In the ‘Gas transition’ and ‘Steady displacement’ pathways there is also a genuine role for gas as a transition fuel well into the 2030s. The EU’s current top priority is driving coal out of the energy mix. A number of countries are in parallel closing nuclear plants (despite dubious emissions logic). In the absence of blistering electricity storage technology evolution, gas will be needed to plug the capacity gap. Beyond that, a combination of biogas & hydrogen from electrolysis may be a longer term necessity.

The ‘Gas transition’ scenario would likely be a very favourable outcome for European energy companies prepared for change. As a result we think this is the path which will garner the greatest industry support.  If momentum builds behind blending of hydrogen & biomethane in the early 2020s, this may support both:

  • Use of existing networks & infrastructure well into 2030s, with increasing blending of hydrogen and biomethane
  • Very large scale investment in hydrogen production and network infrastructure (& the potential for European companies to lead a global roll out of hydrogen).

Hydrogen production via steam reformation could even actually support European gas demand, given energy required in the conversion process (and to capture CO2) results in a conversion efficiency of some 75 to 80%.

Impact on different players

Next we summarise the potential impact on players across the gas value chain. This draws in part on material from Jonathan Stern’s recent paper on gas decarbonisation.

Producers

  • LNG producers & aggregators selling into Europe
    • will need to watch the potential for declining demand from 2030s
    • but they have the potential to sell elsewhere e.g. Asia/Lat America (at least temporarily)
  • Pipeline linked producers (e.g. Russia, Norway, North Africa)
    • More exposed to European demand decline (& tougher prospects for signing LTCs)
    • Strong incentives to carve out a role in hydrogen reformation supply chain
  • Substantial opportunities to develop hydrogen production infrastructure
  • Both LNG & pipeline producers have incentives to locate hydrogen production at European borders (e.g. regas terminals, pipeline entry points) to preserve existing methane supply chains to the border

Transmission and Distribution Network Owners

  • Face key risk of erosion of network utilisation
  • Network location and decarbonisation pathway important in defining value impact
  • Blending of hydrogen & bio-methane important to support utilisation in 2020s-30s (incentives aligned with producers here)
  • Transition to different regulatory & ownership structures likely as existing network utilisation declines
  • Opportunities to develop new hydrogen (& bio-methane) networks, but new regulatory, commercial & investment structures required to support this

Gas Suppliers:

  • Easier to adapt gas supplier business models than other parts of the supply chain
  • Issues arise where suppliers own assets/infrastructure that suffer from falling utilisation, which may lead to increasing asset divestment momentum (& the contracting of replacement flexibility)
  • Strong diversification logic in electricity supply chain presence
  • Trading businesses will need to evolve with the market, but are relatively well placed to do so (e.g. in supporting flex/peaking role of gas + potentially establishing hydrogen markets), albeit replacement markets may be more fragmented and less liquid than the current pan-European hub market

Midstream gas and power assets:

  • European midstream asset owners (e.g. regas & storage) & gas-fired power plant owners are already adapting to changing market conditions & lower utilisation
  • Transition to ‘peaking’ role of these assets is likely to continue through 2020s-30s
  • As a result, substantial change of ownership likely over 2020s-30s as assets transition to owners with appetite & skill set to manage ‘peaking’ risk/return profiles
  • Substantial opportunities for new investment in hydrogen (& bio-methane) midstream infrastructure as well as conversion of suitable existing assets (e.g. storage, regas)
  • There could also be big opportunities in CC(U)S both for hydrogen production and power plants.

Conclusions on how to approach gas decarbonisation

The impact of gas decarbonisation on gas portfolios can be broadly split in two categories:

  1. Impact on value and risk of existing assets
  2. Growth opportunities in the development of new assets & markets

Both need to be approached in a pragmatic way that reflects the uncertainty and timescales involved, using a structured analytical framework.

In our view, the best way to approach this is for companies to develop their own in-house decarbonisation ‘pathways’.  These can then be used to analyse & even quantify the impacts of decarbonisation, e.g. by understanding upper and lower bounds on asset value and risk.  They can also be used to target lobbying for appropriate policy support.

Doing nothing because decarbonisation is too far off is not really an option anymore. Whatever decarbonisation pathway and timeline you subscribe to, it will involve structural changes in business models, asset values & ownership structures. These are set to commence through 2020s and accelerate in the 2030s.

A consistent framework for analysing risk & opportunities and the readiness & flexibility to act on this are likely to be key to successfully navigating the transition.

Decarbonising European gas: 3 pathways

The origins of the European gas market go back to the discovery of large reserves of natural gas, firstly the giant onshore Dutch Groningen field (1959) and then a string of early UK Southern North Sea fields from 1965. In the early 1970s, a nascent European gas network of around 100 bcm was focused on these two countries.

From 1970 to 2010, the European gas market grew beyond all expectations to around 550 bcm (stabilising since).  Growth was underpinned by rapid evolution of technology, regulation and commercial structures.  This in turn supported very large scale investment in gas infrastructure across what has become a highly interconnected and liquid pan-European market.

Here endeth the history lesson. Today we are going to focus on the next 40 years.

In last week’s article we summarised different potential technologies that can facilitate decarbonisation of gas.  In this week’s article we look at 3 potential pathways to decarbonise the European gas market.  Next week we then consider the potential impact of these pathways on the gas value chain and its key players in our final article in this series.

Is low carbon gas the 3rd key pillar of the European energy transition?

The energy transition has to date taken shape around the development and deployment of renewable electricity generation technology.  Renewables represent a first key pillar of the transition, given they facilitate large scale generation of low carbon electricity.

Electricity storage is rapidly emerging as a second key pillar. Electricity storage will help solve the challenge of ‘firming’ intermittent renewable output by enabling the movement of electricity across time periods of variable wind and solar output. However storage technology developed to date is focused on short term intra-day balancing and grid services rather than shifting large volumes of energy across weeks or seasons as is required in Northern Europe.

The combination of renewables and storage has provided the tools to kick start decarbonisation of the power sector, albeit with a range of flexibility issues that currently still depend on natural gas. The energy transition will next move to the much broader electrification of other carbon intensive sectors, firstly transport and eventually heat and industry. But there are currently substantial gaps in what electrification can practically achieve in terms of decarbonisation given today’s technology.

As a result, low carbon gas is gathering momentum as a third key pillar. It has the potential to address load shifting in the power sector as well as decarbonisation of heat & industry. Green gas, particularly in the form of hydrogen, has the potential to solve many of the remaining ‘hard to reach’ decarbonisation challenges.

Gas can reach areas that are difficult to electrify

Fully decarbonising the power sector with renewables & storage alone is shaping up to be a difficult challenge. Low carbon gas represents a large scale secondary source of flexibility alongside electricity storage e.g. to tackle weekly and seasonal load shifting.

There are also substantial parts of the heat, industrial & transport sectors which may be easier to solve with low carbon gas than electrification. This includes:

  • ‘on demand’ domestic heating which is difficult to achieve rapidly with heat pumps
  • industrial process heat where equipment design and electricity cost could render European industries non-viable compared to those elsewhere which are not subject to decarbonisation policy on a comparable scale
  • decarbonising air transport and heavy shipping (via hydrogen)

So what are the potential paths that the European gas market could follow towards a low carbon future?

3 pathways to decarbonisation

40 years is a long time horizon. Overlay accelerating decarbonisation measures and the pace of technology evolution and it is fair to say that the future of the European gas market looks very uncertain.

The risks associated with this level of uncertainty mean it is important to understand what could happen to the value of gas assets and portfolios.  This in turn requires a pragmatic framework to assess potential outcomes while recognising uncertainty.

In Table 1 we have developed 3 high level pathways for decarbonisation of the European gas market by the 2050s.  These are not scenarios that pick technologies and outcomes.  Instead, each pathway represents a set of drivers that combine to work towards decarbonisation.

Table 1: Pathways to decarbonising the European gas market

Pathway Summary
 Gas Transition Headline: Steady transition to large scale hydrogen networks by 2050s

  • Hydrogen ‘blending’ into existing gas networks in 2020s & 30s supports development of hydrogen technology (e.g. methane reformation with CCS)
  • Blending of hydrogen (& potentially bio-methane) ‘buys time’ to resolve regulatory, commercial & infrastructure transition to hydrogen based T&D networks by 2050s
  • This anchors the future of T&D networks rather than policy-driven abandonment
  • Methane converted into hydrogen at European borders (or at source)
  • Potential support from wider CCS deployment e.g. in power/industry sectors
 Steady displacement Headline: Gas retains a structural role, but with a changing/smaller footprint

  • Large scale hydrogen production not achieved by 2050s
  • Gas continues to play a key role displacing coal & lignite into the 2030s
  • From mid 2030s gas starts to be displaced by ‘default’ electrification of power/heat/industry
  • Gas retains a structural role focused on flex backup in power sector and parts of heat/industry sectors that are difficult to electrify
  • Gas market transitions to more localised & fragmented low carbon gas networks (e.g. biogas, smaller scale hydrogen, power sector CCS)
 Rapid displacement Headline: Electrification broadly displaces gas from the energy mix by 2050s

  • Gas displaced in the power sector across 2020s-40s (e.g. via faster evolution of electricity storage technology)
  • Gas broadly displaced from heat and industry across 2030s-50s possibly through offshoring to US, Asia.
  • Pace of electrification reduces momentum behind low carbon gas R&D and investment
  • Residual role of gas focused on smaller scale local applications (e.g. biogas, ‘green’ hydrogen from electrolysis)
  • Progressive closure of gas transmission grids

Source: Timera Energy

The 2050s time horizon for these pathways is driven by the increasingly recognised requirement to achieve net zero carbon emissions by mid century. If you are sceptical about achieving decarbonisation over this time horizon, the pathway horizons can be extended relatively easily (e.g. via slippage to 2060s, 2070s).

The key point is that under any of the pathways, the European gas market is likely to undergo an unprecedented transformation over the next 10 to 20 years i.e. within an asset investment horizon.

Ignoring the reality of the decarbonisation is effectively betting on European policymakers performing a structural policy ‘U turn’. That is a high stakes bet which poses an existential threat.

Interpreting the 3 pathways

The ‘Gas transition’ pathway is potentially a very positive outcome for the European gas industry. The blending of hydrogen (& potentially bio-methane) in existing gas networks buys time to develop cost effective hydrogen production solutions, as well as a regulatory & commercial framework to underpin market transition to hydrogen. This can allow a managed supply chain transition to hydrogen focused networks. It would also likely mean that European players dominate a global transition to low carbon gas (as is happening now for renewable power).

The ‘Steady displacement’ pathway sees a steady reduction & likely fragmentation in the European gas footprint by the 2050s.  Gas retains a structural role in areas that are hard to electrify, with a focus on flexibility (e.g. load shifting in the power sector).  This would likely involve substantial changes in regulatory & ownership structures, utilisation of infrastructure and company business models.  But change happens at a pace that can allow the industry to adapt and evolve accordingly.

The ‘Rapid displacement’ pathway represents a much faster disruption of the gas industry. Electrification happens at a pace that effectively leap frogs the requirement to develop wide spread low carbon gas solutions.  This is unlikely to be a comfortable outcome for current gas asset owners given the speed of disruption.  Its probability may not be high, but it is quite plausible.  As such this outcome represents an important downside pathway which is worth understanding.

Applying the pathways

Understanding what could happen over the next 20-30 years is one challenge. But it is just as important to consider how this could impact the gas asset value chain and company business models.

We explore this in next week’s article by looking at the potential value chain impact of the 3 pathways we have set out today.  Understanding this provides a basis for working out how to react to mitigate risks and define growth opportunities.


Decarbonising European gas: the risks & options

The COP-21 Paris climate accord marked the beginning of the end for coal in Europe.  Most European countries are taking clear actions to drive coal out of the energy mix through the 2020s. Could gas face a similar future from the 2030s?

Gas asset owners and investors are increasingly focused on understanding this risk.  While the role of gas in Europe may diminish from the 2030s, it is unlikely to disappear before the 2050s. But the tangible impacts of decarbonisation sit well within a gas asset investment horizon. This creates a requirement to understand, quantify and manage associated risks.

One of the key risk mitigation actions for the European gas industry is embracing new low carbon technology and ensuring there is appropriate policy support in place to deliver this.  There are clear lessons here from the European power industry.  Policy support for wind and solar has not only slashed the cost of deployment, it has created enormous growth opportunities for European energy companies in leading the global role out of renewable technologies.

Professor Jonathan Stern is Founder of the OIES Gas Research Programme. In a paper published in Feb-19 he sets out a vision for potential pathways and narratives to support decarbonisation of the European gas market (Narratives for Natural Gas in Decarbonising European Energy Markets).  Over the next three weeks we publish a series drawing on material from Jonathan’s paper.  We highly recommend his paper for further details.

In today’s article we focus on the risks that decarbonisation poses for energy companies and the potential options for decarbonising European gas markets.  Then in next week’s article we explore the impacts of decarbonisation on the gas value chain and potential impact on different players.

Why the gas industry needs to take decarbonisation seriously

Governments in most of the largest European gas markets are genuinely committed to COP21 decarbonisation targets. Some future targets may be missed. But governments appear very unlikely to abandon their commitment to large scale decarbonisation by 2050, or to substantially delay its implementation.

Importantly, a number of leading technology, energy and industrial companies are also swinging their support behind the push to decarbonise. Motives are no longer just focused on Corporate Social Responsibility.  Momentum is increasingly being driven by a strong financial motivation to lead a seismic transformation in the way we source and use energy.

To ignore decarbonisation and delay action on the part of the gas industry, invites governments to decide that gas will not play a significant role in Europe’s long term energy future.  This in turn increases the risk that there will be insufficient time to prepare for decarbonisation before unabated methane needs to be phased out.

The advocacy narrative of the European gas industry over the last decade has focused on coal to gas switching and backing up renewables.  There is logic behind this approach. The reduction in US carbon emissions since 2007 demonstrates the benefits of power to gas switching.  And gas-fired power is playing a structural flexibility role across European power markets.

But the ‘switching & backup’ narrative has failed to convince governments, NGOs, and a rising portion of media & the public that the role of gas can help achieve post-2030 decarbonisation targets. The gas industry therefore needs to develop a decarbonisation vision and associated narratives which effectively address the post-2030 period.

Technology options for decarbonising gas

There are a broad range of approaches and technologies that could be applied to reduce the carbon foot print of the European gas industry. These are grouped into four categories in Table 1 with a high level summary of pros and cons.

Table 1: Approaches for decarbonising gas

Technology Pros Cons
1. Power to hydrogen / methane
  • Cost reductions from falling cost of renewable power & storage
  • Potential to ‘absorb’ zero/negative cost periods of excess renewable output
  • Utilises existing technology (caveat scale & cost issues)
  • High cost & electricity intensity of production
  • Limited current policy & investment support
  • Realistic availability given seasonal energy shift requirement
2. Gas steam reforming to hydrogen (SMR)
  • Potential scalability e.g. across transport, heat & industry
  • Ability to use natural gas feedstock
  • Synergies with existing gas infrastructure for ‘blending’
  • Early stages of technology development
  • Cost of production
  • Reliance on CC(U)s, also higher cost & evolving technology
3. Bio & waste gas
  • Consumes waste & creates useful biproducts (e.g. fertiliser)
  • Process does not require significant additional energy
  • Relatively widely implemented (at small scale) already
  • Current low efficiency of technology
  • Resource potential & scalability limitations (particularly if relies on food crops not just waste)
  • Cost of removing impurities in order to ‘blend’
  • Anaerobic digestion produces CO2 (requiring CCS)
4. Methane Cracking
  • Technology alternative to SMR (with similar pros)
  • Produces hydrogen and solid carbon
  • Strong Russian incentive to make it work
  • Very early stage technology development
  • Uncertain cost and scalability at present

Source: Timera Energy, drawing on Jonathan Stern’s paper referenced above.

1. Power to hydrogen / methane (P2G):  This relies on the principle of electrolysis: to separate water into its component parts of hydrogen and oxygen. Experimental pilot plants were developed in the late 1990s and early 2000s.  But potential for widespread commercial deployment has been supported by falling costs of renewable power generation and increasing periods of renewable ‘curtailment’ given excess supply.

Current progress of P2G technology suggests relatively small volume potential unless large amounts of low/zero cost renewable electricity is available, or dedicated off-grid renewable energy systems are built in regions with high wind and solar resources.  The Ecofys (GfC) estimate of 24 bcm of renewable hydrogen from wind and solar power in 2050 is two and a half to five times higher than ENTSOG’s scenarios for 2040.

This technology might be adequate if the role of gas in the European energy mix is only to provide daily and seasonal back up for renewable energies. But to maintain anything close to the scale of the gas market today, biogas, biomethane, and power to gas would need to be supplemented with the reforming of methane into hydrogen accompanied by carbon capture, utilisation and storage CCUS.

2. Gas steam reforming to hydrogen options: Large scale methane reforming with carbon capture to produce hydrogen for network distribution to residential and commercial customers would be a completely new development. There are currently only two operational natural gas-based carbon capture projects in Europe.  These are both at Norwegian gas fields (Sleipner and Snohvit) with CO2 injection directly into offshore reservoirs.  There are however a range of other projects at the feasibility study or test stage in six other European countries.

At the moment, large scale methane reforming to hydrogen with CCS is under serious consideration only in the UK.  In southern Europe there is greater emphasis on biogas and biomethane development. The emphasis on offshore structures is the result of onshore CO2 storage being considered politically difficult in major continental European gas markets due to environmental opposition.

There are strong logistical advantages to gas producers from reforming methane and producing hydrogen either at the field or where the gas is landed onshore. The advantage of such pre-combustion CCS would be that only offshore CO2 pipelines would be needed. The potential disadvantage is that all networks and customers in those regions would need to be converted to hydrogen.

3. Biogas/biomethane: The primary method of biogas production is the biological breakdown of organic material through anaerobic digestion. Biogas (containing CO2 and water vapour) can be upgraded to biomethane by a variety of methods (absorption, adsorbtion, methane filtration, and cryogenic separation) which can then be used interchangeably with natural gas. While this means incurring higher costs, it then facilitates use of biomethane with existing gas infrastructure (e.g. via blending).

The most optimistic of a range of forecasts (for Europe) sees the possibility of 98 bcm of biomethane from biomass sources by 2050.The Entsog scenarios for 2040 are very substantially lower, showing only 20-50 bcm of biomethane production in 2040.  Even these more conservative estimates raise a major query over reliance on food crops given a shortage of appropriate waste.

Synthetic natural gas (SNG) can also be produced from gasification of waste via a thermo-chemical process using biomass and/or other waste as a feedstock. This technology is still at an early stage of development.

4. Methane cracking: An alternative method of hydrogen production is methane cracking which splits methane into hydrogen and a solid carbon residue (carbon black) which can then be used in a range of industrial processes. This could resolve some of the problems and costs of carbon storage, but the extent and scale of the utilisation options for carbon black are uncertain and large scale storage would still be required.

Russia is investing substantial resources in this technology as a potential means to support gas sales into Europe on a long term basis. This process is currently at the laboratory testing stage and it remains to be seen how quickly it will develop.  But Russia has a very strong financial incentive to succeed given its vast natural gas resources & reliance on gas sales revenues.

Making it happen: time frames

Many European countries are aiming to largely decarbonise their power sectors by 2030.  Focus then shifts to the heat sector across the two subsequent decades.  So the time available to demonstrate that methane can be retained in the energy mix on a large scale beyond the next 20 years is relatively short.

Following this logic, it will not be possible to recover methane-related infrastructure investments requiring a longer depreciation period. This provides a very strong motivation for the gas industry to demonstrate that decarbonised gas options are realistic and cost-effective versus alternative low carbon options. Achieving this across the next 5 years is imperative in order to provide sufficient time for a large-scale gas network transition over the following 25 years up to 2050.

The pilot projects currently in operation will need to be followed relatively quickly by commercial scale projects in order to be operational by 2025.  This in turn will require technical, regulatory, and financial frameworks to be in place to allow final investment decisions to be taken in the early 2020s. There are major uncertainties that need to be addressed in the next 5 years, of which the most immediate are technical and logistical difficulties and costs.

Making it happen: cost

A particularly important issue is the capability to ‘blend’ hydrogen into the existing gas network.  This provides a market for hydrogen produced. But it also enables use of existing gas infrastructure, substantially lowering the time and cost hurdles for kick starting decarbonisation.

Hydrogen is already blended with methane in the Netherlands. Studies suggest that blending up to at least 20% hydrogen in gas supply may be possible.  Blending of that volume could support a substantial scale of hydrogen production within existing gas networks in order to ramp up decarbonisation in the 2020s.

It is very difficult to make accurate cost estimates for the different decarbonisation options. Only biogas costs currently come close to European hub prices (e.g. a 15-30 €/MWh range), although this is without associated CCS. The lower estimates for biomethane, power to hydrogen and particularly power to methane costs range from €40-80/MWh while the higher estimates are €150-260/MWh.

Wind & solar demonstrate the potential for rapid cost declines as technologies scale with the appropriate policy support. That is why it is essential for the gas industry to launch commercial scale projects as soon as possible. The current reality is that large investments are required in projects that do not yet offer a commercial return.

The best way forward for the European gas industry is offence rather than defence. Decarbonisation presents as many opportunities as it does risks. But a clearer vision and policy framework is required to make it happen.

May Mannes joins Timera as a Managing Director.   See more details on May’s CV and background on Our Team page.


Distribution key to ‘weaponising’ demand side

A more dynamic demand side is a key building block of the energy transition. But the ability to achieve this depends strongly on the rapid evolution of electricity distribution networks and their operators.

Investment, technology & policy incentives are converging to transform the role of distribution networks.  For example:

  1. Embedded capacity: New generation & storage assets are increasingly distribution connected (rather than transmission connected), e.g. embedded wind, solar, gas engines, batteries & smaller CHP.
  2. Smart tech: Rollout of smarter technology & software within businesses and households is set to facilitate a more dynamic bi-directional real time role for the demand side.
  3. EVs: The impact of rapid deployment of electric vehicles & associated charging infrastructure will be primarily focused on distribution networks.

This is challenging the traditional ‘plain vanilla’ function of distribution networks.  Networks were developed to allow a simple one-way flow from centralised generation on the grid to end consumers. But a much more dynamic landscape is evolving with multiple sources of supply and demand interacting across the network.

This is creating physical infrastructure constraints within the network.  It is also increasing network management & balancing complexity. These factors bring the role of distribution network operators (DNOs) firmly into focus.

Evolving role of the network operator

DNOs have traditionally had a relatively staid business model focused on security of supply and quality of service. While these two goals remain key, the capabilities required to deliver on them are increasing substantially in scale and complexity.

DNOs will need to evolve rapidly and purposefully in order to facilitate an increasingly dynamic & decentralised future.  Policy makers have coined the term ‘Distribution System Operator’ (DSO) to describe their vision for an ‘evolved DNO’. But the practicalities of reaching this DSO vision may fundamentally change the revenue, ownership and financing structures that characterise DNOs today.

Whether privatised or, as in many countries, under municipal ownership, the DNO enjoys a regulator-approved natural monopoly over the wires in its territory.  Its primary revenue streams are stable, and generally price-regulated on a cost-plus model.  This more or less guarantees a reasonable rate of return if the operator is competent.  Privately owned DNOs therefore enjoy a low cost of capital and attract owners seeking stable, regulated returns.

The DNO business model has relied primarily on performing some basic, conventional ‘medium tech’ functions reliably and efficiently.  Everyone involved in electricity from generators to consumers depend on these being done well, but it is not rocket science.  Most of the ‘higher tech’ action in the industry has traditionally been upstream of the DNO, in the hands of larger and more sophisticated transmission or ‘grid’ operators (TSO).

Many current developments and trends point to this changing fundamentally over the coming years, as summarised in Table 1.

Table 1: ‘Traditional’ vs ‘Future’ role of distribution networks and operators

Traditional Future
Generation assets Dominance of large centralized plant, exporting to transmission grid Rapid growth in decentralized distribution connected generation & storage
Consumers Passive; price-takers Many active ‘prosumers’ of all sizes
System balancing A grid function: flex assets dispatched centrally Also a DNO/DSO function: flex assets deploying on a transactional basis
Demand side response Limited role of demand side; struggling to achieve participation & potential Significant participation in system balancing & optimisation at all levels
EV charging Very limited quantities; slow charging; one-way electron flow Large quantity; some very fast; some two-way electron flow
Key infrastructure actors Grid/TSO pre-eminent: legacy of central dispatch & control DNO/DSO of increasing importance: decentralisation
DNO/DSO skillset & revenue model Efficient management of ‘med-tech’ assets & processes for regulated monopoly return
In addition, participation in ‘hi-tech’ physical & transactional dynamics for additional risk & reward


There are competing visions as to how the evolution from DNO to DSO will work out, but two significant aspects are common to all of them.

  1. The physical infrastructure required to connect all these components together in an effective manner will be different, and most likely more complex and sophisticated. And it will no longer be the transmission system that bears the brunt of this.  In fact TSOs could play a materially diminished role.
  2. If the potential of the new physical assets and infrastructure is to be realized effectively, the nature of business taking place throughout the system will increasingly involve many more players, acting dynamically in multilateral, real time transactions.

The network operator is no longer simply focused on ensuring adequate physical capacity for electricity to flow to customers.  Instead they are actively managing dynamic real time activity across all network participants.

Impact on capability & ownership of DNOs

DNOs are centrally and strategically positioned in the value chain.  When fully evolved into DSOs, they should be one of the most important category of actors in the power sector.

But how readily can organisations that have made their money through efficient deployment of relatively unsophisticated technologies and processes adapt to facilitate this transition?  If they do not, or only do so slowly, they may at least miss commercial opportunities. At worst, they may act as brake on progress in the industry as a whole.

By contrast, if DNOs succeed in an effective evolution to DSOs, there will be new revenue generation opportunities. The transition to DSO should also facilitate significant efficiencies from optimised deployment of new technologies and methods along the entire value chain.

One important factor may point to an optimistic scenario.   Taking the UK as an example:  the existing DNOs have relatively large resource bases (though very much smaller than, say, National Grid) and are under diverse ownership.  It seems possible that within this ecosystem, experimentation should be possible that will quickly reveal which apparent opportunities are real or a dead end; and which managements are capable or sluggish.  Darwinian commercial processes may then steer the sector towards the most fruitful opportunities and the new best practices that will realise them.

In any event, the commercial risk profile of the rapidly evolving DNO is likely to increase quite noticeably over time.  Becoming a DSO, the proportion of its revenues that are underpinned by regulated monopoly will likely diminish with merchant activity increasing.  The cost of capital will rise correspondingly.  These factors will attract a different class of owner that can embrace and indeed drive the changes that are coming.

May Mannes joins Timera as a Managing Director.  See more details in our recent Angle here or May’s CV and background on Our Team page.


Russia, LNG & the next 3 years

European LNG import volumes set another new record in Apr-19, following the previous record set last month. Volumes are up about 230% compared to this time last year.

In the face of an onslaught of LNG, Russia has not flinched.  Import volumes from Gazprom in Apr-19 also set a new record.

A fascinating battle between Russian and LNG import volumes is shaping up across the next 3 years. In today’s article we look at two scenarios for European gas market supply & demand balance across 2019-21. We also consider the mechanisms available to absorb surplus LNG and how Gazprom may respond to lower prices.

European LNG imports depend on Asian demand

The more than doubling of European LNG imports since last summer is a function of global LNG supply outpacing demand growth.  The resulting surplus of LNG cargoes is being absorbed by Europe’s liquid North West European hubs (TTF & NBP).

We have a pretty good view of supply growth over the next 3 years given this relates to liquefaction projects currently under development.  The key uncertainty is the pace of growth in Asian demand.

In Chart 1 we consider two scenarios for Asian demand growth across 2019-21.  For simplicity we assume stable European gas demand at 2018 levels and net zero storage volumes across years.

The left-hand panel shows a high Asian demand growth scenario, the right-hand panel a low Asian demand growth scenario.

Chart 1: LNG market & European S&D balance under High & Low Asian LNG demand scenarios


Source: Timera Energy

Under the high growth scenario (left hand panel), there is a surplus of around 25 bcma of LNG in 2019 & 2020 flowing to Europe. This surplus is largely gone by 2021 as the current wave of new liquefaction has effectively been absorbed by that point.

The LNG surplus flowing to Europe is significantly larger under a low Asian demand growth scenario. This year’s surplus is 41.4 bcma, with further growth to a 63 bcma surplus in 2020 (the peak delivery year of the current wave of new supply).

So which scenario path are we following? Up until Winter 2018-19, Asian demand appeared to be on a ‘high growth’ trajectory. But demand has been softer over the last six months, in part relating to warmer weather across winter.  There has also been early evidence of a slowdown in economic growth in Asia.  The extent to which this slowdown continues (or rebounds) will likely determine which path LNG demand follows across the next 2-3 years.

How will the European market clear surplus LNG?

There are 3 key mechanisms that enable the LNG market to absorb surplus volumes (vs ‘business as usual’ demand):

  1. European switching: As European gas hub prices fall, gas-fired power plants become more competitive relative to coal plants, boosting power sector gas demand.
  2. LNG demand response: As LNG spot prices decline, some buyers may increase demand (particularly emerging Asian buyers e.g. India). We estimate around 10 bcma of potential incremental demand.
  3. US shut ins: Ultimately if European & Asian spot price levels decline to levels such that netback prices in the US turn negative, then US LNG export flows will decline as a form of supply side response. Volume response here is substantial at ~55 bcma (40 mtpa).

While there is upwards of 30 bcma of total power sector switching potential in Europe, this depends on relative gas, coal & carbon prices. Chart 2 shows an estimated switching range for German CCGTs vs coal plants. European hub prices in Summer 2019 are now well below that range, and power sector switching is already happening in significant volumes.

Chart 2: Key global gas price benchmarks & European switching price range


Source: Timera Energy

Chart 2 also shows our estimated shut in price range for US LNG exports, currently sitting around 3.55 – 4.30 $/mmbtu vs front month TTF prices around 4.72 $/mmbtu.

Given US shut in levels are approaching below, incremental power sector switching potential is likely to be limited before shut ins commence. This is particularly the case if coal prices continue to decline alongside gas prices. So, do not be surprised if significant volumes of US gas are temporarily shut in over the coming summer.

TTF forward curve prices however recover sharply from Winter 2019-20 (as shown in Chart 2).  Market pricing is consistent with an acute oversupply of gas across the current summer, but a recovery beyond. In other words, the market appears to be pricing in a continuation of higher Asian LNG demand growth.  If this turns out to be too optimistic, there may be more US shut ins required to clear surplus gas in 2020.

Russia vs LNG: who blinks first?

Gazprom has shown no inclination to pull back on European flow volumes in the face of the recent onslaught of LNG.  A recent OIES podcast on Russian gas sets out why the Russian political landscape may continue to push Gazprom towards high export volumes.

In the short-term, Gazprom could be viewed as foregoing short-term revenue by contributing to a TTF slump towards $4/mmbtu.  There are historic precedents for Gazprom reducing exports in response to lower prices (e.g. across the 2009-10 price slump).

But it is possible that Russia is pursuing a longer term more strategic objective in continuing to push gas into a well supplied European market.  By allowing TTF (& by arbitrage Asian LNG spot prices) to fall well below the break-even price required for new LNG projects (7-8 $/mmbtu), Russia may be targeting the delay of new liquefaction project FIDs across 2019-20.

In a recent article we detailed the substantial volumes of new LNG supply queued for FID. The 2019 slump in global spot prices does not make FID decisions easy, even if it currently looks like there could be a supply gap in the early to mid-2020s.

FID delays or cancellations would serve to bolster Russia’s market share of the European gas market over the next five years.  It would also support faster price recovery in the early to mid – 2020s.

The inability of Asian demand to absorb supply growth across Winter 2018-19 has pushed the European gas market into a new phase of intense market share competition between LNG and Russian pipeline gas.  The trajectory of Asian LNG demand growth is set to be the key arbiter of just how fierce that competition will become, especially across 2019 & 2020.

Headwinds for UK gas engine margins

When the UK capacity market was introduced in 2014, large grid connected CCGTs were anticipated to be the primary provider of new capacity.  Step forward five years and it is distribution connected gas reciprocating engines that have taken the largest share of the pie.

The success of gas engines has been driven by a combination of relatively low capital costs, very fast ramp rates, low start costs and attractive levels of embedded benefits to supplement wholesale & balancing mechanism (BM) margins. The challenge now confronting engine owners is that policy changes will remove most of the embedded benefits margin over the next 18 months.

This means that engine returns going forward will be firmly focused on wholesale market and BM margin.  Key structural drivers should support this merchant margin into the 2020s.  But the last two years have been more difficult for engine margins.  In today’s article we show a simple ‘backtest’ analysis of merchant engine margins, explore margin drivers and consider the broader implications for the UK power market.

The evolution of engine margins

Enthusiasm for gas engine economics was helped by very strong margins in Winter 2016-17 as a result of market tightness caused by large French nuclear outages (e.g. causing UK interconnectors to export rather than import power).  Enthusiasm was also fuelled by some very ‘optimistic’ consultant forecasts at the time that extrapolated similar conditions into eternity.

Chart 1 shows the reality of a return to much tougher margin conditions over the last two years, particularly across the last 12 months.  The chart shows value capture across the Day-Ahead market, Within-Day market and Cash-out prices for a 35% efficient embedded reciprocating engine, assuming a merchant value capture strategy.

Chart 1: Backtested merchant margin analysis for UK gas reciprocating engine


Source Timera Energy

Note the chart does not show ancillary (e.g. STOR/FR) or embedded benefits (e.g. triads, GDUoS) margin streams.  Cash-out price value capture numbers are based on a NIV chasing strategy.

Two warm winters have followed 2016-17 with UK electricity demand surprising to the downside. This has been exacerbated by an overhang of thermal capacity versus Capacity Market expectations (e.g. delayed retirements of Eggborough coal & Peterhead CCGT plants).

In addition, peak prices have been dampened by increasing volumes of engines running to try and capture triad period revenues. This is however a temporary dynamic that will fall sharply over the next two winters as policy changes see the triad benefit reduced to almost zero.

Cash-out price (or Net Imbalance Volume) chasing has become a key focus of engine portfolios. This relies on accurately forecasting cash-out prices and running associated imbalance volumes to generate value.  Margin capture from this strategy is being challenged by:

  • Increasing volumes of engines coming online and pursuing a similar strategy
  • Players using similar forecasting techniques to predict cash-out prices.

The volume of flexible capacity now chasing cashout prices significantly outweighs the average system imbalance volumes.  Asset owners are recognising that engine value capture will need to transition to a more conventional Balancing Mechanism bid/offer strategy over the next 2-3 years.

While conditions have been difficult, this does not spell the demise of the role of engines in providing peaking capacity. Just as it made no sense to extrapolate Winter 2016-17 conditions forward, it is unrealistically pessimistic to extrapolate conditions over the last 12 months.  It is normal for value capture from ‘out of the money’ peaking assets to fluctuate significantly across years: 2016 was a big year, 2018 was a tough one.

Two important implications of current environment

The evolution of engine margins is likely to have some broader implications for the UK power market.

Firstly, capacity market bids for engine projects will almost certainly rise. Investment cases that supported sub 10 £/kW capacity bids are being strongly challenged by current market conditions. GWs of ‘cheap’ new build and DSR related engines have helped pull down UK capacity prices since introduction of the capacity market. Engines will continue to play a key role in providing new flexible capacity in the 2020s.  But engine investment going forward is likely to require significantly higher capacity prices than the last T-4 auction.

Secondly, tough conditions could well trigger significant aggregation across UK peaking portfolios.  A strong trading and commercial analytics capability is quickly becoming a key differentiator across peaking asset portfolios, as the importance of wholesale/BM margin increases.  This capability is expensive to outsource and takes time & money to build in-house. Step forward 3-5 years and it would not surprise us to see several large players with strong commercial & trading teams dominating the provision of UK peaking flexibility.