Global gas price differentials

‘Asian natural gas prices are four times prices in the US’.  This is a striking statement that has got a lot of airplay over the last two years.   Pronounced inter-regional gas price spreads sit in stark contrast with a relatively narrow global price range for the other global energy commodities, crude oil and coal.

Global price divergence in the gas market is a function of two main drivers:

  1. It is expensive to liquefy, transport and store gas as LNG.
  2. The LNG market is relatively immature, with a limited volume of destination flexible supply (flexibility is constrained by source to destination restrictions imposed by long term contracts).

Physical and technological constraints mean it will always be a more expensive business moving gas than oil and coal.  But rapid growth in the LNG spot market, development of price signals and expansion of infrastructure will over time act to erode global gas price differentials.

Regional price drivers

Spot prices for natural gas delivered in July 2013 are shown in Chart 1 across different regions.

Chart 1: A July 2013 overview of global spot gas price benchmarks (USD/mmbtu)

lng prices

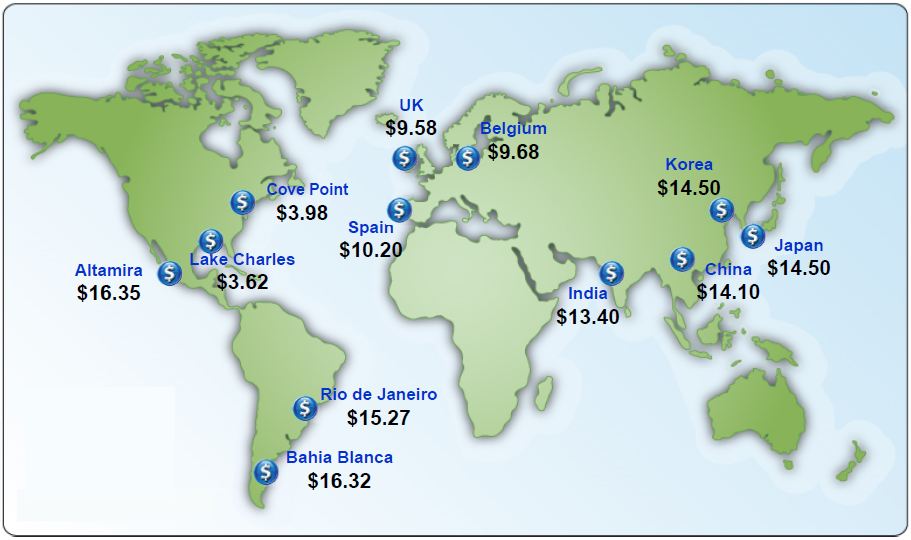
Source: Waterborne, US FERC (prices as at 7th June).

There are distinctly different drivers of spot gas prices across different regions of the world.  Regional pricing is best understood by grouping the markets illustrated in the chart into five regional zones:

North America  is a market where gas pricing is driven by trading at the liquid and transparent Henry Hub (HH).  Current HH spot price levels below $4/mmbtu, reflect the impact of a surge in unconventional shale gas production over the last 5 years.  A rapid transformation from tightness to oversupply and a lack of export infrastructure has effectively left gas ‘trapped’ in the US market.  But contango in the HH forward curve reflects a future of growing US exports and increasing production costs.

Northern Europe is also a market driven by liquid hub prices, primarily at the UK NBP, Dutch TTF and the German NCG.  But unlike North America, hub pricing tends to remain within a band of oil-indexed pipeline contract prices.  This reflects the dominance of these contracts in determining marginal price dynamics at European hubs.

Southern Europe is increasingly influenced by the larger and more mature Northern European market.  The Italian market has largely converged with European hub prices.  Spanish gas prices tend to be higher than those in Northern Europe to reflect the impact of oil-indexed contract prices and at times global LNG prices on marginal pricing.  But the relative isolation of the Iberian peninsula will decline given new interconnection under development with France.  European hub price convergence is likely to follow.

Asia is the key driver of LNG market growth.  Most gas is delivered under long term oil-indexed contract prices, typically signed at a substantial premium to US and European hub prices.  While oil-indexed LNG contract prices act as a loose anchor for Asian spot prices, substantial spot price swings are common.  Asian spot prices typically trade within a range between a European hub price driven ‘floor’ and an Asian oil-equivalency driven ‘cap’.   The prevailing spot price premium over Europe is a barometer for how much spot supply Asia needs to attract to satisfy demand.

South/Central America is a relatively small gas market by volume.  But buyers in countries such as Argentina, Brazil and Mexico can have a disproportionate impact on global spot pricing.  Buyers tend to have low levels of contract cover and often purchase LNG in ‘blocky’ parcels in the spot market or via shorter term tender.  In doing this they are typically competing for available LNG against Asian buyers.  Hence spot price levels tend to trade within a band of Asian spot prices.  Perhaps the greatest global pricing anomaly at the moment is the size of the premium that South/Central American buyers are paying over US gas prices.

What does the future hold?

As with most commodity markets, the market consensus view of future outcomes is heavily influenced by current market conditions.  The prevailing tightness and regional price divergence across the global gas market reflects a post-Fukushima world of strong Asian demand and a temporary hiatus of new liquefaction projects.  While these conditions are likely to remain until 2015, the second half of this decade may be a very different picture.

Pricing beyond 2015 will be driven by the balance of market power in the next phase of LNG market expansion.   Large new liquefaction projects in Australia, Canada and East Africa are looking for long term oil-indexed buyers to underwrite capital costs.  These projects are competing against US export projects that enable buyers to source Henry Hub indexed gas.  To a large extent the next phase of LNG market expansion will depend on the scale of a much anticipated surge in Chinese import demand.  But the drivers behind Chinese LNG demand are complex and any significant disappointment in demand growth could well tip the gas market back into a state of oversupply later in the decade.

The global gas market may currently be characterised by regional price divergence.  But with growth in the LNG spot market and the development of new infrastructure, structural price premiums like the one between the US and Asia will be eroded.  The cost of moving and storing gas will prevent global gas market convergence to the extent it has occurred in oil and coal markets.  But as the LNG market evolves, it is transport cost differentials rather than structural price premiums that will drive inter-regional price spreads.

Beware of proxy risk

Supply contract pricing terms are a key driver of marginal gas pricing dynamics in spot and forward markets. Contract prices can vary widely and terms are typically highly confidential. However similar structures tend to be used to price gas in different regions. For example Russian gas into Germany is predominantly indexed to gas oil and fuel oil on a six to nine month time lag.

The similarity in contract structures mean that proxy curves can be used to project the evolution of contract prices, as we set out in a recent article. Using proxy curves to gain an insight into the evolution of contract prices has important commercial applications. For example:

  • Market analysis: Proxy prices for oil-indexed Russian supply contracts can be used to understand the influence of flexible Russian contract volumes as a key driver of European hub pricing dynamics
  • Asset and contract valuation: Using proxy prices to understand the evolution of existing supply contract price levels is an important input when valuing new gas supply contracts
  • Hedging: Proxy prices can be used to calculate the forward exposures of a portfolio supply contract to liquid traded products in order to support forward hedging decisions

The application of proxy curves however comes with a few health warnings.

Getting a handle on proxy risk

The use of proxy relationships in market analysis, asset valuation or hedging decisions can add additional risk that warrants explicit consideration. Proxy risk is where outturn prices differ from those implied by the proxy relationship leading to unexpected financial loss or gain.

There are two main causes of proxy risk:

  1. A poorly fitting proxy relationship between contract price and the underlying traded products to which it is indexed
  2. Implied exposures evolving or breaking down over time (e.g. from the increasing influence of gas hub pricing on European contract prices).

The first cause can be managed via a diligent proxy development process and common sense in proxy application (i.e. don’t place too much weight on a poorly fitting proxy). The second is more subtle and requires regular reassessment of the proxy curves to test integrity and suitability.

Case study: Proxy risk and the Average German Import Price

Arguably the most important use of proxy analysis in the European gas market relates to the opaque pricing of pipeline import contracts.  It is common to use a proxy curve to forecast the value of the Average German Import Price (AGIP) published by the German ministry.

AGIP is an ex-post assessment of prices of gas imported into Germany.  The vast majority of imported gas is under long term pipeline contracts indexed to gas oil and fuel oil (primarily Russian but also from the Netherlands and Norway).  As such AGIP proxies will show strong relationships to averaged and lagged gas oil and fuel oil prices.  However the basket of imported gas changes over time causing changes in the best fit proxy.

As an illustration, we have fitted a gas oil and fuel oil proxy for each of the last 5 years (i.e. each year, 12 months are added to the data used to calibrate the proxy to assess how it evolves).  For simplicity we have used (9, 1, 1) – 9 month average, 1 month lag, fixed for 1 month – averaging logic for gas oil and a (3, 1, 1) for fuel oil and held this constant over all years for ease of comparison.  In practice a better fit could be found using more complex averaging rules.  The “best-fit” may also vary from year to year.  The table below summarises the constants, coefficients and R2 for each year.

Table 1: AGIP proxy parameters

Constant GO slope FO slope R^2
Oct-08 501 9.4 4.3 99%
Oct-09 159 11.1 2.8 98%
Oct-10 40 11.3 2.7 97%
Oct-11 662 10.9 0.8 93%
Oct-12 1,423 10.6 -1.0 92%

The chart below shows the prices as predicted by each of the proxy curves against the outturn AGIP prices.

Chart 1: Evolution of AGIP proxy curves

 AGIP Proxy Evolution

Both the table and chart illustrate proxy risk in relation to AGIP prices.  This can be seen in the chart where the 2008 and 2009 proxy curves provide a relatively good forecast of future prices, but the relationship starts to breakdown from the end of 2010 as actual prices disconnect from forecast prices.  Relying on the 08-09 proxy relationship would have resulted in realised prices being structurally different from forecast, potentially distorting contract valuations and exposure measurement.

The breakdown in proxy relationship is also shown in the parameters of the proxy curves.  The R2 (a measure of how well the proxy fits the historic data) begins to fall in later years.  The coefficient for each subsequent regression also becomes less stable reflecting the changing influences of the price of German imports.

As an example of proxy risk impacting hedging decisions, AGIP was used as an indexation term in the Ruhrgas release auctions in the mid 2000.  This meant that development of an AGIP proxy curve was important for informing pricing and hedging decisions (i.e. the slope coefficient can be used to imply the exposures to gas & fuel oil).  If the AGIP proxy relationship had not been adjusted for changes in index or market conditions, proxy analysis would have likely resulted in unobserved residual oil and FX exposures.  The gas oil coefficients implied for the proxies are relatively stable but the fuel oil less so (actually changing sign in the last year).

The breakdown and evolution of the AGIP proxy behaviour is consistent with the changing influences over the pricing of German imports.  For example, growing levels of gas hub indexation and changes from reopener negotiations will both influence proxy price behaviour, requiring a re-adjustment of proxy fit.  An initial starting point is to introduce gas hub prices into the proxy to improve the fit.

Proxy risks do not invalidate proxy analysis. Proxy curves are a useful tool in support of market analysis, asset valuation and hedging decisions. But it is important to define and understand the factors that may drive differences between outturn and projected prices. Most importantly an appreciation of proxy risks strengthens the commercial applications of proxy analysis.

Feeling the pain of European generators in 3 charts

Conventional generation portfolios in Europe have had a tough two years.  The policy environment has been hostile and the slide in wholesale power prices unrelenting.  As load factors on thermal plant have declined, utilities have scrambled to reduce their generation cost base and increase asset flexibility.  But these actions have done little to stem earnings erosion at a time when most balance sheets are already under pressure.  Material from a recent RWE investor presentation provides a useful case study for the plight of the generation businesses of European utilities. 

Policy and market headwinds

We have set out in a number of previous articles the drivers behind the deterioration of thermal generation margins.  The key driver has been a substantial and growing overcapacity problem across much of North West Europe, particularly in Germany.  Large volumes of subsidised renewable capacity have been developed by investors who are insulated from market price signals via ‘feed in tariff’ policy support.  This has coincided with a period of weak demand.

The impact on gas-fired generators has been exacerbated by a decline in competitiveness as coal prices have softened.  Gas plants have been driven out of the merit order in Continental Europe as spark spreads have continued their decline into negative territory, illustrated for Germany in Chart 1.  Full auctioning of carbon credits has not helped either, although the influence of carbon has diminished with EUA prices under 5 €/t.

Chart 1: The evolution of German forward spark and dark spreads

spreads

Source: RWE Supply and Trading

Conventional generation has become a value drag

RWE has recently provided some insight into the pain that its 44GW of conventional generation assets are inflicting on its portfolio across DE, UK and NL.  RWE states that 20-30% of its conventional generation assets are suffering negative free cash flow.  This is presumably driven by gas plants that are not earning a return that covers station fixed costs.  A further 20% of plants are under water on an Operating Result (OR) basis (once non-cash overheads are factored in), with OR either negative or below weighted cost of capital (WACC).  This is a pretty grim picture for a generation portfolio that has historically been one of the pillars of RWE’s business model.  It is also illustrative of a problem that most European utilities are facing.

Chart 2: A generation portfolio under pressure

profitability

Source: RWE Supply and Trading

Reacting to the pain

RWE and other utilities are responding to this environment by cutting operating costs, mothballing plant and in some cases closing or selling assets.  Negative sentiment by the big utilities is reflected in unusually high levels of forward hedge cover on generation portfolios.

The decline in RWE’s projected returns on conventional generation assets is illustrated in Chart 3.

Chart 3: RWE’s vision for the future

impact

Source: RWE Supply and Trading

This chart raises the interesting question as to how utilities are going to replace declining generation margins.  Here the approach across European utilities is somewhat different.  But there are some consistent themes:

(i)  An increasing exposure to renewable energy

(ii)  A shift outside the comfort zone of the core utility business model e.g. via growing upstream gas/oil exposure

At first glance (i) appears logical given it is renewable assets that are claiming generation market share from conventional assets.  But when it comes to renewable investment the low hanging fruit have been plucked.  New projects tend to be increasingly capital intensive and/or risky.  An increasing consumer awareness of the cost of policy support is also creating headwinds.

Utilities such as Centrica have been focused on (ii) and there again appears to be an attractive portfolio synergy logic.  Exposure to upstream gas reserves can offset the negative impact of rising commodity prices on retail margins, in a world where tariff increases are under constant regulatory scrutiny.  Centrica is a well managed company and a better bet than most to pull off this transition.  But history has not been kind to energy companies or utilities that have based their growth plans on a step away from core business.  Successful upstream companies have also typically had a very different capital structure and risk profile to utilities.

Time will tell whether European utilities transform or shrink, but in the meantime deteriorating market conditions are likely to cause implicit or explicit writedowns in coventional asset value.  Asset owners are striving for plant with a low fixed cost base and high flexibility.  But for a number of older and less flexible thermal assets, the numbers do not add up.  We suspect a more substantial capacity clear-out is still to come and this is just what is needed to stabilise the returns on remaining assets.

A snapshot of incremental supply and demand in the LNG market

There is set to be a shift in the tectonic plates of the global LNG market in the second half of this decade.  Large uncontracted volumes of new supply in Australia, Canada and East Africa are competing with US export projects to serve what is anticipated to be strong growth in import demand, particularly from developing economies.

However there is little in the way of new LNG supply that will come into the market before 2015.  So the dynamics over the remainder of the first half of this decade are likely to be quite different.  The rapid expansion of new liquefaction capacity over the 2009-11period is now over and LNG supply in the medium term looks to be relatively inelastic.  The evolution of LNG pricing over the next two to three years will to a large extent be determined by fluctuations in demand from uncontracted buyers (e.g. China, India, Brazil and Argentina) as well as Japanese nuclear restarts.  An analysis of incremental supply and demand in 2012, services as a useful indication of things to come over this medium term horizon.

A decline and shift in global supply

Chart 1 shows a snapshot of incremental changes in supply over the 2012 year.

Chart 1: 2012 incremental supply

2012 inc supply

Source: BG/Waterborne

There are two key factors at work.  A number of developing countries that are existing LNG exporters, are struggling with feedgas issues (e.g. Indonesia, Algeria and Egypt).  Strong domestic gas demand is eating into the feedstock for LNG export terminals.  Contractual obligations are typically being met, but there has been a reduction in uncontracted gas exports.  As an offset to this decline in supply, there have been several new LNG projects that have come online (e.g. Pluto in Australia) or existing LNG facilities that have increased exports.  But the net effect is clear.  Global LNG supply declined in 2012, a rare event historically in what has been a rapidly expanding market.

A more pronounced shift in global demand

Chart 2 shows a snapshot of incremental changes in demand over the 2012 year.

 Chart 2: 2012 incremental demand

LNG 2012 Incremental Demand

Source: BG/Waterborne

A clear trend can be seen from this data, with spot market buyers paying a price premium to attract supply away from Europe (and to a lesser extent North America).   Japan is an outlier with its 2012 demand reflecting a continuation of LNG purchases to make up the shortfall of gas post Fukushima.  But the other incremental buyers of LNG tend to be developing economies with relatively low levels of long term contract cover.

Watch these trends going forward

Any changes in the trends shown in 2012 will likely accompany a change in price dynamics.  An increase in feedgas issues or a rise in developing economy demand could materially tighten the global market and increase the spot price premium over European hubs.  On the other hand, a weakening in Asian growth or a sharp decline in Japanese demand due to nuclear restarts could drive global LNG spot price convergence.  The 2012 snapshot provides a useful insight into the drivers that are likely to prevail in the LNG market over the next 2 to 3 years.

Proxy curves for gas pricing

European and Asian gas markets are dominated by long term oil indexed pipeline and LNG supply contracts. The pricing of these supply contracts is a key driver of spot and forward market price dynamics. But because these contracts are highly commercially sensitive, publicly available contract price data is hard to come by. This is a particular problem for price benchmarks over a forward horizonA common approach to filling this gap is to develop a proxy for the evolution of prices based on observable market price data for traded products.

Uses of proxy curves

There are many uses for proxy curves but these can broadly be grouped into two areas.

  1. Forecasting future price benchmarks for price series that are not directly observable:
    • Understanding the future pricing of flexible supply contract volumes which are a key driver of marginal market pricing.   For example, Russian supply contract prices are a key driver of the evolution of European spot and forward hub price dynamics. So a Russian supply contract price proxy can be used to analyse hub price behaviour.
    • Forecasting and valuing indexed contract prices which have components that have no directly observable forward curves (i.e. developing a proxy for the index components).  For example, some gas contracts formulas include oil product indices published government departments which have no forward prices available.  A proxy for these indices can be used to forecast contract price, facilitating valuation of the contract.
  2. Analysing the implied exposures that influence a price series:
    • Analysing the evolution of contract pricing influences.  For example, it is possible to derive the evolution of the Asian LNG “S-Curve” slope or level against crude over time.
    • Analysing and hedging implied exposures arising from contract indexation to non-standard prices.  For example, the early Ruhrgas release gas auctions in the late 2000’s had the option to index to the Average German Import Price (AGIP) published by the German ministry.  Developing a proxy for AGIP allowed the implied fuel oil and gas oil exposures to be calculated and hedged.

Methodology for developing proxy curves

The basic methodology involves developing a formula that allows the future values of a price series to be modeled as a function of price variables with transparent forward price data.  A regression approach is typically used to identify the best fit linear equation against variables with different combinations of lagging and averaging rules.  The basic linear equation is given below:

       proxy pricet = a + b × component price1 (x1, y1, z1) + c × component price2 (x2, y2, z2) + …

       where:

a is the intercept (equivalent to fixed price element of the formula)

b, c are slope coefficients that define the influence (or exposure) of each component

(x, y, z) are the averaging rules of each component (lag, averaging periods, duration)

The regression allows the values for the constants (a, b and c) to be calculated but the different combinations of price component averaging are pre-calculated.  Other more complex (e.g. non-linear) relationships are also used but are less common.  The attraction of using a linear relationship is that it mirrors the structure of most contracts and linear regression is a relatively simple and accessible technique.  The basic methodology is outlined in the diagram below.

Diagram 1: Proxy curve development methodology

proxy methodology

The key outputs are the intercept and variable (component) coefficient or slope.  The coefficient holds important information regarding how much exposure is implied by the proxy.  The detailed lagging and averaging rules define the delivery periods of the exposure.  At a high level the slope defines the implied influence that the components have over the prices that are being forecast.  If the proxy is being used to forecast a contract price, these coefficients provide important information on the implied exposure which can be used to inform hedges.

Case study: Developing an Asian LNG proxy

Developing a view on forward Asian LNG prices is important for understanding global gas market dynamics, given the influence Asian pricing has on the LNG market.  Despite some development in prompt indices there is no transparency in Asian forward pricing and as a result it is common for analysts to develop a proxy for Asian LNG prices.

Crude oil is the predominant indexation term in Asian LNG contracts so it is a natural selection to use as the single proxy component.  To demonstrate the concept we have developed a proxy for the World Bank Asian LNG price series against Brent crude.  The table below shows the results of simple linear regression against a number of combinations of lagging and averaging rules.

Lag Average Duration Intercept Coefficient R2
1 1 1 3.5 0.102 65%
2 1 1 2.54 0.113 79%
2 3 1 1.57 0.124 88%
2 4 1 1.25 0.127 89%
3 1 1 2.02 0.119 87%
3 2 1 1.83 0.121 87%

For simplicity we have selected the proxy with the highest R2 (in red) but in practice there are other secondary issues which should also be considered.  The chart below shows the actual price series against the fitted values and also the forecast of LNG prices based on the current Brent forward curve.

Asian LNG proxy v2

The World Bank Asian LNG benchmark is an assessment of average LNG prices that includes both contracted and spot purchases (the later only recently being included).  As such it is influenced by the terms of long term contracts and short term fundamentals. Nevertheless the fitted proxy highlights many of the standard terms in long term contracts (e.g. the lag aligns to the lag of the JCC crude benchmark commonly used in contract indexation to Brent).

It is interesting to note the influence of Brent curve backwardation on forward Asian LNG contract prices.  The slope coefficient is significantly below crude parity (approx 17 %) but its value is highly sensitive to the historical periods included in the regression which highlights the evolution of the weighted average slope coefficients in long term supply contracts.

Proxy curves provide a useful means for analysing the evolution of supply contract price dynamics. However proxy curves should also come with a health warning.  The use of proxy prices to support commercial decision making (e.g. asset valuation and risk management), introduces proxy risk which warrants careful consideration.  This is a topic we will focus on in a subsequent article that addresses some of the issues associated with the application of proxy curves.

Emerging influences of the German power market

In a recent article we set out the impact of the rapid increase in renewable production on the German market.  Because Germany is at the core of the European power market, with large volumes of interconnection to its neighbours, Germany is exporting the impact of its aggressive renewable policy across North West Europe.

Overcapacity in Germany is driving down European power prices and crushing gas plant load factors.  At the same time, intraday price shape is decreasing and spot volatility increasing as growing volumes of German intermittent capacity impact marginal pricing.  In response, forward market liquidity is falling along the curve and becoming more focused in the prompt.  These trends are set to continue as renewable capacity expands.

Overcapacity and changes in marginal pricing 

German policy support for renewable capacity has lead to a surge in new generation capacity at the same time demand has slumped as a result of the financial crisis.  As this growth in low variable cost generation impacts marginal pricing, Germany’s renewable policy is effectively subsidising lower power prices across North West Europe.  This is clearly of benefit to consumers but is creating headaches for owners of gas plant as load factors and returns plummet.  The German transition to renewable capacity is acting to materially change market price dynamics.

The German merit order is different from its neighbours to the west, given a capacity mix with much larger volumes of hard coal and lignite capacity.  Lower variable cost coal and lignite have moved into a key marginal price setting role across North West Europe as renewable output has increased and coal prices weakened relative to gas.

German power exports tend to be larger across the winter months when German coal is displacing more expensive gas capacity in neighbouring markets, particularly the Netherlands and France.  There have also been periods of high offpeak exports to the Netherlands and France as robust renewable production in Germany pushes cheaper coal and lignite on to the margin.  The role of coal as the dominant German price setting capacity is clear in Chart 1 showing output by generation type in Nov 12.  This chart also shows examples of evenings and weekends where robust renewable output and low demand have pushed cheaper lignite capacity onto the margin, in turn driving higher export flows.

Chart 1: Nov 12 German production by fuel type

Nov 12 actual production

Source: Electricity production from solar and wind in Germany in 2012.  Prof. Dr. Bruno Burger (Fraunhofer ISE)

Transitions in shape, volatility and liquidity

The impact of the surge in German renewable capacity has been felt most acutely in the prompt horizon.  Price shape is now a function of system demand net of renewable output which can vary significantly from one day to the next.

But there are some important trends in renewable output.  Both solar and wind production tend to be more pronounced in the day time hours as illustrated in Chart 2.  This has acted to flatten intraday price shape to the extent that there have been periods where peak prices have fallen below offpeak.

Chart 2: May 12 solar and wind vs conventional German production

May 12 production

Source: Electricity production from solar and wind in Germany in 2012.  Prof. Dr. Bruno Burger (Fraunhofer ISE)

The intermittent nature of renewable capacity, in particular wind, is also driving sharp intraday price swings.  Changes in renewable production can cause sharp movements in the power price as the marginal price setting capacity changes.  Price volatility is increasingly being influenced by much cheaper lignite or even nuclear and renewable production coming on the margin.  As a result there have been a number of cases of zero or negative prices.

The upshot of overcapacity and higher prompt volatility has been a shift in forward market liquidity to the prompt horizon.  Volatility along the curve has been crushed by the capacity overhang, reducing both speculative and hedging activity.  Prompt volumes on the other hand are reacting to an increase in portfolio hedging requirements to manage short term volatility and an associated increase in speculative trading activity, as shown in chart 3.

Chart 3. EPEX Day Ahead Prices and Volumes

EPEX Prices and Liquidity

Source: EPEX

Expect more of the same?

To the extent that renewable capacity continues to be rolled out in Germany, the influences described above are likely to continue, becoming more pronounced over time.  The German power market is also the canary in the coal mine for other European markets pursuing aggressive renewable targets.

But as the German election approaches in September, Germany will also provide an important indication of the political will across Europe to continue the aggressive transition to renewable energy in the face of ongoing economic weakness.  European power market dynamics are evolving rapidly with the roll out of renewable capacity.  But the pace of future change is increasingly becoming a function of political will.

Faith shaken in grandfather Groningen

The vast Groningen gas field in the Netherlands plays an important role in the delivery of both supply and flexibility to the North West European gas market.  Low level seismic activity has been directly associated with extraction of gas at Groningen for over 15 years. But a 3.4 magnitude quake in August 2012 has raised serious questions as to the consequences of maintaining current production levels.

An investigation is underway, focused on (i) the increasing probability of higher magnitude quakes with further field depletion and (ii) the need for reductions in production to mitigate the risks associated with further quakes.  Any reduction in the volume and flexibility of Groningen production schedules may have important implications for the EU gas market.

A pillar of European supply

The Groningen gas field in the north east of the Netherlands is one of the key production resources around which the European gas market has evolved over the last 50 years. The field was originally discovered in 1959 and commissioned four years later in 1963.

On commencement of production, Groningen contained an estimated 2.8 tcm of reserves, enough to supply Germany for over 30 years.  To put the size of the field into perspective, it is more than twice the size of the Troll field (the second largest in Europe) and is around the 10th largest field discovered in the world.

Chart 1: Location of the Groningen gas field

field map

Source: energy-pedia.com

The Groningen field is also a key provider of seasonal flexibility to the NW European market.  Chart 2 shows the highly seasonal pattern of Dutch gas production, with Groningen providing the significant majority of seasonal shape.

Two gas storage facilities, Norg and Grijpskerk, are used to enhance the seasonal flexibility provided by Groningen whilst smoothing the actual production from the field itself.  In fact from a regulatory perspective these storage facilities are considered to be additional production facilities.

Chart 2: Monthly Dutch gas production

shape

Source: Eurostat

Shaking the faith

Low level seismic activity has been associated with extraction of gas at Groningen for over 15 years.  But on the 16th August last year, an earthquake measuring 3.4 on the Richter scale occurred near Groningen. This was the strongest quake to date and has caused the most associated damage.

This more pronounced seismic activity in 2012 has raised concerns among local residents, leading to a more detailed investigation of:

  1. How strong the earthquakes may become given the current rate of extraction and
  2. Whether cuts in production may be required to minimise the risk to infrastructure which is ill equipped to withstand significant tremors.

The size and frequency of quakes in relation to production volumes are illustrated in Chart 3.

Chart 3: Monthly Groningen production and seismic activity

production

Source: Reassessment of the probability of higher magnitude earthquakes in the Groningen gas field – State Supervision of Mines.

Government response

The Dutch Government’s response was outlined in a letter by Henk Kamp (the Minister of Economic Affairs) to the Dutch parliament on 25th January 2013.

Following the August 2012 earthquake, the State Supervision of Mines (SodM), the field operator (NAM) and the Royal Dutch Meteorological Institute (KNMI) all carried out  investigations with the following key conclusions:

  • Since 2000, Groningen production has increased from around 20-30 bcm to 45-50 bcm and the number and strength or tremors have increased proportionally.
  • The link between gas production and low level seismic activity is well established, with the KNMI assuming that the maximum magnitude of earthquakes arising from Dutch gas extraction would be 3.9 on the Richter scale.  But investigation lead to the conclusion it was now not possible to accurately predict the maximum magnitude from historical data.
  • Based on the evidence of earthquakes in other gas producing basins around the world, KNMI has indicated that the maximum range could be 4-5 on the Richter scale.
  • SodM estimated that there is a 7 per cent change of an earthquake greater than 3.9 occurring in the next twelve months.
  • SodM has advised that gas extraction should be reduced by as much and as quickly and feasibly possible to reduce the number of further earthquakes.

The response from the Dutch government has so far been measured, balancing the concerns of local residents against the commercial and economic impacts of reducing production.  The Government has tried to provide assurance to local residents that compensation will be available in the event of earthquake damage.  They have also endorsed the NAM initiative to provide assistance for the assessment of structural risk and contribute to the cost of any remedial works.  NAM has already allocated an additional EUR 100m to support the latter (in addition to existing earthquake compensation schemes).

The Government has estimated that an annual 10 bcm (20%) production reduction from the Groningen field would result in reduced taxation of around €2 billion. This gives an indication of the scale of the fiscal and economic impact from any mandated reduction in production.

The Government have requested that NAM commission further technical studies to get a more accurate assessment of the potential maximum earthquake magnitude as a function of production. NAM has a deadline of 1 Dec 2013 for submitting a revised production plan which will be assessed by SodM.  The government has also requested a review of alternative production techniques that may allow the same rate of production with reduced earthquake risk.

Gas market implications

Although Groningen is a mature field, it is still a key provider of supply and flexibility into the NW European gas market.  From an annual supply/demand balance perspective, the shortfall from say a 10-20 bcm of Groningen production (20%-40%) could be fairly easily met by increased pipeline imports (e.g. from Russia).  Meeting this shortfall may however act to tighten the gap between hub and oil-indexed contract prices.

Another consideration is that the Groningen field produces low-calorific gas (used extensively in central heating boilers and domestic cooking). There are limitations around processing capacity to convert hi-cal to low-cal gas (through the addition of nitrogen) which means it is not necessarily straightforward to backfill any lost production from Groningen with hi-cal imports.  This increases the possibility of a two tiered gas market for hi and low-cal gas (even if only on a temporary basis while conversion capacity is added).

Perhaps most interesting but less clear cut is the effect any production restrictions may have on the pricing of seasonal flexibility.  In a report on the impact of Groningen production on seismic activity, prompted by the August 2012 Earthquake, the SodM made the observation that:

“higher magnitude earthquakes seem to occur with a delay of 6-9 months following a winter peak production period.”

If this observation holds up under closer inspection, it raises the possibility of a greater impact of restrictions on peak production.  This is likely to reduce the ability of Groningen to supply seasonal flexibility, although it is unclear how such restrictions would apply (particularly in the context of the Norg and Grijpskerk gas storage facilities).

Until further investigations are completed, uncertainty around the scale and impact of Groningen production restrictions will remain.  But if restrictions are imposed that significantly reduce the ability of Groningen to supply seasonal flexibility, this should support summer/winter price spreads.  In the current environment of low returns for flexibility, this may be a rare piece of good news for owners of gas storage assets.

Japanese nuclear restarts and the global gas market

Japan is the elephant of LNG importing nations.  Japanese demand accounts for about 35% of global LNG imports, dwarfing South Korea in second place (at around 15%).  The post Fukushima closure of Japhttps://timera-dev.positive-dedicated.net/wp-admin/post.php?post=3360&action=editanese nuclear reactors and the resulting increase in gas-fired generation sent shockwaves through the global gas market in 2011.  This step change in Japanese demand has been the primary driver underpinning the current phase of global gas market tightness that has prevailed since Q1 2011.

As a result of the nuclear closures, Japan is now confronting an explosion in energy costs as import volumes of gas and oil have increased at the same time the yen has declined.  Nuclear power remains deeply unpopular in Japan.  But the new Japanese government is confronting the harsh reality that it cannot afford a nuclear free future.  The scale and pace of Japanese nuclear restarts will be instrumental in shaping the evolution of the LNG market over the next two years.

The numbers:

The post Fukushima shutdown of Japan’s 54 nuclear reactors has caused a sudden increase in Japanese energy import dependence.  In the absence of nuclear power, the world’s third largest economy is only 4% energy self sufficient.

Japanese imports of LNG have increased to 87 mtpa in 2012, up 25% from the 70 mtpa pre-Fukushima import volume in 2010.  Average LNG import prices for Japan have also increased, by around 55% in USD terms from approximately 11 $/mmbtu in 2010 to approximately 17 $/mmbtu in 2012.  Over the same period, the total yen value of LNG purchases has increased by more than 70 percent from about 3.5 trillion yen in 2010 to 6 trillion yen in 2012.

The recent depreciation in the yen, around 20% against the USD since Q4 2012, has caused another jump in the cost of Japanese LNG in 2013.  The restart of nuclear reactors may be politically unpopular, but by delaying nuclear restarts Japan risks crippling its economy with rising energy costs.

There is considerable uncertainty around the regulatory process, timing and number of reactor restarts.  Initial restarts will likely displace more expensive oil-fired generation ahead of gas-fired power plant.  But there can be no doubt that a return to nuclear generation will materially reduce Japanese LNG demand.

The chart below from Reuters shows the impact the Fukushima disaster has had on monthly LNG consumption since Q1 2011.

Chart 1: Monthly Japanese LNG consumption (mt)

Japanese LNG demand

The politics:

Shinzo Abe’s Liberal Democratic Party (LDP) government was elected in a landslide in Dec 2012 on a platform of radical economic reform.  Central to this reform has been a ‘strong-arming’ of the central bank (BoJ) into a massive programme of quantitative easing in an attempt to (i) raise inflation expectations and (ii) devalue the yen to support Japanese exporters.  Japan’s monetary easing at $65 billion per month now dwarfs US quantitative easing on a GDP adjusted basis.  It is the anticipation and implementation of this radical shift in monetary policy that has lead to the rapid depreciation of the yen since Q4 2012.

As the yen has declined, the increasing cost of energy (particularly LNG) has caused a pronounced shift in Japan’s balance of payments.  A perennial trade surplus has been replaced by sharply rising trade deficits.  In other words the increased cost of energy is more than offsetting the benefit of a weaker yen for Japanese exporters.

Japan is to a large extent hostage to the global market price for oil and LNG, although the Japanese government has been lobbying Obama to approve US exports of LNG to open up a new source of supply competition.   The most obvious mitigation measure the government has to combat the economic pain from rising energy costs is the fast tracking of nuclear restarts.

The practicalities:

Only two of Japan’s 54 reactors have been restarted since the Fukushima earthquake.  The main hurdle that Japanese utilities face before restarting further reactors is compliance with a revised set of safety standards, shortly to be enacted by the Nuclear Regulation Authority.  This regulatory hurdle means the timing of start-ups is uncertain, but current expectations are for reactors to start returning to service from early 2014.

Restarting nuclear reactors has the obvious primary benefit of reducing the volume and hence cost of Japan’s energy imports.  A less obvious but important secondary benefit, comes from Japan’s status as a key driver of marginal global LNG pricing.

Just as nuclear closures caused a tightening in the LNG market in 2011, nuclear restarts will be likely to have a dampening effect on global LNG pricing going forward.  This should act to reduce Japan’s cost of future gas import volumes.  It may also act to increase the potential overhang of new sources of supply later this decade (e.g. Australia, US exports, Canada, East Africa).  The bottom line is that nuclear closures have increased Japanese LNG demand by approximately 15 mtpa (21 bcma).  This equates to around 6% of global LNG demand.   So any concerted return to nuclear generation by Japan is likely to have a significant impact on the global LNG supply/demand balance and in turn on price levels.

There has been much fanfare surrounding the introduction of ‘Abenomics’ in Japan over the last 6 months.  Whether this has any real long run impact on an economy that is mired in debt remains to be seen.  But aggressive monetary policy that targets yen devaluation increases the pressure on the Japanese government to accelerate nuclear restarts.

Gas indexation in Europe – a tipping point?

The increasing level of gas hub indexation in European supply contracts has been a key factor behind the evolution of the gas market over the last 5 years.  The momentum behind hub indexation has grown as North West European hub prices have consistently traded below oil-index contract levels since the financial crisis.  This has acted to both develop hub liquidity and transparency as well as opening up a painful gap for suppliers between long term contract costs and short term retail contract pricing.

Whilst coming up with reliable assessments of the aggregate levels of gas indexation across European supply contracts is very difficult, there is undeniable evidence of an accelerating transition to hub indexation.  But simple assessments of the levels of oil vs gas indexation overlook the dynamics that ensure that oil prices will be a key driver of hub price formation for many years to come.

Current levels of gas indexation in Europe

The chart below shows recent OIES and Reuters assessments of the levels of gas indexation by European supply source.

Chart 1: Two views of aggregate European supply contract indexation

Gas indexation

Source: Timera Energy based on data from Reuters and OIES (Oxford Energy Forum – August 2012)

As a third data point SocGen  recently announced that they believe less than 50% of gas supplies will be linked to oil in 2013.

It is almost impossible to get an accurate assessment of gas indexation levels and growth.  Most of the supply contracts are structural long term portfolio contracts with highly confidentially sensitive.  Typically contract terms and conditions have evolved over time through the processes of renegotiation and price re-openers.

It also relatively easy to poke holes in the top down estimates above.   For example, before the development of the NBP as a liquid hub, much of the gas coming into the UK from the North Sea was sold under long term contracts with strong components of oil indexation.  While these contracts have mostly been de-dedicated from the field themselves and subject to many contract revisions over time, they still contain a large element of oil indexation.   As a result it is optimistic to assume 100% of gas from the UKCS is gas linked.  However, there is an undeniable trend of growth in gas indexation.

Gas vs oil indexation through the eyes of the re-opener

The gas vs oil debate has been in focus recently through the lens of re-opener negotiations and arbitrations.  Here the key producers have taken opposite positions.

Statoil have been more willing to accept increased levels of indexation to NWE hubs and have stated that they expect the majority of their supplies in the future to be hub indexed.    And they put their money where their mouth is last year by signing a 10 year 45 bcf supply deal with BASF primarily linked to the German hubs.

Gazprom and the North African producers have been more vociferous in their defence of oil indexation.   Re-opener disputes have resulted in some concessions but these have been focused on temporary adjustments of absolute price levels.  Gazprom have been very vocal in their public defense of oil indexation and have given only marginal concessions in terms of increased linkage to gas in reopener settlements with major NWE suppliers.  However it is interesting to note that Gazprom, through its marketing and trading arm (Gazprom M&T), have signed a 3 year deal with Centrica to deliver 2.4 bcm gas to the UK entirely priced off the NBP.

If the Centrica deal is a sign of a strategic shift from Russia, then a more rapid transition to hub indexation is on the cards.  But rather than this being an indication of a step change in position, it is more likely to be a result of Gazprom confronting the fact that, given the prevalence of gas indexation in UK wholesale and I&C contracts, it is almost impossible to find a buyer for an oil-indexed gas.

As the continental markets transition towards gas indexation as the standard for pricing sales to large end users, it becomes increasingly difficult for incumbent suppliers to bear misalignments between exposures in their supply contracts and retail portfolios.  There has been a pronounced shift of large gas consumers on the continent following the long established UK precedent and requesting hub indexed gas as an alternative to standard fuel and gas oil formulas.

The influence of oil is here to stay

The original reasons for oil-indexation are mostly irrelevant to today’s European gas market.  It is difficult to make a compelling commercial case for the retention of oil indexation as the predominant pricing influence.  However, the influence of oil prices on European pricing dynamics will remain for many years.

Firstly, the legacy long term contracts (in some case 20+ years) that underpin most European pipeline imports are still predominantly oil-linked.  The flexible volumes (typically above 85% take or pay) are a key source of marginal supply, allowing suppliers to manage overall portfolio balance.  This means they will continue to have a disproportionate influence on hub pricing.

Secondly, much of the incremental supply will only flow into Europe against an oil linked threshold or opportunity cost alternative.  In the coming years, un-contracted Russian production promises to be a key source of incremental supply which is likely to be strongly influenced by oil linked benchmarks.  In addition, flexible LNG cargoes (divertible contract or spot purchases) will only flow into Europe if hub prices are higher than the best alternative on a netback basis.  Asian LNG markets, which still have a strong linkage to crude, are likely to set that alternative for years to come.

Renewable growth and German power market dynamics

Angela Merkel’s coalition government is under pressure from rising energy bills at the same time it is confronting a significant slowdown in the development of renewable capacity.  Renewable energy policy is shaping up to be a key issue in the German election in September.  Germany has delivered onshore wind and solar capacity at a remarkable rate over the last decade, but it now faces a much bigger challenge in developing and connecting large volumes of offshore wind capacity.  The cost and logistics of this challenge are likely to be the ultimate test for Merkel’s Energiewende.

Given Germany’s power market has historically been dominated by nuclear and coal capacity, its renewable targets are the most aggressive in the world by some margin.  A 50% renewable production share by 2030 and an 80% share by 2050.  10 GW of offshore wind capacity by 2020.

Ironically, Merkel’s post Fukushima decision to accelerate closure of Germany’s nuclear plant has been a key factor undermining progress towards these targets.  Germany’s two largest utilities, E.ON and RWE, are the key developers of renewable capacity.  But both companies are suffering considerable balance sheet stress, brought on in part by the significant loss of margin from accelerated nuclear closures.  E.ON recently announced it will cut renewable investment from €1.79 billion to less than €1 billion.  RWE has said it will cut renewable spend in half to €0.5 billion with RWE’s CEO saying that he wants to reduce offshore wind  investment risk by connecting “one park at a time.”

In this article we provide a brief overview of how German renewable policy is impacting the German power market.  This gives an indication of what may follow and of the importance of German energy policy to power markets across Europe.

A changing generation landscape

A recent presentation from Professor Dr. Bruno Burger of the Fraunhofer Institute for Solar Energy Systems provides some useful factual background on the impact of the increase in German renewable production capacity that has occurred across 2012.  In a year when wind levels were down, the increase in German renewable production has been driven by a 34% (8.1 GW) increase in solar capacity.  The impact of this solar capacity expansion  on renewable output is shown in Chart 1.

Chart 1: Step change in German solar output in 2012

DE Solar Wind

Source: Electricity production from solar and wind in Germany in 2012.  Prof. Dr. Bruno Burger (Fraunhofer ISE)

The German power market has easily absorbed the loss of the 5GW of nuclear capacity closed in 2011.  Compensation for the nuclear shortfall has come from a decline in German power demand and a rise in coal plant load factors.   Growth in solar output, weaker German industrial demand and healthy dark spreads, have seen Germany significantly increase exports to its neighbours in 2012 (as shown in Chart 2).

Chart 2: Step change in German exports

DE power import export

Source: Electricity production from solar and wind in Germany in 2012.  Prof. Dr. Bruno Burger (Fraunhofer ISE)

The increase in solar production has displaced thermal plant in the merit order, particularly in sunnier peak periods.  This has caused utilities in Germany to mothball or close large volumes of gas-fired capacity.  A steady increase in the price of gas relative to coal has combined with higher renewable output to crush gas plant load factors, with German coal plant becoming the dominant driver of marginal pricing as shown in Chart 3.  Given Germany’s high level of interconnection, these factors have been felt across European power markets.

Chart 3: New solar at the expense of gas

DE power delta gen

Source: Electricity production from solar and wind in Germany in 2012.  Prof. Dr. Bruno Burger (Fraunhofer ISE)

Germany’s flexibility requirement has also increased significantly as a result of fluctuations in wind and solar output.  This requirement is serviced to a considerable extent by hydro and thermal plant beyond its borders, e.g. Scandinavian & Alpine hydro production and Dutch gas output.  Germany has also relied heavily on neighbouring transmission networks to balance its system given serious north-south constraints within the German network.

German renewable policy is clearly a key factor shaping the evolution of the European power market.  The German election is likely to have an important bearing on policy direction.  In the lead up to polling day on September 22nd we plan to publish several articles exploring the transformation of the German power market.   Next up we will look in more detail at the impact of Germany’s renewable production on neighbouring markets in an article to follow shortly.