What drives contract counterparties back to the negotiating table?

This is the first in a series of articles on commercial considerations in the negotiation of long term energy contracts, written by Nick Perry.

The European energy industry is navigating a period of intense re-negotiation of long term contracts.  Rapidly changing market price dynamics have resulted in large swings in contract value and exposed unintended consequences of original terms and conditions.

The outcomes of gas supply contract negotiations with Russia and Norway are having a substantial bearing on the financial viability of a number of European energy companies.  At the same time, LNG supply contracts are being redrawn to reflect the impact of changing price dynamics and the increased value of diversion flexibility in a post-Fukushima world.  In the power market, long term tolling contracts have been transformed by a sharp fall in spark spreads, lower load factors and an increase in plant flexibility requirements.

Long term contracts (LTCs) of large volume, long duration and high nominal value are widespread in the energy business.  But the greatest absolute (mark-to-market) value is usually to be found when, after several years, an LTC becomes significantly in-the-money for one party, and correspondingly out-of-the-money for the other.  In such circumstances, commercial creativity allied to good analysis and negotiation skills become critical factors for turning destructive win-lose stasis into positive win-win dynamics.

In this first article of our series on long term contract negotiation, we consider how these dynamics can be identified and fruitfully exploited for significant added value.

Price risk is the primary driver of contract value shifts

When a forward contract is first transacted in a liquid market, its absolute mark-to-market (MTM) value is usually close to zero for each party.  Liquidity and transparency combine to minimise the chances of there being any large sums lying around on the negotiating table.  This is generally the case even when liquidity and transparency are only partial.  For price-takers in a market, the initial MTM may even be (slightly) negative when the deal is struck.

Good negotiators can often find ‘win-win’ ways to create positive initial value for both sides; for example, when they are able to arbitrage different costs of capital or diverging assessments of extrinsic value.  The more ‘plain vanilla’ a forward contract, the less likely there is for a genuine win-win to be available but conversely the more complex the deal, the more likely it is to be possible.

Even so, initial contract MTM values will be small, perhaps even very small, relative to the nominal sums involved.  (Parties that claim to have created large positive initial value are generally marking the contract to their own portfolio or – worse still – to their forecasts of future spot prices.)  This is not to find fault with the transaction, which may represent a very sound hedge, for example, or a satisfactory liquidation of a physical position; or even a speculative open position taken on with full understanding of the potential downside.  For a market-maker or arbitrageur, a small positive value on an individual deal may represent exactly what they are in business to capture, transacting small positive gains continually, in high volume and at low risk.

However, the MTM of unhedged large deals can evolve significantly away from their initial small value – in either direction.  This of course is Price Risk, the primary category of market risk, and is nowhere more acute than in energy, where volatility is high and long-term price shifts can be dramatic.  In order to illustrate this point, it is useful to consider a simple case study looking at the impact of the rapid convergence of Italian PSV and North West European hub prices.

Case Study: PSV convergence and Italian supply contracts

Large European gas suppliers (e.g. E.ON, RWE) suffered sharp losses in 2009-10 as the financial crisis took hold.  Gas hub prices plunged below long term oil-indexed contract prices and a rapid fall in gas demand left suppliers long gas against take or pay obligations.

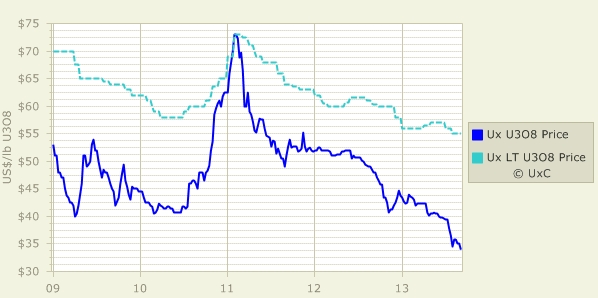
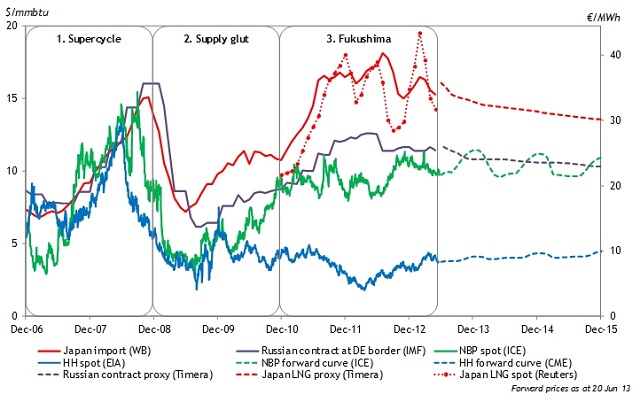
Italian suppliers were somewhat insulated from the trouble in northern Europe as the illiquid PSV hub continued to move in line with oil-indexed contract prices.  However market events suddenly turned against Italian suppliers in 2012. The release of capacity on the TAG pipeline allowed the flow of surplus gas from Baumgarten into the Italian market, resulting in the rapid convergence of PSV and NW European hub prices.  The scale and pace of this convergence is illustrated in Chart 1.

Chart 1: Hub vs oil-indexed prices and 2012 PSV convergence

PSV convergence

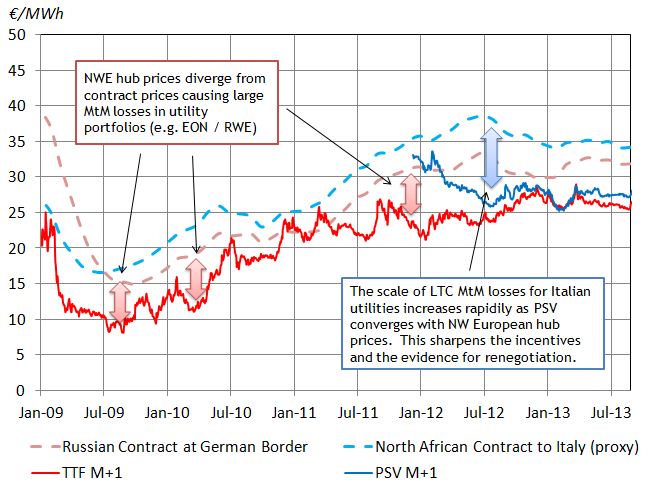
Source: LEBA, IMF and Timera Energy

The plunge in PSV hub prices has become a key factor impacting renegotiation of a number of Italian supply contracts.  ENI has the largest exposure to long term oil-indexed supply contracts in Italy.  Although ENI’s losses from PSV convergence have been painful, they have been the catalyst for some favourable contract renegotiation outcomes.  ENI has not only gained significant contract price concessions from Gazprom since 2012, but has renegotiated supply contract take or pay levels and indexation to reduce portfolio risk.  Edison, another big Italian gas buyer, has also used the PSV price move as leverage in successful contract price renegotiations with Rasgas (LNG supply into Rovigo) and Sonatrach.

As is often the case, contract price has been the primary driver behind renegotiation.  However negotiations have focused on concessions around a much broader range of contract parameters, e.g. spot indexation levels and volume flexibility, as parties try to re-optimise contract terms for changing market and portfolio conditions.

Approaching the negotiation table

Rightly, the first considerations for a company identifying part of its portfolio as having high MTM will be:

  1. how does this sit in terms of Price Risk, and in particular, does it represent a hedge for a correspondingly out-of-the-money portfolio component?  If so, the value and commercial integrity of the in-the-money deal will need to be defended purposefully, leading to …
  2. what is the credit position of the counterparty to the in-the-money deal ?, They are likely to be suffering  financial pressures commensurate with the negative value the contract represents for them; but the original company cannot be indifferent to this counterparty’s ability to perform.

Assuming the credit situation is not (yet) at crisis-point, it would be wrong for the first party simply to be satisfied with the security of the position and do nothing.  The potentially damaging, indeed possibly deteriorating, situation the counterparty faces is likely to generate commercial forces that will bring the parties eventually to the negotiating table.  Wait too long, and a crisis may indeed develop.  By contrast, a timely pro-active approach, firstly to analysis and then to creative commercial engagement, can pay very big dividends.

In the next article in this series we consider the nature of typical renegotiation dynamics and set out a framework for systematic development of the commercial potential.

Nick Perry is a Senior Associate of Timera Energy.  He has worked on large structured energy transactions for over 30 years, both as a principal and a consultant. 


Getting to grips with LNG shipping costs

The LNG shipping market is characterised by unusual terms such as ‘demurrage’, ‘ballast’ and ‘bunkering’.  It features interesting conventions such as ‘canal transit costs’ and is impacted by the very real threat of modern day piracy.

While all of this is interesting trivia, these factors all play a role in determining the cost of moving gas between locations. The market for LNG vessels is a different animal to the more homogenous traded markets for delivered gas.  The costs of shipping gas are determined by very physical considerations around logistics and constraints.

LNG shipping costs have an important influence on global gas flows and pricing dynamics. LNG shipping costs are a key driver of:

  1. The value that can be generated from moving gas between different locations
  2. The level of price spreads between regions across the global gas market

Shipping costs have played a particularly important role over the last two years in determining the cargo diversion decisions to higher priced markets, as global prices have diverged post Fukushima.  They are also a key consideration in understanding to what extent global prices may converge in the future.

In this article we provide an overview of the build up of LNG shipping costs and their influence on gas flows and pricing.  We will then follow up with an assessment of global LNG shipping supply and demand dynamics and the implications of these on shipping costs.

Shipping cost components

The key components that make up the cost of shipping LNG are as follows:

Chartering fee: This is the payment for securing access to shipping capacity by chartering a vessel.  There are broadly three ways to secure access to shipping capacity: (1) own vessel capacity (2) time charter and (3) single voyage or spot charter.   Spot charter rates are generally higher and certainly more volatile than longer term time charter rates.  We will look in more detail at the drivers and evolution of charter rates in an article to follow.

Brokerage: Vessel charters are typically arranged through specialist brokers and attract a 1-2% fee.

Fuel consumption: The voyage fuel or ‘bunker’ consumption is directly proportional to the distance and speed of the vessel.  This is typically the second largest cost component after the chartering cost.   The added complication for LNG vessels is the different propulsion mechanisms and fuel burn options.  Most LNG vessels can burn fuel oil, boil-off gas or a blend of both in their boilers.  As a result the calculation of fuel cost is closely tied to that of boil-off gas.  Natural boil-off occurs at a rate of approximately 0.15% of inventory per day and at times boil off is forced above this level to further reduce the fuel oil requirements.  Some modern LNG vessels also have the ability to re-liquefy boil-off gas, keeping the cargo whole (and allowing the use of more efficient diesel engines).  Calculation of the direct fuel consumption is fairly straightforward but the opportunity cost of LNG boil-off is also an important consideration.

Port costs:  The components and level of the costs of loading and unloading at ports can vary widely depending on location.  For example, ports in less stable regions can levy large security charges associated with ensuring the safety of the vessel.

Canal costs: Transit costs have to be paid for using the cross-continental Suez and Panama canals.  Only a small fraction of the current LNG tanker fleet can squeeze through the Panama canal making the Suez is the most common canal transit.  Suez canal transit costs are a complex function of vessel dimensions and cargo (laden voyages being more expensive) and LNG vessels are entitled to a 35% discount after which the costs are in the region of USD 300-500k per transit.  The Panama canal widening project, due for completion in 2015, will allow up to 80% of LNG vessels to make the transit.  This will reduce the distance from 16,000 to 9,000 miles from the US gulf coast to premium Asian markets.  The impact on shipping costs to Asia is less clear as the tariffs have yet to be published.  However, any reduction will increase the competitiveness and influence of Henry Hub priced US Exports on Asian pricing.

Insurance costs:  Insurance is required for the vessel, cargo and to cover demurrage (liabilities for cargo loading and discharge overruns).

In order to get an understanding of how these components combine to determine the overall cost of an LNG voyage, it is helpful to consider an example.  Chart 1 shows the shipping cost build up of a spot charter voyage from Nigeria to Japan.

Chart 1: Shipping cost from Bonny Island Nigeria to Sakai Japan

Shipping Costs

Shipping cost impact on diversion economics & regional price spreads

The calculation of an appropriate shipping cost between two locations depends on how the cost is going to be used.  Calculating the shipping cost behind cargo diversion economics is easier than calculating the shipping costs that influence inter-regional price spreads.

Diversion economics

The diversion economics for a cargo owner are based on a set of known parameters.  The diversion decision is focused on the cost difference between sending a cargo to Location A (e.g. Japan) as opposed to its original destination, Location B (e.g. the UK).  The relevant shipping cost for the diversion decision is the true incremental cost of Location A over Location B.

The incremental cost to a cargo owner is likely to depend in part on prevailing costs in the shipping market, e.g. the spot charter rate if incremental shipping capacity is required.  But it may also depend on considerations within the cargo owner’s portfolio.  Most importantly any sunk costs (e.g. associated with shipping capacity or port access) are not relevant for calculating incremental shipping costs.

Regional price spreads

Calculating the influence of shipping costs on regional price spreads is a more difficult problem.  Take the shipping costs between Europe and Asia as an example.  If Asian LNG spot prices fall , they typically find support 2-4 $/mmbtu above European hub prices (e.g. summer 2012).  The logic here is that at these price levels, cargo diversion opportunities from Europe to Asia are curtailed.  In other words the return from selling LNG into Asia starts to fall below the cost of diverting gas from Europe (determined primarily by shipping cost).

But understanding the level of shipping costs behind this Asian vs European price differential is not as straightforward as calculating a ‘point to point’ incremental shipping cost.  Diversion decisions differ depending on supply contract and portfolio considerations.  For example, the flow of European cargo reloads tends to be the most expensive source of diverted LNG to Asia and so the first to be curtailed as spot prices fall.  As prices fall further it impacts the diversion economics of producers in the Atlantic Basin (e.g. Trinidad, Nigeria) and eventually producers in the Middle East such as Qatar (which is more or less equidistant from Europe and Asia).

Diversion decisions also differ across the portfolios of LNG market participants given different incremental shipping costs.  Fuel, port and canal costs are generally a direct function of voyage and destination.  But the treatment of charter costs and the cost of the ballast (unladen) or return journey is less clear.

If the cargo owner uses existing portfolio shipping capacity to divert a cargo to Asia, then some of the charter costs may be unavoidable (or sunk) given long term charter conditions.  This may act to reduce the incremental cost of shipping gas relative to that implied by spot charter rates.

On the other hand, if using long term chartered capacity means making an unladen (empty) voyage back from a cargo delivery to Asia, this may significantly increase the incremental shipping cost associated with diverting the cargo.  Given what is currently a fairly consistent one-way flow of LNG from the Atlantic Basin to Asia, accounting for the burden of unladen return voyage costs is a key factor driving incremental shipping costs.  This burden is often one of the key terms for negotiation in charter contracts.

Making sense of shipping costs

There is no hard and fast rule or formula for the shipping costs between two locations.  But a shipping cost calculation tool is useful piece of kit for estimating shipping costs as well as understanding the dynamics behind changes in costs.  Building up an estimate around current spot charter rates typically gives the best and most transparent benchmark for shipping costs, in the absence of any more specific information on portfolio factors driving costs.

The LNG market is evolving in response to the substantial regional price differentials in a post-Fukushima world.  Contract diversion flexibility is increasing, new and more flexible shipping capacity is being commissioned and trading in spot cargoes continues to expand.  As the decade progresses, the current price premiums over shipping costs will likely be eroded, with regional prices re-converging.  As this happens shipping costs will increasingly become the primary driver of regional price spreads.


A mini-meltdown in the uranium market

The uranium market is a quieter cousin to the larger global markets for gas and coal.  But despite the post Fukushima shift in public opinion away from nuclear generation, there are still 152 operational nuclear power plants in Europe (ex Russia) totalling 138 GW of capacity.  So uranium is a key source of fuel for European power generation.

The uranium market has had a wild ride over the last decade, buffeted by the commodity supercycle, a push for a new generation of nuclear plant and the Fukushima disaster.   A precipitous decline in prices in the last year has resulted in price levels well below the long run production costs of new mines.  We do not pretend to be experts in the uranium market.  But there a few interesting top down observations that can be drawn as to the current state of play.

Uranium market 101

The most liquid traded form of uranium is U308.  This is a uranium compound that has undergone initial processing into the most common form of yellowcake (uranium concentrate powder) for shipping to nuclear power stations.  The market for U308 (which from here on we refer to as uranium) consists of both spot and long term transactions.  Spot commonly refers to deals for delivery within a three month horizon.  The long term market typically focused on deals with delivery over a two year horizon or longer.

Given the long term stable nature of nuclear plant output and fuel usage, the focus of market liquidity is firmly on long term contracts.  The uranium spot market typically exhibits low levels of liquidity and can deviate significantly from the term market depending on shorter term supply/demand balance of market participants.

Current supply/demand balance

Like most commodities, uranium was caught up in the exuberance of the commodities ‘supercycle’ bubble of 2006-07 with spot prices soaring to above 130 USD/lb.  Production costs rose and demand projections were strong on the presumption that a new generation of nuclear power stations would be developed as part of a global fight against climate change.

Much like the US gas market, the uranium market faced a near perfect storm from 2008-11:

  • The financial crisis popped the commodities bubble, reducing production costs and power demand projections.
  • The development of a commercially viable next generation nuclear technology suffered a number of setbacks with project delays, costs overruns and cancellations.
  • Fukushima saw Japanese demand for uranium erased almost overnight and a global shift in public sentiment away from nuclear generation (e.g. Germany’s decision to accelerate nuclear closures).

The evolution of price over this period is illustrated in Chart 1

Chart 1: Spot and term uranium prices 2009 to date

price chart

Source: UxC

The decline of uranium prices has left several newer, higher cost uranium producers in a precarious position.  Cash strapped and struggling to find term buyers at healthy price levels, they have been forced to unload product in the spot market.  This appears to be creating a positive feedback loop in acting to further drive down term prices.

Risk vs reward at current prices?

What is interesting to note over the last 5 years is the sharp recovery of uranium prices in 2010. This brief period of market tightness prior to Fukushima reflects the increasing production cost structure of incremental uranium supply.  Long run costs for new production are currently estimated to be around 70 USD/lb.

It is a consistent feature of commodity markets that the link between prices and long run production costs can breakdown over long periods.  This is particularly the case during periods of spot market stress.  But long run costs tend to exert an influence on prices during periods when a market anticipates a requirement to deliver incremental supply.

That impact was felt in 2010 in the uranium market, although it dissipated quickly as global demand was revised downward after the Fukushima crisis.  But there are a number of demand side drivers that may act to draw prices back towards long run production costs over the medium term:

  • The Russia-U.S. ‘Megatons to Megawatts’ program ends this year and is unlikely to be renewed.  That removes 24 million pounds per year of secondary supply from the market, around 15% of global supply.
  • There are 60 nuclear power plant currently under construction globally, focused in China and Russia.  Nuclear generation remains the only large scale baseload form of low carbon production.
  • Despite recent delays, Japan is progressing slowly towards restarting its fleet of 50 nuclear plant (~45GW).

None of these factors will necessarily cause a near term recovery in prices.  Indeed stress in the market currently appears to be firmly on cash strapped producers.  But downside cleanouts that cause producers to fail or consolidate often mark turning points in commodity market price cycles.  Given the structural demand drivers at work, there does not appear to be a very compelling risk/reward trade-off from positioning for further price falls.


Rhetoric vs. reality on UK shale gas impact

Shale gas has been a pet interest of the UK Prime Minister David Cameron and his Chancellor George Osborne.  The top two Tories have been painting a picture of a potential UK shale gas revolution, with investment in unconventional gas production dramatically reducing Britain’s energy costs.

In the words of the Prime Minister in July 2013:

In America they are now almost self-sufficient in gas.  Their gas prices to business are now less than half as much as ours are and the reason for this is they have put a lot of investment into unconventional gas.

Having presided over a period of uncomfortable rises in energy bills, a US style shale gas revolution must seem like an attractive prospect.  But the prospect of UK shale production having a substantial impact on UK energy prices is nonsense, given the UK’s interconnection with the European and global gas markets.  Despite this fact, sections of the UK government and UK press have jumped on a consultant report released by DECC as evidence of the potential for UK shale gas production to reduce gas prices.  This misrepresents the findings of the report and illustrates the growing gap between the government’s rhetoric and reality on shale gas.

UK shale gas in context

There have recently been some positive signs for shale gas development in the UK.  The British Geological Survey announced a substantial rise in UK shale gas resource estimates to 1300 tcf (36 TCM) in June.  While a large portion of those reserves may never be economically recoverable, Centrica’s 25% investment in the UK’s largest shale gas company Cuadrilla has provided a boost to the commercial prospects for UK shale.

But two big hurdles remain for UK developers in the form of environmental and infrastructure planning constraints.  Evidence from the US and Australia suggests that if the public is going to remain onside, it is important for the government to ensure robust and transparent regulation of these areas.  Recognising these constraints, it makes sense for the government to provide tax breaks for development of the UK’s unconventional gas reserves to replace the rapidly declining reserves in the UK North Sea.  But the government’s mistake is trying to drum up support for shale gas based on a false premise.  This is about jobs and security of supply, not lower UK gas prices.

DECCs report does not link UK shale with lower prices

Cameron and Osborne announced a flurry of supportive statements on UK shale gas in July, coinciding with the release of a report commissioned by DECC on the pricing impacts of unconventional gas.  The report from US consultants Navigant contained the usual High, Base and Low scenario forecast for UK gas prices over a 2030 time horizon shown in Chart 1 below

Chart 1: UK gas price forecasts from DECC report

Navigant scenarios

Source: Navigant, DECC

While the Basecase scenario shows a decline in prices by 2030 (compared to current levels and DECC’s reference case), this is driven by falling oil prices and has nothing to do with UK shale gas production.  In fact this scenario assumes:

“that unconventional gas production in Europe does not rise to any significant level, as a result perhaps of public opposition, poor geology or lack of capital given marginal economics”

Even in the Low or “Optimistic” scenario in the report where prices fall further, this is due to further oil price declines and global development of unconventional gas, rather than any specific impact of UK shale production on UK gas prices. 

UK gas production does not drive UK gas prices

The dramatic reductions in US gas prices are a result of a gas being ‘trapped’ in the relatively isolated North American gas market.  As shale gas production has rapidly increased over the last 5 years, prices at the US Henry Hub have been driven down towards the variable production costs of shale developers.  Infrastructure and policy constraints have created a temporary barrier inhibiting the flow of cheap US gas to higher valued markets in Europe and Asia.

Unlike the North American market, the UK gas market is not isolated.  There are two large interconnectors between the UK and Continental Europe.  There is also a large pipeline network from the Norwegian Continental Shelf that ensures price linkage between the UK and the rest of Europe.   In addition, the UK and, more broadly, Continental Europe are tied into the influences of the global gas market via LNG import infrastructure.

Regardless of how much shale gas is produced in the UK, the price for gas in the UK will be determined by the pan-European supply and demand balance.  The cost of marginal supply, predominantly flexible Russian pipeline volumes, will continue to be the key driver of prices across the interconnected network of European gas hubs until well into next decade.  This remains the case even under heroic assumptions where growth in shale production returns the UK to its former gas exporter status.

If the government can create an effective regulatory framework then UK shale production can contribute to security of supply, employment and the UK’s balance of payments.  But it is not going to significantly drive down Britain’s energy cost base.

Will European LNG reloads continue?

The practice of reloading an already discharged LNG cargo back onto a vessel for export appears to defy logic.  But reloading of LNG has become an increasingly important factor driving European LNG flows over the last two years.  Reloading activity is focused on specific locations where LNG supply is bound by contractual constraints.  Despite the apparent inefficiency, significant profits have been made by reloading gas from Spain, Belgium and France for export to higher priced markets.  But there are some important structural factors that are likely to impact the future of LNG reloading.

Why is reloading happening?

There are two key factors behind the reloading of cargoes in Europe:

  1. Fixed destination clause (Delivery Ex Ship) constraints in LNG supply contracts
  2. A structural premium of Asian LNG spot prices over European gas prices

Fixed destination clauses only impact a subset of European LNG supply contracts.  The majority of LNG supply into European terminals is contractually divertible, either as agreed in the original supply contract or as renegotiated by the buyer and seller.   The exceptions are some inflexible supply contracts into Spain, France and Portugal, as well as Qatari LNG supply into Zeebrugge.  This has led to the conversion of several regas terminals to enable the reloading of gas.

The source and scale of reload activity can be seen from the European volumes of re-exported gas in 2012, shown in Chart 1.  These volumes are still relatively small as a proportion of total LNG supply into Europe, but are in addition to larger volumes of divertible LNG supply contracts.

Chart 1: 2012 European LNG re-export volumes mtpa (source GIIGNL)reload by country

The structural Asian price premium that has seen a growth in European reloads is a specific phenomenon of post-Fukushima Asian LNG spot pricing.  Reloaded volumes have broadly coincided with periods of high Asian or South American spot prices which have uncovered a substantial premium over shipping cost differentials.  The incentive to reload can be seen by comparing the Japanese LNG spot price with NBP hub prices in Chart 2.  In periods of high spot prices, the differential to send gas to Asia significantly exceeds the shipping cost of around $2.50/mmbtu.

Chart 2: Global gas price differentials driving reload volumes (source Timera Energy)

global gas prices2

However European cargoes are not always re-exported outside Europe.  Soft LNG spot prices in Asia and South America across summer 2012 caused the spread between these markets and Europe to narrow sharply.  But the flow of reloaded cargoes shifted to premium European markets (mainly Italy and Turkey) with a lower absolute price premium but also lower shipping costs.  Destination markets for European reloaded cargoes can be seen in Chart 3.

Chart 3: 2012 European LNG reloaded cargo numbers by destination (source GIIGNL)

reload by destination

What factors drive the decision to reload gas?

The flow of divertible LNG supply contracts tends to track shipping cost differentials reasonably closely.  But the drivers of cargo reloads are more complex.   A reloader of LNG incurs a set of direct costs levied by the terminal operators.  These costs are typically regulated and vary by country but are in the order of $0.6-0.8/mmbtu.

But the party reloading gas also faces a number of logistical constraints and associated costs.  Time is money with LNG, given energy lost via boil-off and transfer of gas.  Reloading of gas blocks a terminal for longer than unloading (it can take 4-6 days), and terminals always provide priority access for regasification over reloading.  There are also constraints around scheduling of reloads and how long gas can be kept in terminal tanks before it needs to be discharged.  These logistical factors mean that the true cost of reload is well above the direct cost paid to the terminal operator.  In other words a premium well in excess of shipping costs is required to incentivise the re-exporting of gas.

The future for European reloading

Although plans are being discussed to adapt other European terminals for reload (e.g. GATE), there are some factors working against growth in the re-exporting of gas.

From a global value perspective, reloading is an inefficient practice.  Alleviating supply contract destination clause constraints to avoid reload costs should be a ‘win win’ outcome that increases value for a buyer & seller to negotiate.  Over time, this will likely be reflected in supply contract renegotiation, reducing the requirement to reload gas.

However there are some practical considerations from an individual party perspective that may cause inefficiencies to remain.  Reloading has the benefit to the LNG buyer of removing any requirement to share diversion upside with the seller (a practice that is common with divertible supply contracts).  The seller (or LNG producer) may also place a premium on being able to control the flow of LNG.  This is particularly relevant for Qatar, given the price it receives for uncontracted gas can be influenced by the impact of Qatari LNG flows on spot pricing.

But perhaps the most important threat to reloading comes from a narrowing in global LNG Spot price differentials.  A fall in Asian spot prices in Q2 2013 has already stemmed the volume of reloads this year.  Looking forward, a slowdown in Chinese growth and Japanese nuclear restarts may continue to constrain global price differentials.  In this environment, the reloading of European LNG is likely to be focused on shorter term opportunities driven by spot market volatility, rather than the structural flow of re-exported gas seen over the last two years.


A break for summer

We are taking a short break with the blog over summer, but will be back on 26th August.  Some of the articles lined up over the next few months include:

  • European LNG cargo reload dynamics
  • The rise of central planning in European power markets
  • Rhetoric vs Reality on UK shale gas impact
  • The looming downturn in the LNG shipping market
  • European gas supply contract re-openers

In the meantime we leave you with a chart that summarises the divergent state of pricing in the global gas market.  Courtesy of Reuters and Waterborne, the chart shows the landed prices for LNG at key delivery points around the world.

waterborne spot LNG

Source: Reuters based on Waterborne data

In an historical context, the gas market’s post Fukushima state of regional price divergence is an anomaly.  With Asian growth slowing, Japanese nuclear plant coming back online and US exports looming, it takes a brave person to bet against a pronounced narrowing in global gas price differentials over the second half of this decade.

Price divergence at PEG Sud

The pace of price convergence across European gas hubs over the last 5 years has been one of the great success stories of an integrated European gas market.  Price signals from the more liquid Northern European hubs (NBP, TTF and NCG) are increasingly penetrating into Southern Europe as transport capacity access improves.  But the PEG Sud hub in the South of France has taken a path of its own over the last 18 months, as the global LNG market has trumped price signals from Northern Europe. 

Price differentials reflect transportation constraints

Despite regulatory ambitions to evolve to a single French gas hub, France is for all practical purposes two gas markets.  The PEG Nord hub is well interconnected with North West Europe and forward prices have converged to reflect this.  There are however three factors that can contribute towards price separation in Southern France:

  1. LNG import flows
  2. Constraints on the North-South link within France
  3. French-Spanish interconnector flows

The French gas hubs and infrastructure are illustrated in Chart 1.

Chart 1: French gas market zones and infrastructure

PEG_map

Source: Elengy

The south of France is much more dependent on LNG imports than the north.  The structural Asian LNG spot price differential post Fukushima has resulted in large volumes of French LNG supply being diverted (or reloaded) and sold to Asian buyers.

The diversion of LNG supply has left a deficit of gas in Southern France that needs to be met via imports from the North.  This has been exacerbated by Spanish demand across the France- Spain interconnector, with Spanish gas prices typically higher than France, particularly as large volumes of Spanish LNG have also been diverted to Asia.  Constraints in the ability to transport gas from the more liquid PEG Nord to its southern cousin PEG Sud (via the North South link) have lead to some interesting periods of price divergence as shown in Chart 2.

Chart 2: French price differentials

price_spreads

Source: CRE based data from Heren and Bloomberg

These periods of PEG Nord vs PEG Sud price divergence have been more pronounced over the spring/summer of 2012 and 2013, with the price spread closing over winter 2012/13. This has been due to several factors:

  • Broad correlation with higher LNG spot price signals, reflecting a greater incentive to divert gas supply, with cargo reloads particularly sensitive to higher spot prices given the greater costs involved.
  • Strong storage injections in the South of France in both 2012 and 2013, as storage facilities have entered the summer with relatively low inventory levels (particularly given cold snaps in Feb 12 and Mar 13).
  • Capacity availability issues on the North Sea Link, particularly in 2012 when system issues prevented GRTgaz (the system operator) from marketing available interruptible capacity.

The very pronounced PEG Sud price spike in Mar 13 reflects contagion from the NBP price spike where spot prices temporarily increased towards the level required to draw in spot LNG cargoes.

What does the future hold?

CRE (the French regulator) has shown clear concern over price divergence across French hubs.  CRE has run an industry consultation on the causes and implications of the price decoupling over 2012-13.  The CRE review highlighted issues around transparency and availability of short term capacity, definitely factors which are within its remit to improve.  But as long as a structural LNG spot premium pulls gas away from France, physical transmission constraints on the North-South link may continue to drive price divergence.

One of CRE’s responses has been to push for a single balancing region across France (targeted for 2018).  But this aim somewhat misses the point.  A single balancing region and price would mask the true cost of the North-South transportation constraint by removing the ability for prices in the south to decouple from the north.  It is this price separation that is providing an important incentive for players to optimise portfolio gas flows in response.  A single balancing zone would leave the flow optimisation activities to the system operator (with any costs likely to be smeared across market participants).

A single hub in France is an admirable long term ambition, but it is the underlying transmission constraints that need to be addressed first.  Upgrades on the France-Spain interconnector in 2013 and 2015 are likely to add to price pressure in the south of France, as greater volumes flow to Spain.  This may set up an interesting pricing dynamic where Spanish gas prices are increasingly influenced by pricing in France, but at the same time are contributing to hub price divergence across France.  In this situation, volatility across French hub price signals may be a key factor supporting the value of gas supply portfolio flexibility within France.

Big trouble in little China?

Chinese economic growth is the primary driver of the evolution of global commodity market demand, as we have highlighted previously.  Energy markets are no exception.  China consumes 47% of global coal production and Chinese gas imports are projected to account for around half of global LNG demand growth.

A slowdown in Chinese growth has been the main force behind a sell off in commodity markets this year.  Chinese economic weakness also threatens Europe’s ability to recover from recession, with the potential to cause further declines in European power and gas demand.  There are two main sources of concern in China:

  1. The manufacturing sector, the engine room of the Chinese economy, is shrinking again.
  2. There are some concerning early warning symptoms of a credit crunch in an economy where growth has been propped up by credit expansion.

Optimists point to China’s ability to manage these risks through a centrally planned solution.  But both these issues are side effects of previous bouts of central planning:  industrial overcapacity from fiscal stimulus in the case of manufacturing weakness and monetary stimulus in the case of credit growth.  The extent to which the Chinese authorities can ‘manage’ growth and asset bubbles is likely be put to the test over the next 12 months.  The outcome will be of key importance to commodity markets.

Manufacturing turns south… again

Since we last wrote about Chinese manufacturing growth, there has been a minor recovery as the eurozone crisis eased in the second half of 2012.  But the recovery has been short lived, with a sharp fall over the last 3 months back into negative territory as shown in Chart 1.

Chart 1: Chinese Manufacturing Purchasing Managers Index

china PMI

Source: HSBC, Markit

Evidence of a slowdown is supported by a decline in Chinese power consumption (now at its lowest level since 2009) shown in Chart 2, a key factor behind weakness in the global coal market over the last two years.

Chart 2: Chinese power demand

china power 2

And a decline in Chinese exports shown in Chart 3.

Chart 3: Chinese export growth (yr on yr) since the financial crisis

china exports

Source: Zero Hedge

Symptoms of a looming credit problem

Credit growth has been a key central planning tool used by the authorities in China to ‘control’ its recovery since the onset of the financial crisis.  The rapid credit expansion since 2009 is clearly illustrated in Chart 4.

Chart 4: Chinese credit growth

china credit growth

Incremental credit growth has been focused in the poorly regulated shadow banking sector (i.e. non-bank financial intermediaries), an issue which the authorities have recognised as a risk they intend to address.  The first real hint of the side effects of this rapid credit expansion emerged in June 2013 with a sudden spike in stress in the interbank lending market in China shown in Chart 5.  This is somewhat reminiscent of the LIBOR issues that signaled the onset of credit stress in the USD interbank market in 2007-08.

Chart 5: Surge in China’s interbank lending rates

shibor chart

Source: Bloomberg, DoubleLine Capital

While China has acted quickly to inject liquidity to bring down interbank rates it faces a tough balancing act. The more the authorities support liquidity now, the worse the risk of a more serious credit crunch in the future.  This is a problem which the authorities appear to be aware of based on their tolerance for interbank rates to settle at higher levels since the initial spike.

But the central bank in China has little experience of managing a credit crunch.  At some stage defaults on bad loans threaten to materially erode Chinese growth.  This risk is well summarised by Satyajit Das, an independent risk expert who gave a number of prescient warnings on credit risk prior to the onset of the global financial crisis:

The reality is that a significant part of China’s growth since 2007-08 has been an illusion. Its headline growth of 8-10 per cent since then has been driven by new lending averaging 30-40 per cent of GDP. Up to 20-25 per cent of these loans may prove to be non-performing, amounting to losses of 6-10 per cent of GDP. If these losses are deducted, Chinese growth is much lower.

Credit contagion threatens to damage the Chinese economy much more quickly than a manufacturing slowdown.  China has made it clear that it does not intend to enact another major fiscal stimulus package like the one in 2009 given the risk of fueling further imbalances in the economy.  So as manufacturing slows and credit issues intensify, China’s central planners are running out of options to support growth.

The energy industry has become accustomed to the impacts of consistently high levels of Chinese demand for coal and gas.  There is certainly a compelling long run story around China’s requirement for energy imports.  But the current risks to China’s economic growth may warrant a review of ambitious assumptions on Chinese energy demand growth over the remainder of this decade.

Security of supply concerns intensify in UK power market

As of June 2013, the official view of security of supply risk in the UK power market has increased again.  Ofgem’s recently released Capacity Assessment report sets out a further deterioration in the regulator’s projections of the UK capacity balance.  The risk of customer disconnections, measured as high as a 1 in 4 chance in a scenario where the impact of the government’s efficiency measures fails to materialise, is again making national headlines.

The capacity crunch unfolds

The risk of a UK capacity crunch mid-decade has been one of the consistent themes of this blog.  In August 2011 we published an article setting out the case for a UK capacity crunch driven by closures of conventional capacity and lower renewable build rates.

In October 2012 Ofgem presented its first UK Capacity Assessment supporting the view that there was an increasing risk of a capacity crunch mid-decade.  At the time, we published another article setting out our view that:

  1. Ofgem’s public concerns and a deterioration in the UK capacity situation would significantly increase the political pressure for regulatory action
  2. Ofgem’s assumptions on capacity levels looked overly optimistic (particularly given risks around the retirement of conventional capacity)
  3. The likely reaction of the regulatory authorities would be to enable Grid to contract reserve to support existing conventional capacity

All three of those views appear to have been confirmed in Ofgem’s latest Capacity Assessment.

What is Ofgem worried about

Conventional plant retirements are a key cause of concern for Ofgem.  Since its first Capacity Assessment (Oct 12) market participants have announced an additional 2GW of imminent capacity closures.  Ofgem estimates a further 1GW by 2015/16.  These factors have caused Ofgem to project a more rapid tightening of the UK power market capacity margin compared to their analysis in October last year (as shown in Chart 1 below).  But we again believe that these numbers may be optimistic.

Chart 1: Ofgem projections of de-rated capacity margins for the UK power market

derated margins

Utilities are still suffering from an historically weak UK spark spread environment.  Generation margins on older CCGT are at the level, or in some cases, below the level of station fixed costs.  This capacity is at risk of mothballing or closure if spreads remain weak.

The most vulnerable CCGT plants for retirement are older, less flexible gas plant built in the 90’s dash for gas.   These assets were not designed for current conditions of low load factor running, with constant ramping and multiple starts causing increased costs through asset fatigue.  With some assets, investment in measures to improve flexibility can improve plant economics.  But there are a number of CCGT plants where flexibility improvements and fixed cost reductions are technically constrained by plant components and configuration (particularly in relation to the Heat Recovery Steam Generator).  It is these assets that are at greatest risk of retirement over the next three years, causing a further reduction in the UK capacity margin.

There are two other key risks to the capacity equation:

  1. Renewable build falls further behind target, with a particular risk around offshore wind as we set out here
  2. Ofgem’s assumption of a 3GW reduction in peak demand by 2018/19 due to the impacts of government efficiency measures does not materialise

Both of these factors depend on an improvement in the fortunes of the government’s EMR policies.

How will Ofgem react

In its first Capacity Assessment Ofgem raised the yellow flag on the risk of a capacity crunch.  Ofgem has taken a step further in this Assessment by proposing policy measures to stem the risk.  Ofgem’s report contains what appears to be a carefully worded joint statement:

Ofgem, DECC, Grid all agree ‘that it is prudent to consider the case for additional tools to help National Grid balance the electricity network during the middle of this decade when capacity margins could be tight.’

But Ofgem also makes it clear that they expect DECC to define an acceptable level of security of supply risk:

We expect DECC to define a reliability standard for the GB market through their EMR Delivery Plan. A reliability standard indicates the accepted level of risk in the market. It represents a trade-off between the level of security of supply and the investment required to achieve that level.

Ofgem’s concern around security of supply has lead it to propose two intervention options outside the wholesale market for industry consultation:

  1. Demand Side Balancing Reserve payments which allow Grid to contract demand side reductions
  2. Supplementary Balancing Reserve payments which allow Grid to contract generation capacity to protect security of supply

The latter payment looks to be consistent with what we were suggesting last October.  A ‘stop gap’ mechanism for Grid to bilaterally contract capacity reserve before the Capacity Market comes into effect after 2018.

This is important news for existing UK CCGT owners and investors.  Balancing reserve payments from Grid represent an additional potential asset revenue stream.  Given these will likely be fixed, off market capacity payments, they also de-risk CCGT returns.  In our view this only strengthens the increasingly compelling case for investing in flexible existing UK CCGT assets at current depressed values.

Controlling an addiction to cheap money

The importance of central bank monetary policy in driving commodity markets has been a key theme of this blog.  Since the onset of the financial crisis, monetary stimulus has become increasingly dominant as the primary risk factor driving global financial markets.  This influence has fed through into physical commodity markets including oil, coal and LNG.

The importance of monetary stimulus to the global economy was highlighted by the market reaction to the US Federal Reserve’s June 19th announcement on ‘tapering’ its Quantitative Easing (QE) program.  The mere hint of the Fed winding back its rate of QE saw a sharp jump in long term interest rates sparking a global asset selloff.

In response, the Fed appears to be dampening speculation of any imminent reduction in QE.  But the market reaction highlights the risks of massive unconventional monetary intervention.  Global economic growth is in a fragile state and is ill prepared to deal with the shock of a sustained move higher in interest rates.

Rising interest rates

QE, the Fed’s purchasing programme of interest bearing assets, has acted to artificially suppress long term interest rates around the world. ‘Tapering’ is the term that has been coined for a reduction in the rate of the Fed’s purchases of US government bonds and mortgage backed securities.  The prospect of QE tapering has been debated across financial markets for the last few months and has been responsible for a steady rise in long term interest rates (driven by government bond yields) from historically low levels.

However the extent of the Fed tapering announcement came as somewhat of a surprise.  The timing and rate of potential reduction in QE (if warranted by economic conditions) was more aggressive than anticipated.  The market reaction to this change in policy messaging is illustrated by the jump over the last 2 weeks in US 10 year bond yields in Chart 1.  Yields across Europe and much of Asia have shot up in sympathy.

Chart 1: US 10 year government bond yield

US10yr

An interest rate shock and global growth

A sustained rise in the yield on long term government bonds has a major impact on the real economy.  Not only does it increase government borrowing costs, but corporate and household borrowing costs as well.  All loans are priced off a spread to government bond yields.

A rise in rates does not necessarily spell trouble if it is driven by an improvement in economic growth prospects.  But the unprecedented scale of central bank intervention in bond markets over the last 5 years has increased the risk of interest rate ‘shocks’ where rate rises reflect market reactions to policy risk or sovereign credit risk rather than to expectations of economic growth.

The potential damage from rising rates has been compounded by a substantial increase in the sensitivity of governments to a rise in borrowing costs.  Sovereign debt has ballooned over the last 5 years as the result of bailouts and fiscal stimulus to fight the financial crisis.

The risks around higher interest rates have been highlighted in a recent report ‘Making the most of borrowed time’ presented on Jun 23rd by the General Manager of the Bank of International Settlements (BIS) in Basel (the ‘bank for central banks’).  Chart 2 from this report illustrates the rapid growth in global central bank monetary stimulus (left hand side) accompanied by a growth in sovereign debt (right hand side).

Chart 2: Growth in monetary stimulus and government debt (source BIS)

monetary stance BIS

The BIS also highlights the risk of rising interest rates to global financial institutions which hold much of the outstanding government debt.  The right hand side of Chart 3 shows the impact of a 3% rise in interest rates on the value of outstanding sovereign debt as a % of GDP for a selection of key G8 countries.  A 3% rise is not a big move when measured against historical yields (shown on the left hand side).  But the increase in impact of such a rise over the last 5 years is clear, more than doubling for most countries.

Chart 3: The risk of rising rates to financial institutions (source BIS)

rate impact BIS

Words of wisdom do not bode well for growth

As well as some interesting data, the BIS report contains a cutting summary of the impact of the way monetary stimulus has been used to fight the financial crisis:

What central bank accommodation has done during the recovery is to borrow time – time for balance sheet repair, time for fiscal consolidation, and time for reforms to restore productivity growth. But the time has not been well used, as continued low interest rates and unconventional policies have made it easy for the private sector to postpone deleveraging, easy for the government to finance deficits, and easy for the authorities to delay needed reforms in the real economy and in the financial system. After all, cheap money makes it easier to borrow than to save, easier to spend than to tax, easier to remain the same than to change.

The BIS also challenges central banks to face up to the reality of the task at hand:

Six years have passed since the eruption of the global financial crisis, yet robust, self-sustaining, well balanced growth still eludes the global economy. If there were an easy path to that goal, we would have found it by now. Monetary stimulus alone cannot provide the answer because the roots of the problem are not monetary. Hence, central banks must manage a return to their stabilisation role, allowing others to do the hard but essential work of adjustment.

Only time will tell whether the Fed and other central banks heed this prescient warning.  The Fed’s public deliberations over QE tapering may be a signal of its own concerns over the risks and limitations of ongoing monetary expansion.

Regardless, the recent market reaction to the prospect of QE tapering highlights the risk of a move higher in global interest rates.  Cheap money may have made it easier for the global economy to absorb the fallout from the financial crisis.  But it has left global growth, and in turn commodity markets, particularly vulnerable to a normalisation in borrowing costs.  As energy companies manage their portfolio exposures to oil, coal and gas, they are increasingly faced with an implicit exposure to interest rates.