It is ironic that the growing threat of Russian supply cuts has conincided with a sharp decline in European gas hub prices. Prompt UK NBP prices have fallen more than 20 p/th since the start of the year. TTF & NCG prices by more than 8 €/MWh.
This price slump is more than a seasonal decline as winter turns to spring. It reflects a North West European gas market that is substantially oversupplied into the summer. But what are the drivers behind price falls and are they structural or temporary?
Oversupply in Europe
It has been a mild winter followed by a mild spring across Europe, with gas demand well below average. As a result storage levels have remained relatively high coming out of winter. UK storage for example is currently around 65% full vs around 20% this time last year. Despite lower demand levels, pipeline flows into Europe have held up well, e.g. robust flows from Norwegian fields. On top of this, significant volumes of Qatari LNG have started to flow back into Europe over the spring.
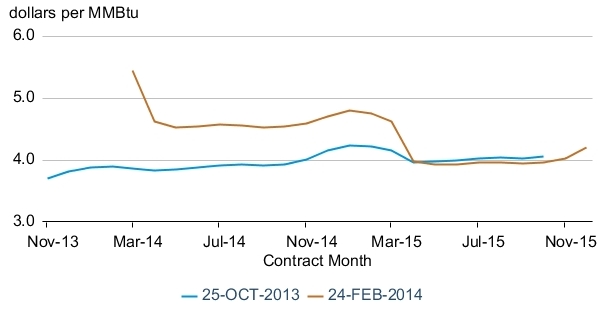
The resulting decline in gas prices is illustrated in Chart 1 by the green line (spot NBP prices). It can be seen that as spring has progressed, hub prices have diverged from oil-indexed contract prices (the dark blue line) and moved sharply lower. It is no coincidence that on the other side of the world Asian spot LNG prices have also plummeted (the red dotted line). But we come back to that relationship shortly.
Chart 1: Global gas price benchmarks
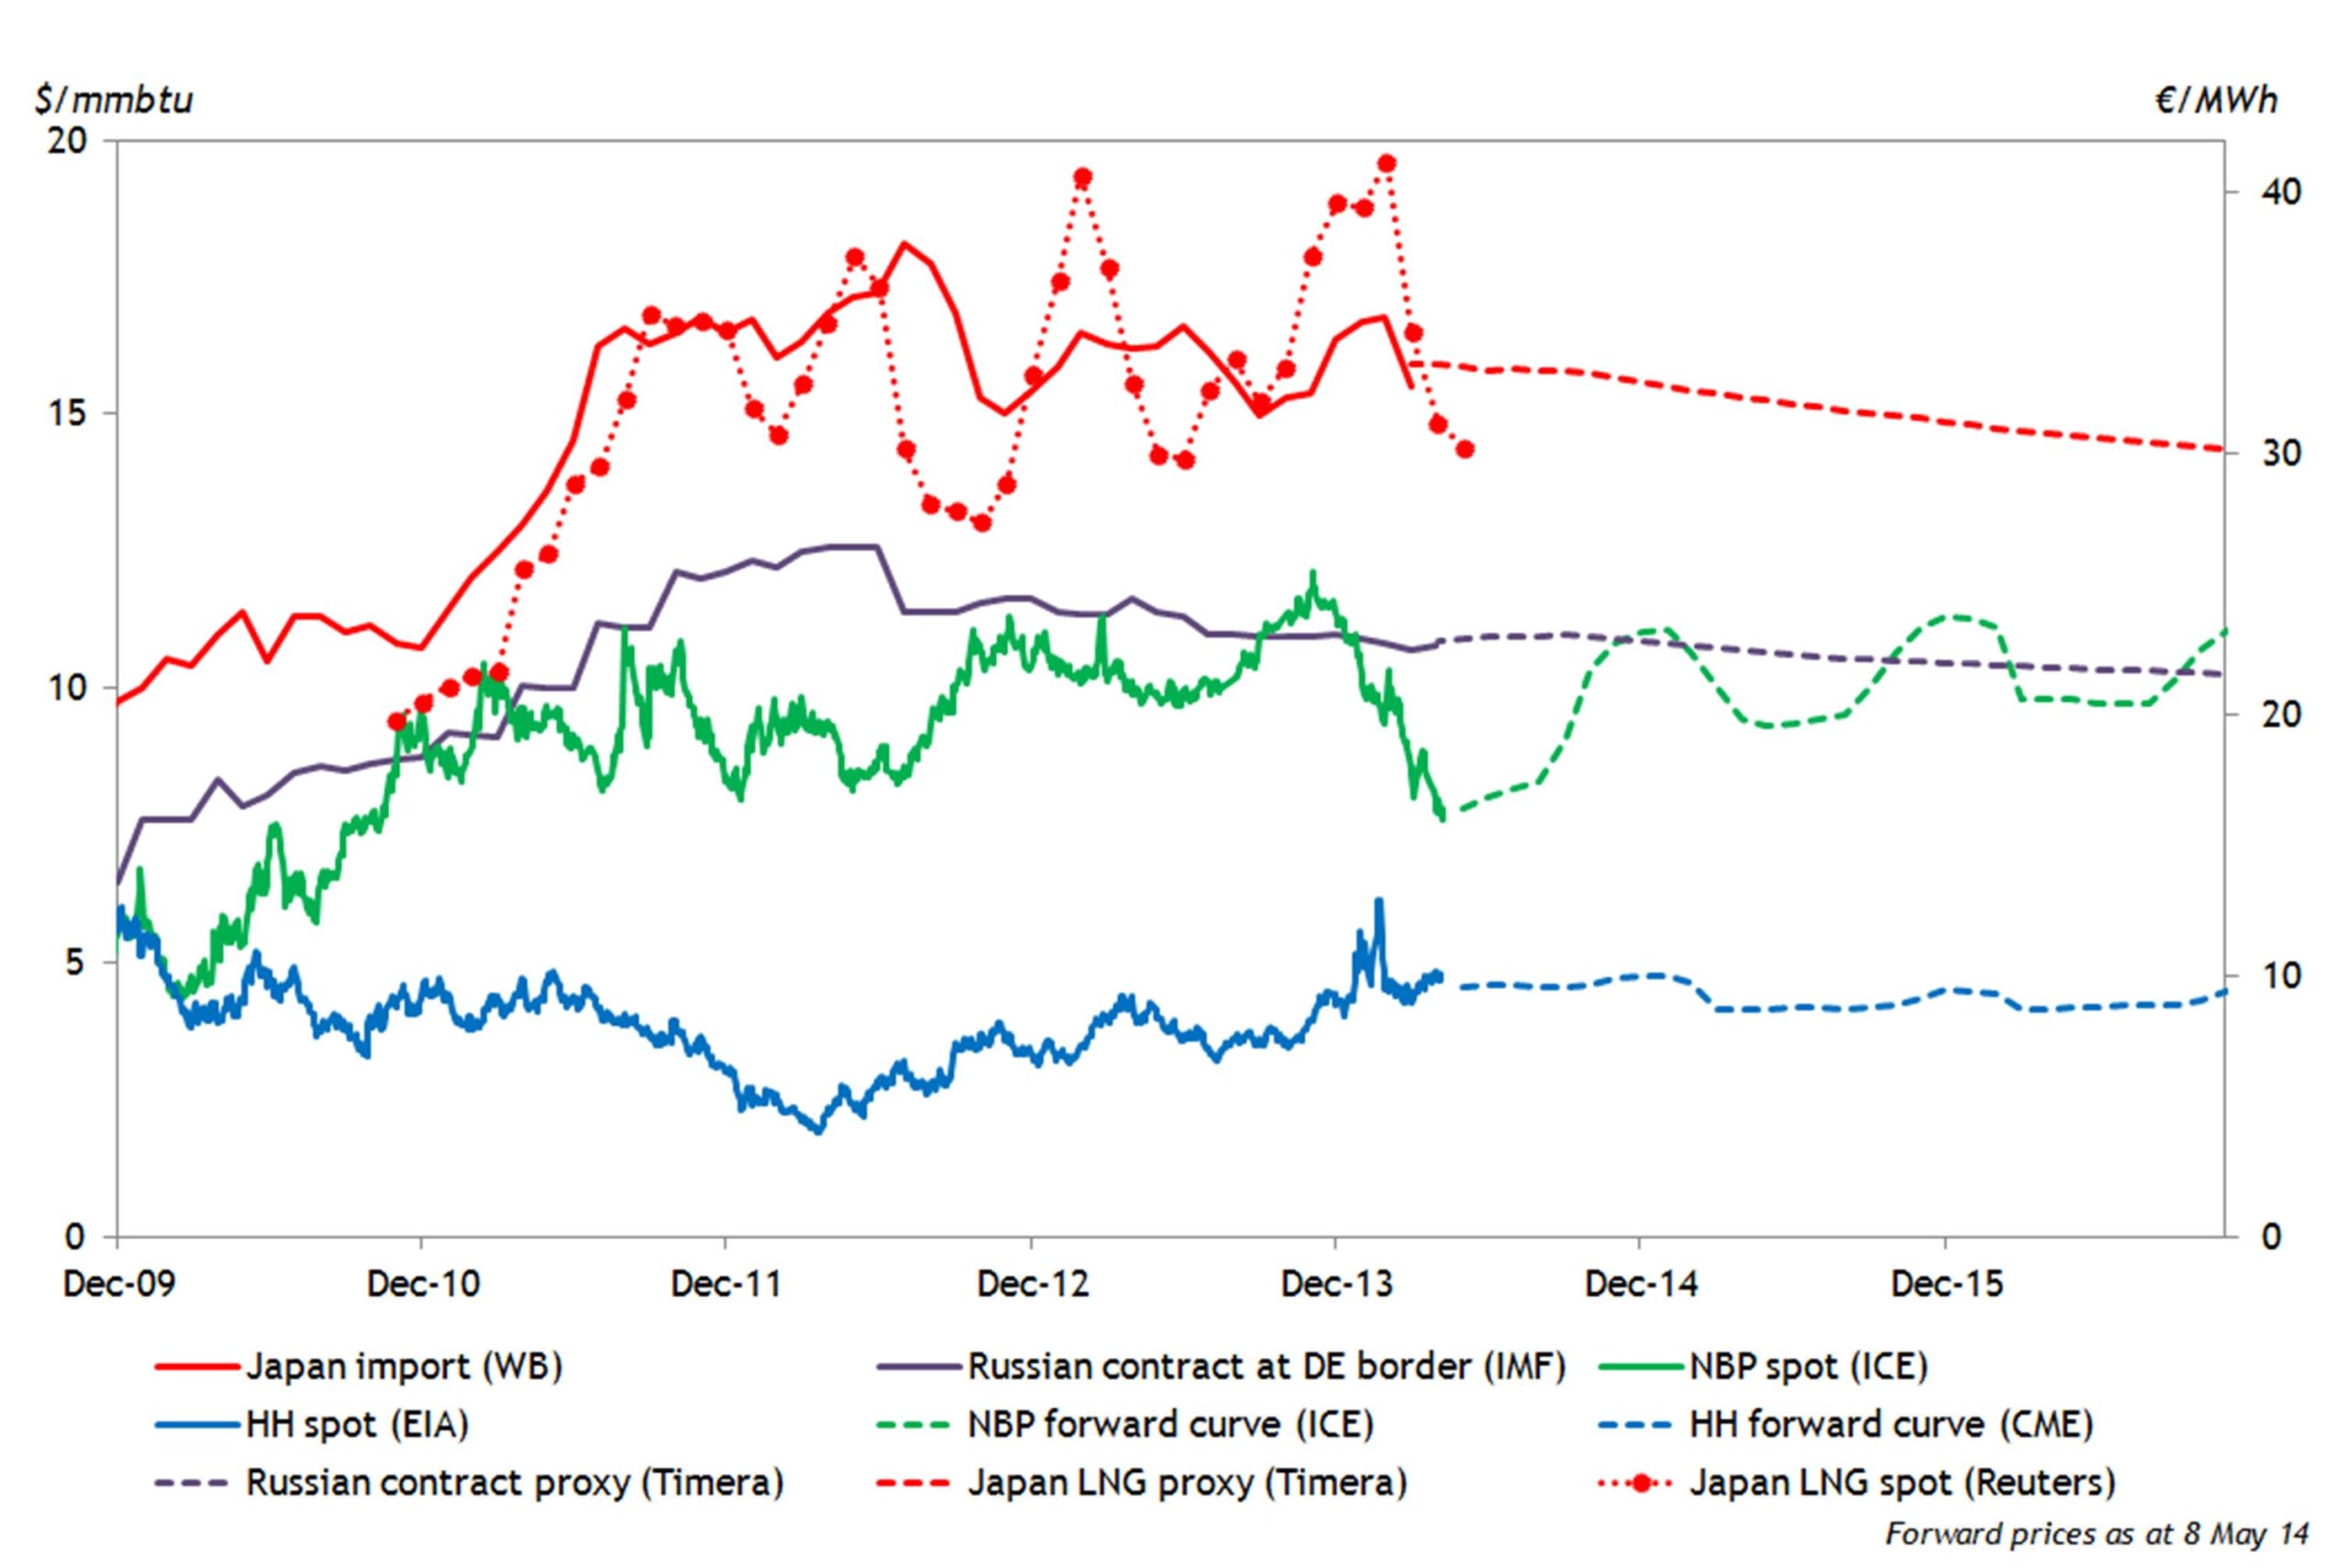
Source: Timera Energy
Last year we set out a framework for understanding European gas hub pricing dynamics. This focuses on understanding the behaviour of the key tranches of flexible (price responsive) supply into European hubs. Applying the framework to the current market conditions provides a good insight into the behaviour of hub prices.
In describing the framework we set out why hub prices typically trade within a loose band around oil-indexed contract price levels:
Of the flexible sources of supply, pipeline contract swing is of principle importance. Russian and Norwegian oil-indexed contracts are particularly important as a provider of swing flex into Germany. Utilisation of this swing flexibility tends to anchor European hub prices within a band around oil-indexed contract price levels.
This price band is somewhat flexible, but it is also resistant. It can be stretched by prevailing supply and demand dynamics, but the further prices deviate from oil-indexed benchmarks (e.g. the German border price), the stronger is the force acting to pull prices back. As hub prices fall below oil-indexed contract prices, contract owners utilise swing to pull back on contract volumes which supports hub prices. As hub prices rise above oil-indexed levels, swing gas flows increase acting as price resistance. A similar logic applies to gas storage.
As prices fall, reduction of swing contract volume take and buying of gas to inject into storage facilities, act to support hub prices. But this impact has limitations, e.g. storage injection will start to dry up as facilities fill by June/July. The current disconnect between hub and oil-indexed prices indicates that stronger forces are at work driving prices below the oil-indexed price band. This is where global LNG dynamics are playing a key role.
Europe as LNG balancing market:
Since Fukushima, flexible LNG volumes (e.g. uncontracted production & divertible supply contracts) have mostly flowed to premium markets in Asia and South America. European hub prices are a less attractive alternative for LNG that can be sold at higher prices elsewhere. But the LNG spot market is relatively illiquid and when prices are soft, Europe plays an important balancing role in soaking up excess supply. This is particularly the case in spring periods given seasonal weakness in Asian LNG demand.
Qatar as the world’s largest exporter of LNG plays a key role in determining flows to Europe. The Qataris have significant volumes of relatively inflexible uncontracted production that needs to find a market. Most of this LNG flows to Asia. But when Asian spot prices are weak and liquidity is poor, additional volumes can act to drive prices even lower. It is not in the Qatari’s strategic interest to drive a slump in spot prices in their primary market. So surplus LNG is typically sold into Europe, hence the volume pickup in gas imports to the South Hook terminal in the UK over the last couple of months.
European hub prices (particularly NBP) offer a relatively liquid option for selling surplus cargoes and there is easy access to regas capacity. So the current weakness in Asian spot prices is compounding weakness in European hub prices. While most of the LNG is being imported into the UK, the impact is quickly transmitted to the Continental hubs (e.g. TTF, NCG). The IUK interconnector has been flowing strongly to Belgium (with NBP at discount to TTF) and Norwegian flows also act to balance hub differentials. But perhaps the most important question is what happens next?
Some factors to watch
This year’s spring decline in spot LNG prices is not unusual. A similar decline was seen in 2012 and 2013 (see Chart 1). Asian demand has historically recovered to support prices over the summer period (e.g. to hedge air-conditioning load and the start of preparations for winter). That will be a key factor to watch this year.
The much anticipated Russian supply cuts for gas via Ukraine are also likely to have an effect from June. We come back to the impact of these in an article to follow shortly. But Russian cuts should provide price support also (albeit well priced into the forward market).
But a couple of factors that normally provide support at low price levels, are unlikely to help this year. High storage levels will reduce injection demand this summer (caveat the impact of Russian cuts). And gas-fired power plants, which typically increase output as gas prices fall, are currently so far out of merit (vs coal plant) that power sector gas demand will provide little support.
As a result, the timing and volume of spot LNG flows into Europe may be very important in determining the extent and duration of the European hub price slump. The structural Asian price premium over Europe is likely to return into next winter. But in the meantime the hub price slump may have further to run. These dynamics are an interesting preview of what will be a much more dynamic global gas market once flexible US LNG exports start to flow later this decade.