This is no ordinary fall in global gas prices

The Fukushima disaster in March 2011 precipitated a shift in global gas market balance. A period of market tightness followed, driven by robust Asian demand and constrained supply growth.  This post-Fukushima period has been characterised by global gas price divergence as Asian and South American buyers have had to pay a premium to attract LNG supply from Europe.

But the last six months has seen a seismic shift in global gas pricing.  Step back to the start of 2014.  As the year commenced, Asian spot LNG prices were near all time highs around 20 $/mmbtu.  Buyers were scrambling to cover both short and longer term portfolio exposures.  There was a strong market consensus that this period of tightness would continue at least until the second half of this decade, when large volumes of new supply are due, if not into next decade.  That market consensus has been shattered by the slump in global gas prices across Q2 and Q3 of this year.

Risk of a shift in global gas balance

The risk of a shift from post-Fukushima market tightness towards a period of global oversupply has been a key theme of this blog. For example:

  • In early May 14 we set out in detail the case for a shift to global oversupply and the associated commercial implications.
  • In Feb 14 we showed a breakdown of the key elements of global supply & demand and how these pointed to the risk of a period of oversupply.
  • In Dec 13 we highlighted a list of potential risks entering 2014, at the top of which was a pronounced decline in Asian spot LNG prices and European hub prices.
  • In Oct 13 we highlighted the importance of new US export supply in driving global price convergence & reducing LNG portfolio flexibility value.
  • In Jul 12 we described the risk of a more structural re-convergence in global gas prices.

We do not claim to have forecast the events of the last few months. But for the last two years we have questioned the strength of market consensus around continuing global gas market tightness.   Price risk in our view has been firmly focused on the downside given bullish expectations, large & chunky volumes of committed new supply and uncertainty around the evolution of demand.

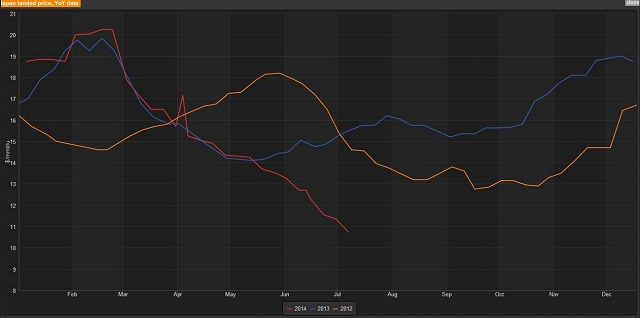
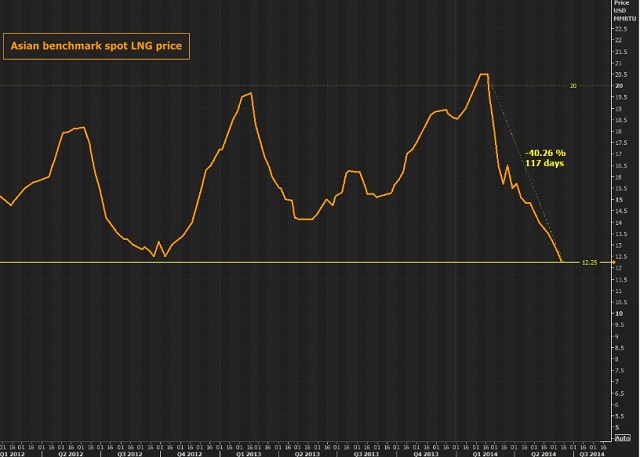
However the pace and global nature of the recent decline in gas prices has been alarming. This is well illustrated in Chart 1 which shows the evolution of LNG spot price benchmarks covering the period since the Fukushima disaster.

Chart 1: Global LNG spot price evolution (2011-14) click on the chart for a blow up view

LNG prices Aug14

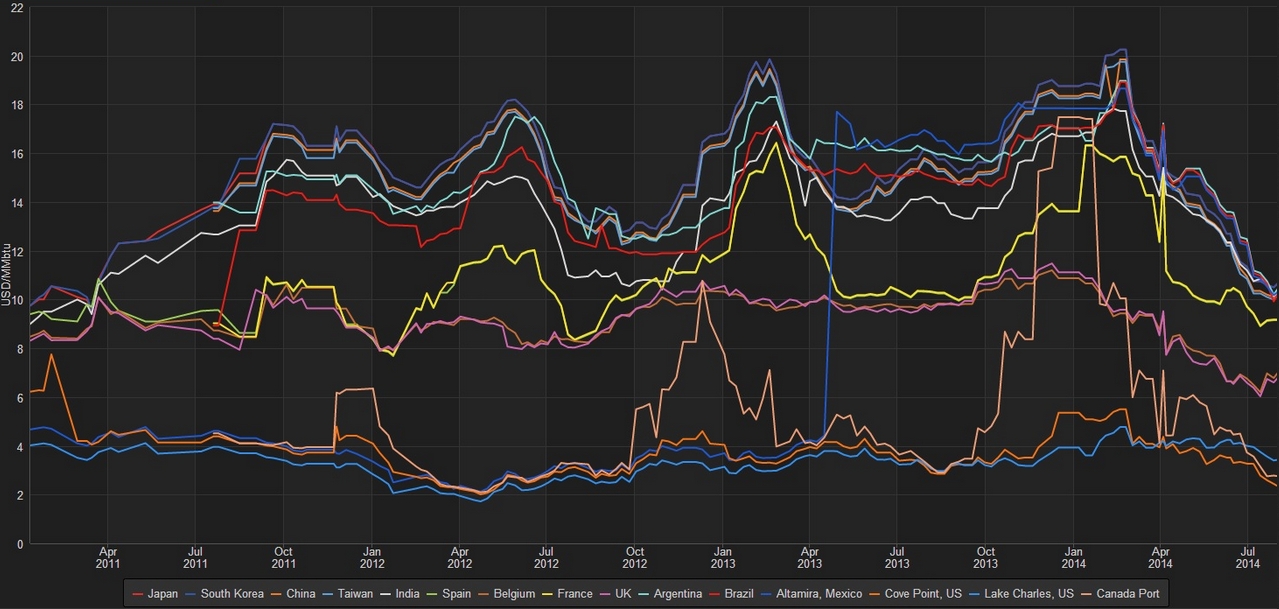
Source: Reuters (using Waterborne spot LNG data)

The rapid divergence of Asian prices after the Fukushima disaster in Mar 2011 can be seen to the left of the chart. Asian price divergence has remained a structural characteristic of the global market across the proceeding three years, although there have been seasonal dips in Asian spot prices over the summers of 2012 and 2013.

But the period from Apr 2014 marks a shift to a much sharper decline in Asian spot prices towards 10 $/mmbtu. As this has closed out the value from diverting European supply, LNG has flowed back into Europe driving down hub prices.  US gas prices have also declined somewhat, although there has been a pronounced convergence in cross Atlantic pricing as European prices have slumped.  As things currently stand, the state of global price convergence is broadly similar to the period preceding the Fukushima disaster in early 2011.

It is easy to get caught up with market momentum and forget that the recent decline is partly seasonal in nature. Largely due to milder weather, European demand for the period October 2013 to April 2014 was 57 bcma lower than the corresponding period in 2012/2013.  In Asia LNG demand (with the exception of China) appears to have flattened out on a 12 month rolling average basis.  While it is widely claimed that this is a weather-induced effect, there is little evidence for this apart from in South Korea.

Prices are already stabilising from their summer lows and may make a meaningful recovery into the winter. For example recent forward pricing for LNG has exhibited quite a steep contango. Spot Asian cargoes for Aug/Sep delivery have recently been changing hands around 11 $/mmbtu, with cargoes for November delivery pricing above 13 $/mmbtu.  While the extent of this winter recovery is uncertain, the price slump into the summer has already shaken market perceptions of the global supply & demand balance.

Some implications of the price shock

One of the more surprising characteristics of the 2014 decline in LNG prices is the fact that it has occurred in the absence of large volumes of new supply. While the Papua New Guinea LNG project commenced exports of spot cargoes in May this year contributing to pressure on Asian spot prices, its impact is relatively small scale in a global market context.  The more substantial volumes of new Australian and US export supply still loom on the horizon as projects ramp up in earnest from 2015.

In Australia 85 bcma of new capacity (under construction) is set to come onstream by the end of 2018. In the US 40 bcma has achieved FID with 23 bcma of this under construction.  It is the impact of this new supply that is spooking the market.  Of key importance is how the recent price shock effects the development of new liquefaction projects and the negotiation of long term contracts.

The early evidence is pointing towards a sharp increase in reluctance from LNG buyers to commit to long term offtake contracts at price levels required by developers.   Australian export projects are particularly vulnerable as they face the joint threats of weak spot prices, US export competition and a rising cost base.  As an example Chevron’s Gorgon project is struggling to sell any additional long term contract cover as reported by Reuters last week.  The $54b project which is due to start exporting in mid-2015 is only 65% contracted, well short of the comfort mark.  In the absence of long term contract sales, Chevron is left with little choice but to sell volume into the Asian spot market and hope for a recovery in prices.  The risk of delays and cancellation for projects which are at an earlier stage of development in both Australia and the US has increased significantly.

We will come back with more detailed analysis of the medium to longer term implications of this year’s price shock in subsequent articles.

The way forward

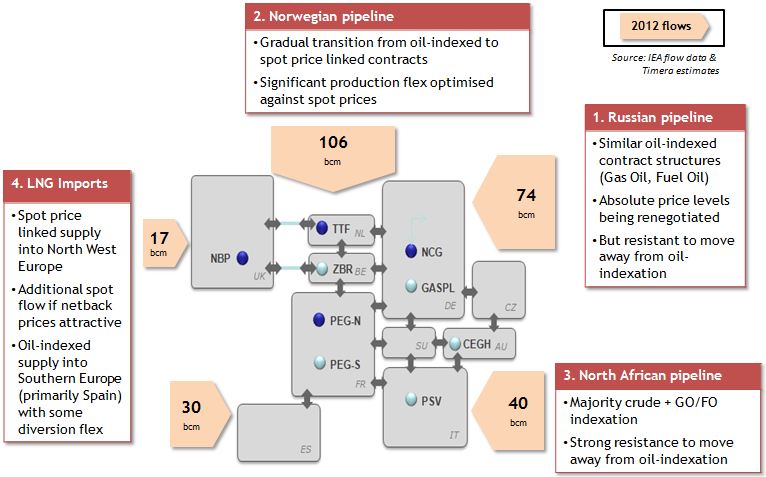
A first observation on the current state of global pricing is that in many markets spot prices are significantly below long term oil-indexed contract price alternatives. This creates a strong incentive for suppliers to minimise their contract take and buy spot gas as a replacement if required.  Coming into the winter, this is an important support mechanism both for Asian LNG spot prices and for European hub prices.  As a practical example, one of the world’s largest LNG buyers Kogas has recently been negotiating to defer up to 10 contracted cargoes from this summer/autumn into the coming winter.

It is also worth noting that the LNG spot market still has relatively low levels of liquidity. This means a cargo overhang can have a pronounced impact on price as has happened over the summer.  Illiquidity could also act to drive a sharper LNG spot price recovery over the coming winter if for example it is unseasonably cold or a major Russian supply disruption results in higher European demand for LNG.

European hub prices are also showing signs of stabilisation as the seasonal focus shifts towards winter and the ongoing threat of Russian supply disruptions. European hub prices provide key support for global LNG spot prices, as liquid European hubs act as a market of last resort for surplus LNG cargoes.  The extent of the recovery of both Asian spot LNG and European hub prices into the coming winter will be an important barometer for the state of the global supply and demand balance.

But regardless of how gas prices recover into the winter, we expect significant fallout from the recent price shock. There is a key risk that as new export projects ramp up in 2015 they contribute to an overhang in spot supply reinforcing global price convergence.  While this poses a threat to the contracting and development of liquefaction projects, it is good news for LNG buyers.  These are conditions that may support a strong pickup in LNG spot market liquidity and potentially the evolution of a more meaningful Asian hub price.

The global gas market has been defined by several distinct phases of evolution over the last decade: the commodity super cycle boom, the US shale and financial crisis driven bust and the post-Fukushima phase of market tightness.  It is our view that the global market is now entering its next phase, potentially one of transition to a period of significant oversupply.  This may have profound implications for the evolution of both gas and power markets over the next few years, a theme which we will continue to explore across the second half of this year.

European hub price volatility on the rise

It is a common characteristic of energy markets that prices and volatility tend to be positively correlated.  This reflects the fact that price distributions tend to be skewed to the upside.  Energy prices rarely go negative, but market shocks can cause explosive price spikes. However, European hub price volatility is on the rise in 2014, and the cause has been a slump rather than a spike in gas hub prices.  This is likely to have some interesting implications for the value of gas supply flexibility.

European hub price volatility

Hub price volatility has been at depressed levels for most of the last 3 years.  There have been brief periods of price spikes caused by infrastructure issues over the last two winters.  But market stability has quickly returned as an oversupply of flexibility dampened hub price reactions.  Chart 1 shows the evolution of day-ahead prices and historical volatility at the Dutch TTF hub (as a proxy for North West Europe).

Chart 1: TTF day-ahead prices and historical volatility (2007-14)

TTF DA Prices & Vol

Source: Timera Energy using LEBA prices

It can be seen from the volatility chart that day-ahead volatility ranged around the 80% level across the 2007-10 period.  However over the 2011-13 period volatility slumped to levels below 40% (excluding the price spikes of Feb 12 and Mar/Apr 13 that we have previously addressed on this blog).  A steady recovery in day-ahead volatility can be seen in 2014 as hub prices have rapidly declined.

There is an intuitive explanation for the recent pickup in hub price volatility.  The market has been in a reasonably subdued ‘steady state’ over the 2011-13 horizon with hub prices loosely tracking oil-indexed contract prices and healthy levels of portfolio supply flexibility.   The sharp reduction in hub prices in 2014 represents the European gas market breaking out of that state of relative stability (as we set out last week).

The associated increase in uncertainty around future price levels (assisted by the ongoing Russia – Ukraine dispute) and associated impact on portfolio exposures, is reflected in price volatility as players adjust their portfolio positions.  The 2014 price slump has to a large extent caught the market by surprise and price volatility is rising as a result.

In addition some of the key providers of gas supply flexibility are currently relatively constrained.  For example oil-indexed contract swing is out of the money given low hub prices and seasonal storage capacity across Europe is relatively full.

Implications for gas flexibility value

The oversupply of gas portfolio flexibility and associated slump in volatility over the last three years has dampened market interest in flexible assets and flexibility products.  Gas storage capacity has been particularly hard hit as both seasonal spreads and volatility have declined.  But there has been a renewed interest in supply flexibility as 2014 has developed, particularly in mid to fast cycle storage capacity.

Fast cycle storage is best placed to take advantage of value opportunities from prompt price volatility.  For example taking advantage of the temporary price spike after Russia announced it would cut Ukranian supply or the price dips as high volumes of LNG have flowed into hubs.  The widening of the seasonal spread between Summer 14 and Winter 14/15 also represents a stronger price signal for the seasonal utilisation of slower cycle storage assets.  This reduces the competition that fast cycle storage faces from seasonal facilities in providing shorter term deliverability.  The available capacity product range sold by mid to fast cycle storage buyers has improved over the last few years as new facilities have come online.  There may be a significant increase in liquidity of these products if the 2014 recovery in prompt volatility continues.

This is our last article before the Blog takes a summer break. We will be back towards the end of August. In the meantime have a warm and relaxing summer..

Gas hub pricing in a state of flux

As the summer heats up spot gas prices have continued to slump.  Asian LNG cargoes are changing hands at under 11 $/MMBtu, price levels not seen since Fukushima.   The reaction of European hub prices illustrates the global gas price linkage that has evolved with the LNG market.  UK NBP spot gas prices are now around 35 p/th (TTF spot around 15 €/MWh), a 50% fall from the end of last year.  As surplus gas continues to flow into Europe and re-shape the hub price landscape, we are publishing a two part series on European hub pricing dynamics.

In this article we look at the linkage between Asian LNG prices and European hub prices, as well as some of the characteristics and implications of the current hub price decline.  In next week’s article we look at some of the factors driving European gas supply flexibility value, specifically hub price volatility and price divergence across hubs.  In both articles we again apply the framework we set out previously for understanding European hub price dynamics.

The price slump continues

A mild European winter and spring has blossomed into a warm summer.  Good for the holiday season but not for European gas demand.  Asian LNG demand has also been weak and falling spot prices have resulted in an increase in LNG flow into European hubs.  This is partly the result of surplus Qatari LNG flow (as we explained here) and partly due to a decline in the diversion of European LNG supply given low Asian spot price levels.

The power and gas team at Reuters have put out some good charts recently that illustrate the current price moves in an historical context.  Chart 1 shows the 2014 Asian spot price decline against the context of 2012 and 2013 LNG spot price seasonal shape.  Previously Asian spot prices have found support in the 12-14 $/MMBtu range as at these levels European hubs start to soak up surplus cargoes.  But weakness in European pricing this summer has seen a continued decline in Asian spot prices.

Chart 1: Evolution of Asian LNG spot prices (Japanese benchmark) 2012 – 2014

Reuters Asian LNG s

Source: Reuters

What is driving hub prices now

Our framework for European hub pricing revolves around understanding the marginal sources of flexible supply that drive hub price dynamics.  Gas prices tend to be anchored in a loose band around oil-indexed contract prices, with contract swing, production flex (e.g. Statoil) and storage the main drivers of marginal pricing.  The current market dynamics have knocked European hub pricing dynamics out of this state of relative stability, as shown in Chart 2.

Chart 2: Global gas price benchmarksgas price chart

Source: Timera Energy

Weak demand and surplus LNG flow have caused hub prices to disconnect from oil-indexed contract levels.  This disconnection has happened previously (e.g. post financial crisis in 2009) and it tends to be a temporary or transitional effect (as can be seen in Chart 2).  What is important, is to understand the marginal sources of supply that can react to stem the hub price decline, for example:

  • Storage typically provides summer price support as facilities inject in preparation for the winter.  But after a mild winter, storage balances are relatively high (e.g. average levels above 80% across Germany, the UK and the Netherlands) so injection demand is weaker.
  • Flexibility within supplier portfolios has increased in price responsiveness as trading functions optimise flexibility against hub prices (e.g. substituting cheap spot gas into the portfolio where possible to replace higher cost sources).  However most of this flexibility is likely to have already been utilised (e.g. swing contract volume take minimised).
  • LNG flow is typically relatively price insensitive in times of weak prices, given limited production flexibility.  Although the Qataris are reportedly taking some steps to curb production to alleviate further pressure on prices.

That leaves the power sector to play an important price support role.  Since 2010, coal plants have enjoyed a substantial competitive advantage over gas plants in Europe, given declining coal prices.  This year’s gas price slump has eroded that advantage and coal and gas plants are starting to compete again to set marginal power prices.  This is most visible in the UK power market where new high efficiency CCGT plants are starting to displace older coal plants in the merit order, increasing power sector gas demand.   It is worth keeping an eye on gas vs coal switching levels going forward, because if hub prices continue to decline these will become a key price support benchmark.

Some implications of the price slump

Gas producers are nervously observing the current price decline for an indication as to whether this is a one summer phenomenon or a more structural change.   The deeper the slump and the longer it continues the broader the commercial implications are likely to be.  Of primary interest is the threat of another round of European long term gas contract price re-openers.  Over recent years, suppliers have been relatively successful in recovering concessions from producers as they have suffered the impact of spot (and hence retail) prices falling relative to their contract cost base.

Another key consideration is the impact of the global spot price slump on LNG liquefaction projects.  A number of projects without long term contract cover are feeling the squeeze on both sides.  The spot price slump is reducing their bargaining power with buyers at the same time they are trying to control project cost blowouts.  This is an issue across Australia, Canada and the US.  The Reuters team have provided some interesting background on the impact of falling spot LNG prices here as well as an illustration of the US vs UK spot price spread in Chart 3.

Chart 3: Global spot price evolution squeezing US LNG export projects

Reuters NBP price fall

Source: Reuters

All eyes in the gas market will be on how spot prices recover into this winter.  Weather will of course play an important role (just as it has done this year).  But it is worth noting that consecutive warm winters have been observed in Europe over the last decade (i.e. they can come in groups).  But just as important as the weather will be the way that large portfolio players react to the price declines and how this impacts the marginal sources of supply flexibility.  One of the interesting dynamics that can be observed over the last few months is that hub price volatility is increasing despite the price declines.  We come back to explore that dynamic in more detail next week.


Investment in UK peaking assets

The new Capacity Market may be set to turn UK generation investment on its head.  Power plant development in the UK has historically been focused on combined cycle gas turbine (CCGT) plants rather than peaking assets.  CCGT have a clear efficiency advantage over peaking plants and with 30GW of existing CCGT capacity, UK merit order competition between gas plant is fierce.  As a result it has historically been hard to build an investment case for peaking assets, except as onsite backup or for the provision of ancillary services (e.g. STOR).

But recent clarifications on the Capacity Market rules and the availability of 15 year fixed price capacity agreements have caused a sharp increase in interest in UK peaking asset development.  Peaking units are cheap and scalable relative to CCGT assets.  And unlike CCGTs, the peaker investment case does not rely on volatile wholesale energy market returns.  This means that peaking assets are able to access a more flexible range of financing structures to enhance equity returns.  These are attractive characteristics in a world awash with cheap capital looking to invest in relatively low risk infrastructure projects.

Capacity Markets favour peaking assets

On first consideration it may appear strange that policy decisions could swing plant investment economics in favour of peaking assets.  The main driver behind this is the government’s Electricity Market Reform (EMR) package.   Large scale support for intermittent renewable capacity (wind & solar) is acting to lower wholesale power prices and erode CCGT load factors and generation margins.  The Capacity Market is then intended to enable the government to ensure there is an adequate volume of flexible capacity to maintain a targeted system security standard.

The UK government has designed the Capacity Market such that the underlying product is capacity to generate electricity at four hours notice.  Capacity is de-rated based on availability by technology type (e.g. OCGT at 94% and CCGT at 88%).  There are also different lengths of capacity agreement available (1, 3 and 15 years) based on level of capex incurred, e.g. at least 250 £/kW spend is required to secure a 15 year agreement.  But the definition of ‘capacity’ for the market is quite homogenous (e.g. plant location is not considered).

A homogenous product and capex based capacity agreement lengths bring the costs of capacity provision firmly into focus for investors.  Keeping existing thermal capacity open is set to be the cheapest source of capacity (e.g. by covering plant fixed costs).  But beyond this, investors are increasingly focusing on how incremental capacity can be delivered at close to the 250 £/kW threshold required to qualify for 15 year capacity agreements.  This is where peaking assets may play a key role.  And not necessarily leading edge high efficiency gas turbine units.  Projects based around older and less efficient technology may be more attractive given lower capex costs.

This again sounds strange on first consideration.  The government is implementing EMR to decarbonise the power market, not to encourage investment in lower efficiency thermal peaking units.  But one of the key objectives of the Capacity Market is to ensure that there is enough flexible plant to backup wind and solar capacity in the (relatively few hours of the year) when the wind doesn’t blow and the sun doesn’t shine.  This means a relatively high volume of capacity is required at the back of the merit order, to run for a small number of hours a year (i.e. with a low emissions impact).  For these assets unit efficiency, emissions intensity and variable generation cost are of little relevance.   What is of primary importance is low fixed and capex costs, which are characteristics of peaking units.

windpeak

Peaking asset economics

As CCGT technology has matured over the last decade, unit costs, flexibility and efficiency rates have converged across different plants.  CCGT capex costs on an ‘all in’ basis are around 650-700 £/kW, with fixed costs of 15-20 £/kW/year.  This now buys unit efficiencies upwards of 53% on an HHV basis. And efficiency is key, because an investor in a new CCGT plant wants to displace existing CCGT plants (and over time coal plants as well).  Given higher capital costs, earning a reasonable wholesale energy margin is a key driver of CCGT investment viability.

There is a much broader range of peaking generation technology options.  For example:

  • High efficiency open cycle gas turbines (OCGT), with efficiency levels approaching those of older CCGT plants and capex costs ranging around 500 £/kW.
  • Conventional OCGT, with lower (e.g. 35-40% HHV) efficiency levels, capex costs as low as 350 £/kW and fixed costs around 10 £/kW/year.
  • Small scale diesel generators and reciprocating engines, with lower efficiency, capex below the level of conventional OCGT (e.g. down to 250 £/kW for cheaper units), and with annual fixed costs that can be very low.

A key feature of the investment case in peaking assets is that wholesale energy margin is of little concern.  There may be interesting value opportunities in the Balancing Mechanism and reserve markets.   But large volumes of higher efficiency existing CCGT and increasing renewable build mean that peaking plant load factors and energy margins are set to remain very low.  That sounds unfortunate from an investment perspective, but it has two important benefits.  It removes concerns around:

  1. Wholesale energy market margin risk that CCGT assets face.  The peaker investment case is focused on locking in capacity market margins under 15 year fixed price agreements which reduces risk from volatile and eroded spark spread margins.
  2. Incurring higher capex spend to achieve higher plant efficiency and hence lower variable costs.  If a peaking plant runs at very low load factors then variable cost is a lower priority.

Because capturing energy margin is a lower priority for peaking assets, project focus shifts to achieving low fixed and capital costs.  If a developer can build peaking capacity with a low fixed cost base and a capex cost close to the 250 £/kW threshold (e.g. on a site with existing generation infrastructure), this may form the basis for an attractive bid for a 15 year agreement in the Capacity Market, with returns supported by significant project leverage.  Come the first auction in December, this type of project may be a very competitive source of new capacity.  We will come back and explore the impact of increased peaking asset investment on wholesale energy market pricing in a subsequent article.


A practical view of the flexibility value of gas and power assets

Flexibility value has become a popular concept in energy markets.  At a qualitative level the benefits of flexibility are reasonably well understood.  Increasing intermittency in power markets requires flexible backup.  This has a knock-on impact with gas markets where supply flexibility is evolving in response hub price signals.

What is less well understood is how to analyse and quantify the flexibility value of gas and power assets.  Investors in particular continue to be wary of paying for ‘extrinsic value’, the more technical jargon for flexibility value.  This is with some justification given that extrinsic value is often inflated via theoretical modelling analysis, rather than being demonstrated via a more practical analysis of how asset flexibility can be realised in the market.

But current market conditions are forcing asset investors and owners to confront extrinsic value.  Relative pricing dynamics mean that flexible gas & power assets increasingly have ‘at the money’ optionality characteristics, meaning extrinsic value is a key component of asset value.  Take two examples:

  1. CCGT’s across Europe have been driven out of merit as coal prices have fallen relative to gas prices.  As a result most assets have variable costs that are at or above the level of wholesale power prices.   In other words they can be characterised as strips of ‘at the money’ or ‘out of the money’ options with capture of extrinsic value being a key focus.
  2. Gas storage assets have faced a steady decline in seasonal (summer/winter) hub price spreads over the last 5 years.  As a result the intrinsic value that can be locked in against forward prices has fallen and storage flexibility has become more focused on monetising volatility across spot and forward prices (extrinsic value).

Extrinsic value is about more than prompt volatility

There is a common misconception that extrinsic value is all about capturing short term (or prompt) volatility in market prices.  While a theoretical modelling approach may promise high returns from flexibility to respond to short term price movements, there are practical limitations in monetising this value.  Risk appetite, liquidity constraints and transactions costs all present hurdles.  And given day-ahead and within-day prices for gas and power can be very volatile, forward hedging of assets tends to reduce short term extrinsic value access.

However extrinsic value is more than just prompt volatility.  To appreciate this concept it is important to clarify the two components of asset value:

  • Intrinsic value refers to value that can be observed (and hedged) against current forward market prices.
  • Extrinsic value refers to all other value that can be generated by the flexibility of the asset to respond to changes in forward prices, but cannot be observed/hedged at the time of valuation.

As well as short term price fluctuations, extrinsic value includes more substantial deviations in commodity prices that were not observable in forward prices at the time of asset valuation.  The impact of the current slump in summer gas prices on gas storage asset value provides a useful case study.

Gas storage value from hub price curve swings

At the start of 2014 the UK NBP price spread between Summer 2014 and Winter 2014/15 was about 6p/th.   With the slump in summer gas prices that has ensued across the first half of this year, the spread between prices this summer and Winter 2014/15 has blown out towards 20p/th as illustrated in Chart 1 (yellow line shows winter contract, purple line NBP day-ahead spot and the white line the spread between these two prices).

Chart 1: UK NBP price spread between spot and Winter 2014/15

UK gas spread 2A

Analysis of gas storage asset value based on the extrapolation of intrinsic forward price spread conditions, misses the extrinsic value generated from price movements like the one shown above.   This is not extrinsic value generated by short term spot price volatility (although spot vol has also increased over this period).  But it is value generated from within year shifts in the relative pricing of gas along the forward curve.  The impact of the current supply glut across European hubs is focused in the current year with limited impact from 2015 and beyond (e.g. the Summer 15 vs Winter 15/16 NBP price spread is only around 8 p/th).

Values for CCGT and gas storage assets have plummeted as intrinsic values have fallen over the last 5 years.  Some of these assets are not viable investments given structural weakness in margins relative to fixed costs.  However there are also increasingly opportunities to buy good assets cheaply (e.g. at a fraction of replacement cost).

In order to do justice to flexible asset valuation under current market conditions, the valuation approach needs to reflect:

  1. A realistic simulated distribution of asset returns capturing potential movements in commodity prices
  2. A pragmatic view as to how price movements can be monetised via asset flexibility response

Over time, assets are increasingly likely to go to buyers who understand how to quantify, risk adjust and monetise extrinsic value.

Europe’s dependence on Russian gas

The protracted standoff between Russia and Ukraine came to a head last week as Russia implemented supply cuts.  But European gas hub prices hardly blinked.  In the short term, the European gas market is well equipped to deal with targeted Russian supply cuts.  Storage levels across Europe are high and a steady flow of LNG into Europe means hubs are well supplied.  Europe also no longer depends so heavily on single transit pipelines, given the development of new transport infrastructure (e.g. Nordstream).

However the Ukrainian supply problems are reminding Europe of its dependence on Russian gas.  European has shown a tougher stance against Russia this year (encouraged by the US).  For example, Bulgaria recently pulled its support for Southstream.   But while some members of the EU are pushing an aggressive stance, the response from large European importing nations has been more measured.  Countries such as Germany and Italy are acutely aware of the key role that Russian gas supply plays in their energy supply mix, both in terms of meeting current requirements and for satisfying future incremental demand.

Broader or more prolonged Russian supply cuts would be a more serious issue, but one that is much less likely.  Russia is well aware of its reliance on gas export income.  And using supply as a political tool does not play well with the customers Russia is courting to the East.  Russia is more focused on building long term export relationships than threatening existing customers.  So the unpleasant reality is that as domestic European production declines, Russia is best placed to fill the gap.  In this article we explore both the short term and long term dependence of Europe on Russian imports.

The short term impact

Anyone waiting for a big rally in gas hub prices as a result of Ukrainian supply cuts was disappointed last week.  When the Russian supply cut finally came, it only acted to illustrate how oversupplied the European gas market currently is.  Prices across the forward curve briefly spiked on Monday in a relief rally, before continuing their 2014 decline.  Chart 1 shows the spike in the NBP Winter 2014/15 contract after the announcement, which was more than reversed on the following day.

Chart 1: Evolution of NBP Winter 14/15 forward contract in 2014

Winter 1415 chart

Source: Reuters

The Russian supply cuts are primarily intended to resolve payment issues with Ukraine rather than as a broader threat to the rest of Europe.  The cuts could not have been timed to have a more benign market impact, given a mild winter, plenty of warning, ample gas storage levels and alternatives for Ukraine to source gas across the summer.

For the Russia – Ukraine standoff to have a more meaningful impact on hub prices it would need to drag on towards winter.  That is not out of the question given that gas supply negotiations are clearly linked to larger geo-political tensions.  But Chart 1 shows little concern as to this outcome reflected in forward market pricing.  Even in the case of a more prolonged dispute, Europe is much less dependent on Russian gas than in the previous periods of Ukrainian supply cuts (e.g. 2006 and 2009).

There are a number of supply flexibility options for filling a temporary import gap via Ukraine.  Gas in storage provides an important backstop (typically flowing based on the opportunity cost of alternative supply sources).  There is also room for increased Russian imports via other transit routes and some flexibility to ramp up Norwegian supply.  But gas flows will be driven primarily by commercial & portfolio considerations.  That is, gas will flow based on hub price signals.

The ultimate backstop in case of broader or more prolonged Russian supply cuts is increased LNG imports.  Europe has large volumes of un(der)-utilised regas capacity.  But importing LNG means paying up to compete with Asian and South American buyers.  Spot LNG cargoes are currently relatively cheap for European buyers given a slump in Asian prices, but prices will likely increase again as Asian seasonal demand recovers into next winter.  The last three winters have seen a 4-6 $/mmbtu price spread between European hub prices and netback Asian spot LNG prices.  That is an unpleasant gap for European buyers to bridge over a more prolonged period.

The longer term problem

In the longer term, Europe faces a more difficult dilemma as to cost of gas versus security of supply.  While there has been plenty of political rhetoric about striving for independence from Russian energy, Europe is facing the reality of declining domestic gas production.  Chart 2 shows the key sources of gas supply into European hubs.

Chart 2: Sources of gas supply into Western Europe

2012 Gas Flows

Source: Timera Energy

We have set out in more detail how these sources interact to drive hub prices.  UK and Dutch supply is now in rapid decline, which could become more pronounced if seismic activity linked to gas production increases in the Netherlands.  Norwegian supply has plateaued and is unlikely to offer significant incremental growth potential (as is North African supply).  European shale gas production is also unlikely to make a substantial impact until well into next decade.

This leaves Russian pipeline gas and LNG imports as Europe’s two main alternatives for meeting incremental demand growth over the next decade.  LNG imports offer supply diversification benefits, with regas terminals providing an important security of supply insurance role.  But the cost issues with LNG imports are similar in the long term to those described above in the short term.   Meeting incremental demand growth via LNG imports means Europe needs to compete with Asia for supply.

With LNG the only credible large scale alternative, Russia is well placed to meet incremental European demand.  Estimates of uncontracted Russian production that could be sold into Europe range from 60-100 bcma.  Russia has both the capacity and willingness to sell additional gas into Europe, as long as it does not undermine the oil-indexed pricing terms of existing supply contracts.  So although it may be an increasingly uncomfortable relationship, Europe is set to remain dependent on Russian gas (and Russia on European payment) for the foreseeable future.

LNG portfolio implications of a tight vs oversupplied market

Until recently there has been a strong market consensus that LNG market tightness will continue well through this decade. But the recent Russia-China pipeline deal and plunging Asian LNG spot prices (shown in Chart 1 below) have shaken that consensus. The LNG industry is becoming increasingly concerned over the possibility of a transition towards a state of oversupply as the decade progresses.

The potential for LNG oversupply has been a theme of this blog over the last 12 months. In a recent article we set out the factors that could drive a transition from tightness to oversupply. We now consider the implications of a tight versus oversupplied market on LNG portfolio value.

 Chart 1: Recent Asian LNG spot price slump

Asian Spot LNG updated

Source: Reuters

A tight versus oversupplied LNG market

Tight market continues

If the post-Fukushima tightness continues the LNG market will continue to favour sellers, with incremental volumes of new supply (e.g. from Australia and the US) absorbed without a major pricing impact. Premium markets (e.g. in Asia and South America) will continue to attract flexible supply with higher prices. However, the flexible nature of US export supply contracts should act to some extent to dampen global LNG spot price differentials and spot volatility.

In this outcome, the long run marginal costs of incremental supply (e.g. from Australia, Canada, the US and East-Africa) are likely to drive longer term supply contract pricing. Producers are also likely to be in a position to ensure oil-indexation remains dominant. But flexible US export supply contracts will increase the influence of Henry Hub (HH) on LNG spot market price dynamics. The majority of US and divertible European supply will likely flow to Asia and South America, but spot market volatility should continue to ensure the ‘fallback’ utilisation of European regas terminals in times of low Asian spot prices (as it has over the last three summers).

Transition to oversupply

If an oversupply situation develops, the LNG market will instead shift to favour gas buyers. Surplus gas will flow into the LNG spot market, increasing liquidity & the influence of both European and US hub price signals. US exports will likely have a disproportionate influence on spot prices given their flexibility and the fact that utilisation of US LNG with a Henry Hub cost base will be driven by netback spot price signals.

This outcome is much more supportive of a transition to hub indexation for new long term LNG supply contracts. Henry Hub and NBP are the obvious candidates, but an Asian spot hub may develop also, although it is likely this would be strongly influenced by the HH/NBP Atlantic price signal. US export and European supply contract flexibility will likely have a more significant impact in driving global LNG spot price convergence & dampening volatility. Global price convergence should support an increased flow of gas back into Europe and the higher utilisation of European regas terminals. This may cause significant downward pressure on European hub prices and spark another round of long term supply contract renegotiations.

Contract and portfolio implications

Recognising uncertainty

In our view the first factor to accept is the reality of uncertainty around the evolution of the LNG market balance and future pricing dynamics. This is an inevitable bi-product of the rapid growth & relative immaturity of the LNG market (e.g. compared to the oil market).

‘Betting’ on market outcomes is a risky business. So commercial or investment decisions that depend heavily on market balance or pricing dynamics should be made with a clear recognition (& pricing) of the risk involved. Several factors could drive structural changes to market dynamics e.g. weaker Chinese LNG demand or supply contract hub price penetration.

Current market expectations reflect the post-Fukushima period of market tightness, price divergence and volatility. The LNG market may transition to a very different state by the end of the decade.

Supply contract pricing

Supply contract terms (e.g. price levels and indexation) will be driven by the balance of power between sellers & buyers. Contract hub price linkage is set to increase, with US exports an important driver, particularly if oversupply develops. We addressed some of the potential outcomes with Asian supply contract pricing in our last article.

An important theme in the negotiation of supply contracts is ensuring contract structures that reflect uncertainty over market evolution, and apportion value and risk appropriately. This may incorporate the sharing of value upside (e.g. from diversion flexibility). It may also include the sharing of downside risk exposure (e.g. oil vs gas hub price risk).

LNG influence on European hubs

The link between LNG spot prices and European hub prices has been convincingly demonstrated over the last three months. Weakness in Asian spot prices (currently trading close to 12 $/MMBtu) has seen a substantial increase in LNG flowing back into European hubs as a liquid alternative. This could happen on a much larger scale if Asian spot prices remained weak for a more prolonged period as a result of a period of global oversupply. The increase in European supply contract flexibility that has been negotiated post Fukushima has resulted in a larger volume of divertable LNG supply that can return to Europe if prices in premium markets weaken.

Europe is unlikely to have a structural requirement for large volumes of new LNG this decade (given pipeline supply options). However, LNG supply contracts may still play an important role in meeting the incremental requirements of larger European gas portfolio players (even if the LNG flows elsewhere). An increase in the volume of flexible US exports as the decade progresses should strengthen the Henry Hub vs NBP relationship over time, even if US gas predominantly flows to Asia.

Case study: European regas terminal implications

The table below illustrates some of the challenges faced by European regas terminal operators, given that the approach to monetising regas terminal value and developing/selling new capacity differs in a tight vs oversupplied market.

Terminal challenges

Tight market continues

Transition to oversupply

Regas utilisation

High Asian spot price levels & volatility. European supply diverted. Continuation of reloads when Asian LNG spot prices are high and ‘fallback’ spot cargo flow into Europe when they are low.

Asian prices reconnect with Europe causing a fall in diversions. Lower spot volatility but an increase in spot trading & cargo flow. Higher European terminal utilisation but decreased cases of reloads.

Regas capacity pricing

Key → extracting value from ‘fallback’ flow + security of supply benefits. Tariffs need to reflect short term nature of spot cargo flow.

Increase in regas capacity value given higher utilisation. Greater interest in long term capacity access. Short term access also key with increase in spot trading.

Existing terminal monetisation

Important to reduce logistical barriers (e.g. scheduling, port/storage access) to maximise capacity value from short term opportunities.

Reducing logistical barriers also important with higher spot liquidity. Profiling of capacity sales to reflect potential increase in capacity value.

Capacity expansion / new terminal development

Opportunistic development driven by reloads, new markets & security of supply (e.g. Baltic, Med).

Higher terminal utilisation may support NW European terminal expansion. Terminal development in new Med/Baltic markets supported by cheaper LNG.

LNG portfolio value impact

Producers face the greatest risk from the transition to an oversupply scenario. Falling prices would clearly threaten the viability of many uncontracted new liquefaction projects. This is particularly an issue in countries where project costs are increasing rapidly (e.g. Australia and Canada). If an oversupply situation does develop, it is the cancellation or delay of new projects that will likely act over time to alleviate the LNG surplus.

Suppliers stand to gain from falling prices in the sense that they may be able to contract new supply on more favourable terms. However, continued concern from some Asian buyers at being exposed to spot prices in tight periods may limit the pressure they apply in negotiations over new supply.  There are some key risk considerations around price exposures on existing LNG supply contracts. European suppliers are familiar with the pain that lower spot prices can inflict on legacy contract positions, given the linkage between spot prices and retail pricing. There are some prudent contract and portfolio structuring measures that can be taken now to manage the risks posed by spot price declines.

There is also an important risk for both producers and suppliers that an oversupply scenario reduces global price spreads and volatility, eroding LNG supply flexibility value. The (re)negotiation of supply contract flexibility value has been a key industry focus post-Fukushima, with market players placing a hefty value premium on access to flexibility.

A view on the risk of an oversupply outcome is an important factor driving commercial strategy in negotiating supply contracts. For example, a view on market outcome is important in:

  • Valuing the flexibility implicit in a supply contract pricing structure
  • Choosing whether to pay for flexibility with cash versus other contract concessions
  • Deciding whether portfolio focus is on ‘buying’ new flexibility versus monetising existing flexibility
  • Timing the purchase or sale of incremental portfolio flexibility

An oversupply scenario may be relatively short lived, or it may not eventuate at all. But the risk around a transition to an oversupplied LNG market is increasing. Now is a good time to take some defensive measures, in case that risk becomes a reality. And defence need not be the only focus. As market uncertainty increases, there are likely to be attractive opportunities to create portfolio value via exploiting differences in company expectations of future outcomes.

Interconnectors – a competitive source of new capacity for the UK power market

The UK Capacity Market is currently being implemented to ensure new flexible capacity is built as older plants retire.  While generation investors are focused on trying to assess the relative benefits of CCGT vs OCGT capacity, new interconnector capacity is quietly looming as an increasingly competitive alternative.

Interconnectors have been excluded by the UK government from participating in the first auction later this year.  But the government has firmly signalled its intention to include interconnector capacity in the 2015 auction.  In addition to Capacity Market support, Ofgem is paving the way for additional regulatory support in the form of a cap and floor mechanism for interconnector revenues.  With a substantial positive power price differential from Continental markets to the UK, interconnector investment projects are an increasingly attractive proposition.

The cost angle

Capex cost is a good place to start when comparing interconnector capacity with power plant alternatives.  The cost of interconnector capacity tends to be a function of the distance of the link and the engineering challenges in laying the cable.

The BritNed line (UK to NL), commissioned in 2011, provides a reasonable benchmark for the capital costs of laying shorter interconnectors across the English Channel.  BritNed cost roughly £500m for 1GW of capacity, or 500 £/kW on a normalised basis.  This broadly compares to the ‘all in’ cost estimates for the proposed Belgium to UK project (NEMO) and a new UK to FR interconnector.

Costs can vary around this 500 £/kW benchmark depending on project characterstics.  The 1GW Eleclink project (being developed by Eurotunnel and Star Capital) is likely to be significantly cheaper, given it involves laying cable through the existing Channel Tunnel.  The proposed 1.4GW NSN link between Norway and Scotland on the other hand is over a much greater distance with costs closer to 1000 £/kW.

But if we assume 500 £/kW as a reasonable cost benchmark for short interconnection projects, then this is a similar level to new build OCGT capex, and compares favourably to CCGT new build at around 700 £/kW (all in).  But cost competitiveness is only part of the picture.  Wholesale energy revenue dynamics also play an important role.

The energy margin angle

There are some parallels between the market exposures of interconnectors and gas-fired power plants in that they can be characterised as strips of spread options.  Interconnector value is driven by locational price spreads.  Whereas gas plant value is driven by gas vs. power price  cross-commodity spreads.

For shorter interconnection projects (to FR/NL/BE), the key driver of revenue is the spread between Continental power prices (predominantly set by coal prices) and UK power prices (predominantly set by gas prices).  The locational forward market price spreads between the Continent and the UK are currently substantial, rising above 20 £/MWh from 2016 as illustrated in Chart 1 below.

Chart 1: Baseload calendar price spreads between Netherlands and UK

UK-NL Power Spreads

Source: Timera Energy

The revenue dynamics for the Norwegian interconnector are even more attractive given Norwegian power prices typically trade at a substantial discount to the UK (in normal and wet hydro conditions).

But as with CCGT investment projects, somebody needs to bear the asset’s market risk exposure (i.e. the fluctuations in locational price spread levels).  This is where regulatory support will play a key role.

Policy support mechanisms

There are two main sources of potential regulatory support for UK interconnector developers:

  1. Inclusion of interconnectors in the UK Capacity Market (targeted by DECC for 2015)
  2. A cap and floor regime being designed by Ofgem to limit developers exposure to market risk

The cap and floor mechanism is a hybrid policy support mechanism based on a combination of the UK’s merchant interconnector model and the regulated asset model used on the Continent.  It is being designed to support the UK – Belgium NEMO interconnector project.  But Ofgem’s intention is to extend this template to support other interconnector projects.  Under the design, if revenues rise above a pre-determined cap level they are returned to consumers.  While if revenues fall below a floor level the asset owner is supported by consumers (via network charges).  Ofgem has proposed that the cap and floor levels are fixed ex-ante and escalated for inflation.

Inclusion of interconnectors in the Capacity Market would allow access to an additional capacity revenue stream, potentially under 15 year fixed price capacity agreements.  But the key regulatory issue that remains unresolved is how interconnector capacity will be de-rated for availability, given dispatch is not directly controllable.  That is a challenge for DECC to overcome before including interconnector projects in the 2015 capacity auction.

Investment dynamics

A combination of the factors outlined above mean that interconnector capacity may be in a strong position to displace new CCGT build:

  1. A number of shorter projects look to be cheaper on a straight capex basis
  2. There is likely to be a significant boost in policy support over the coming year
  3. The widening  spread between gas and coal prices (which is causing so much pain to CCGT owners) is working in favour of interconnector projects, as locational power price spreads between the Continent and the UK increase accordingly

The last of these three factors means that interconnector capacity is actually an attractive diversification option for owners of gas plant portfolios.

The last factor which plays in favour of interconnectors is access to finance.  Unlike gas-fired power plants running at low load factor, the risk profile of interconnector investments is much more consistent with that of traditional infrastructure and pension fund capital.  This is particularly the case with a cap & floor revenue support structure and the ability for asset owners to sell multi-year capacity contracts to reduce market risk.  It is our view that interconnectors can play a central role in providing the incremental flexible capacity that the UK requires into next decade.

Russia – China deal to shake up global gas market

The Chinese have driven a hard bargain in closing a 38 bcma supply deal that is priced on a similar basis to Russia’s existing European supply contracts.  But in return, Russia has secured a central role in supplying the Asian gas market over the next decade.  Russia has also thrown down the gauntlet to LNG exporters courting China.

The Russia – China deal and the associated Power of Siberia pipeline should facilitate both:

  1. Future incremental sales of pipeline gas to China, both from Gazprom and potentially other Russian producers.
  2. The future export of Siberian gas from east coast Russian LNG terminals, on the doorstep of Asia’s largest buyers, Japan & Korea.

These factors present a substantial competitive threat to as-yet-uncontracted LNG producers in Australia, Canada and Africa, particularly given the higher combined production & shipping cost base of these exporters.  The impact of the Russian deal in displacing Chinese LNG demand also increases the likelihood of the LNG oversupply scenario that we set out last month.  As Russian gas starts to flow east later this decade, the Chinese border price could become an important benchmark in driving Asian gas pricing.  China however may have other ideas.

Deal summary

Deal volume & infrastructure

An initial agreement has been reached on 38bcma of gas, which will flow from Russia’s Eastern Siberian gas fields down a new ‘Power of Siberia’ pipeline into gas hungry North Eastern China.  The pipeline within Russia is then planned to continue onto Vladivostok to support future Russian LNG exports.  The route is shown in Chart 1 below:

Chart 1: Route of new gas from Russia into China

Russia gas map

Source: Gazprom

The planned pipeline infrastructure may support up to 60 bcma over time.  Wood Mackenzie estimates 125 bcma of gas demand in northern China by 2025, illustrating the growth potential through this and other pipelines.

The deal also opens up east coast Russian LNG exports.  Volumes from the Kovyktinskoye and the Chayanda field could also supply gas to Gazprom’s proposed Vladivostok LNG project.  And the pipeline also facilitates exports from other Russian producers.

But it is early days and there are large capex hurdles to be overcome before gas flow becomes a reality.  The overall cost for the Kovyktinskoye and Chayandinskoye upstream development, Power of Siberia pipeline and processing costs could exceed $40 billion according to Woodmac.

Deal price

A range of analyst views on deal pricing have been circulating over the last two weeks.  The headline reported deal price was somewhere between 350-380 $/tcm, equivalent to 9.5 to 10.4 $/MMBtu.  But some analysts are estimating slightly higher contract prices by the time the gas flows in 2019 (up to around 11 $/MMBtu).  The deal is oil-indexed and full pricing details have not been revealed, so all estimates are subject to uncertainty.   There are also other factors in play that impact deal value e.g. the Russian vs Chinese share of pipe capex and upstream development costs.

But what is important is that the deal price, at somewhere around 10 $/MMBtu, is comparable to current German border prices for oil-indexed Russian contracts (after the various concessions granted to pricing formulae in recent years).  This appears to be marginally cheaper than estimates of Turkmen gas at the Chinese border (11.00-11.50 $/MMBtu).  And importantly, it is well south of recently signed Asian LNG contracts which are closer to 16 $/MMBTu at current oil prices.

The politics

Russia looks to have accepted price concessions to get the deal done at a time when Europe & the US are expressing concerns around security of supply from dependence on Russian energy exports.  It is no coincidence that the deal has been struck in the midst of the political jousting around Ukrainian sovereignty.

But the Russians have exaggerated the level of competition for Russian gas.   Gazprom CEO Alexei recently has stated that “Europe has lost the competition global for LNG, and in a single day it has just lost the competition for the world’s pipeline gas as well”.  Talk like this makes impressive headlines back in Russia, but Russian exports are not a question of ‘either/or’ to Europe vs China.  The gas for the Chinese deal is currently ‘stranded’ in east Siberia with no infrastructure linking it to the West Siberian producing province (which supplies Europe and which has some 100 bcma of excess production capacity).  If there was really such a squeeze on Russian gas, China would not have been able to beat the deal price down to the extent that it has managed.

The deal is important to China but Russia is only one of a diversified mix of supply sources for the Chinese including:

  • Domestic production – China has a substantial unconventional gas resources with the government targeting 80 bcma of shale gas production by 2020 (although realistically by 2020 production will likely fall well short of this).
  • Turkmenistan, Uzbekistan & Kazakhstan pipeline gas – China is currently importing around 20 bcma a number that could triple by the start of next decade, and with potential to increase further if pipeline capacity can be expanded, given Turkmenistan’s massive reserves.
  • LNG – China imported about 25 bcm in 2013 but is rapidly developing more regas capacity and is an investor in a number of upstream and liquefaction projects, both under construction and planned (e.g. in Australia, East Africa and Canada).

Nevertheless, it is reasonable to expect that the pricing of Russian pipeline gas may take on a very important role in influencing pricing in the evolving Asian gas market.

The importance of pricing

The new Russia-China deal at around 10 $/MMBtu (given current oil pricing) suggests Russia is at least initially willing to sell gas at the Chinese border at a similar price level to that of its European supply contracts.  But the deal also facilitates development of Russian East coast LNG sales.  For Russia this deal is a strategic enabler which allows them to:

  • Increase future pipeline supply from East Siberian fields to China, at (what Russia hopes would be) higher price levels
  • Export LNG to other Asian buyers via east coast terminals on ‘traditional’ oil indexed terms
  • Potentially pave the way for the previously tabled Altai pipeline route to transport West Siberian gas into North West China – thus eventually monetising the 100 bcma or so of ‘surplus’ Russian production capacity

The recent Russia-China pipeline deal (which took 10 years to come to fruition) has clearly improved Russia’s current strategic positioning vis a vis the Asian market.  However future developments in the wider supply arena and China’s future strategic positioning may frustrate some of Russia’s aims in this regard.

Firstly, the monetisation of 38 bcma of otherwise ‘stranded’ East Siberian gas represents a reduction in Asian LNG demand of 38 bcma of LNG (all other things being equal) and hence this volume will be available to challenge Russia’s pipeline gas market share in Europe.

Secondly, a mild European and Asian winter has seen European hub prices and Asian spot LNG fall sharply.  And despite the outlook of a slow restart of Japanese nuclear plants, new supply is on the way with the PNG LNG project soon to start up and the first of many new Australian LNG projects coming onstream next year.  As a result, sentiment is moving towards the ‘oversupply’ scenario that we set out in a recent article.

The Third factor is the degree of future success China has in creating supply options and competition, despite the likely continued rapid growth of its natural gas demand.  In addition to further Russian pipeline supplies (from East and West Siberia) these include upside in Central Asian pipeline imports, shale gas development if successful, LNG projects with Chinese interests and future spot and contracted LNG supplies.

While Russia may be hoping that the pricing of volumes of Russian pipeline gas into China may become an important new Asian price benchmark, it is not clear that this suits China’s future requirements.  China’s aims might be better served by maximising its own domestic production and creating competition between different pipeline gas supplies and LNG imports.  It is quite possible that at some point in the next 5 to 10 years, China declares that all imports into the country be priced on a netback basis from its Shanghai hub, regardless of the aspirations of suppliers.  Such a move is more likely to succeed in a well-supplied LNG market.  The recent Russia – China 38 bcma pipeline deal ironically makes such an eventuality more achievable.

This week’s article included input from Howard Rogers, a Senior Advisor with Timera Energy and Director of Natural Gas Research at the Oxford Institute for Energy Studies.

Centrica asset sales & the current market environment

Earlier this month Centrica announced a major shift in its generation portfolio strategy.  Centrica intends to sell all of its larger CCGT assets and re-focus on smaller peaking plant.  A strategic shift of this scale from a well respected management team will no doubt fuel boardroom discussions across other European utilities.  Weak CCGT returns are source of widespread pain.

Centrica has justified the move based on the declining benefit of CCGTs as a hedge in its vertically integrated portfolio.  Management has made no secret of the fact that it is structurally bullish gas prices.  This is reflected in its major upstream investment program, where it presumably intends to re-invest some of the capital released from CCGT sales.  Like many other utilities, Centrica is also pessimistic about the future recovery of gas plant margins.  So the announcement of a downsizing of its exposure to gas plant is not a major surprise.

However the timing of the CCGT sales is interesting, given what are currently very depressed forward market conditions after a mild and windy winter.  In this article we take a look at Centrica’s asset sales and the forward market dynamics that will have an important impact on what prospective buyers may pay for the assets.

Centrica sale background

Centrica intends to sell 2.7GW of larger CCGT assets, the Langage, Humber and Killinghome plants with a combined book value £500m.  It intends to re-focus on its smaller gas plants which are currently running in OCGT mode under STOR (Short Term Operating Reserve) contracts with National Grid.

However investment in these smaller assets is likely to be predicated on receiving adequate remuneration from the new Capacity Market (e.g. to cover plant refurbishment/upgrades).  Otherwise Centrica has indicated that it will close these plants.  The Centrica gas plant portfolio is summarised in Chart 1 below.

Chart 1: Centrica gas-fired generation assets

centrica plant

Centrica’s strategic shift from CCGT to OCGT plants reflects the changing structure of the UK power market with the introduction of capacity payments.  A shift towards remuneration for capacity vs energy favours smaller scale peaking assets as we described in an article back in April.

CCGT margins may currently be very weak, but the 3 CCGT’s for sale represent an interesting mini generation portfolio with diversification across plant age, efficiency and cost structure.  Value is focused on the newer Langage plant (commissioned in 2010).  The other two plants are lower efficiency ‘dash for gas’ CCGTs from the 1990s, but assets which may offer interesting investment and Capacity Market options.

Given the current weak spread environment and negative sentiment around gas plant, Centrica’s CCGT capacity is likely to price cheaply.  What is unclear is whether Centrica will be willing to sell at these prices.

Current forward market environment

Summer NBP gas prices have fallen by almost 30% (20 p/th) since the start of this year.  We set out the drivers behind this price slump last week.  While this fall in gas costs has slightly improved CCGT margins over the coming summer, this has been outweighed by a significant decline in forward power prices across the curve.  The decline has been particularly pronounced in winter peak prices, in part reflecting the impact on expectations of the mild and windy winter that the UK has just experienced.

Chart 2 shows a comparison of current forward sparkspreads vs those three months ago in February (at a market average 49.5% gas plant efficiency).

Chart 2: UK forward indicative Clean Spark Spreads (Feb vs May)

fwd spreads

A comparison of these charts shows that the gas price fall has done little to help CCGT owners.  In fact indicative pricing further out on the curve (2017-18) shows spreads contracting significantly.  We are wary of reading too much into these later year spreads given that liquidity is currently very poor.  But it appears that any forward market expectations of CCGTs starting to displace coal in 2017-18 have disappeared with the government’s March budget announcement of a freeze in carbon price support.

Although the fall in gas prices has improved CCGT competitiveness vs coal plant, a clear gap remains.  Newer CCGTs (52% efficiency HHV) are still about 3 £/MWh more expensive on a Short Run Marginal Cost (SRMC) basis than large older coal stations (36% efficiency) over the coming summer, as shown in Chart 3.  That gap is equivalent to gas prices falling another 5p/th, coal prices rising 13 $/t or carbon rising 7 €/t.  The CCGT vs coal plant SRMC gap blows out to around 8 £/MWh over the winter given higher seasonal gas prices.

 Chart 3: CCGT (52%) vs coal plant (36%) SRMC competitiveness (June 14)

gas vs coal

With peak power prices and forward spark spreads weakening and a clear competitive advantage to coal plant, this is a tough environment in which to sell CCGT assets.

But… the Centrica assets may still make a smart acquisition  

CCGT asset valuation has traditionally been focused around forecasting sparkspread margins.  This is at best a risky exercise, given changing power market dynamics such as low carbon support, intermittency and capacity payments.  And history has not smiled on bets based on bullish sparkspread forecasts.

But the value drivers for UK CCGT assets are evolving.  Asset margin is now better deconstructed across three categories:

  1. Capacity margin (payments under the new Capacity Market)
  2. Energy margin (sparkspread margin in the wholesale energy market)
  3. Reserve margin (Balancing Mechanism and ancillaries revenue)

Getting comfortable with bounds on capacity pricing is of key importance to valuing CCGT assets, particularly older assets.  If the Capacity Market is to prevent a security of supply crunch it will need to support older CCGTs to remain on the system by remunerating plant fixed costs.  When new incremental capacity is required, capacity market returns may rise significantly above fixed costs.  Capacity payments do not start until 2018, but payments represent a step change in CCGT margins and there will be visibility on capacity pricing when auctions commence later this year.

CCGT energy margin exposure has also evolved with falling spark spreads.  A CCGT asset is best characterised as a strip of options on the underlying spark spread.  Plant fixed costs represent the cost of carry on these options.  Under current market conditions, the return on these options is below the cost of carry for many assets (i.e. plants are making cash losses).  But if the capacity market supports CCGT fixed costs then plant value dynamics change.  What is important in valuing assets is capturing a realistic view of the flexibility (or extrinsic) value that can be monetised from plant optionality, both in the energy market and the Balancing Mechanism.  This is a very different exercise from forecasting sparkspread scenarios (more details on CCGT extrinsic value here).

Reserve margin has traditionally been icing on the cake.  But it will play an increasingly important role in determining asset values as the UK market evolves.  Ofgem’s reform of the Balancing Mechanism is set to drive much sharper price signals for flexible plant and Grid’s reserve payment budget will only rise over time with increased system intermittency.

In our view, the investment case for UK CCGT assets is not materially impacted by the recent weakness in forward market spreads.  There is still a solid investment case that can be built around a recovery in UK CCGT asset values over a 5 year horizon. But this depends on getting the right asset(s) at the right price and defining an effective asset monetisation strategy.  Centrica’s willingness to part with its CCGT assets at low prices is not yet clear.  But these assets sales may represent an attractive acquisition in what is currently a very depressed forward market.