Note: Several hours after this article was published DECC announced that they had revised the 1st auction capacity target down. The article has now been updated to reflect this new information.
It is now 7 weeks and counting until the first UK Capacity Market auction. The introduction of a Capacity Market represents the largest structural change to UK power market design since the NETA market replaced the pool in 2001. Large sums of money are involved. Capacity payments to generators are expected to be in the order of £1.5-2.5 billion in the first auction alone. And the outcome of the auction will almost certainly result in the development of new power plants and the closure of existing assets. It will also reshape pricing dynamics in the wholesale energy market. So what can we expect?
One of the challenges in analysing the Capacity Market (CM) has been the level of uncertainty behind a number of key market drivers. It doesn’t matter how good your telescope is if it’s misty. However the situation improved substantially about a week ago when the final list of pre-qualified plants for the 1st auction was published. This provided a clear read on participating plants & players, de-rated capacity volumes and plant status (e.g. existing, refurb or new build), as well as a view on which plants have chosen to opt out of the market.
There is still considerable uncertainty around several CM drivers, the most important of which is individual player expectations of the evolution of future plant energy margins. But the information available now is about as good as it is going to get before the auction. And there is plenty to work with in order to draw some powerful commercial conclusions.
Pre-qualification – what have we learned?
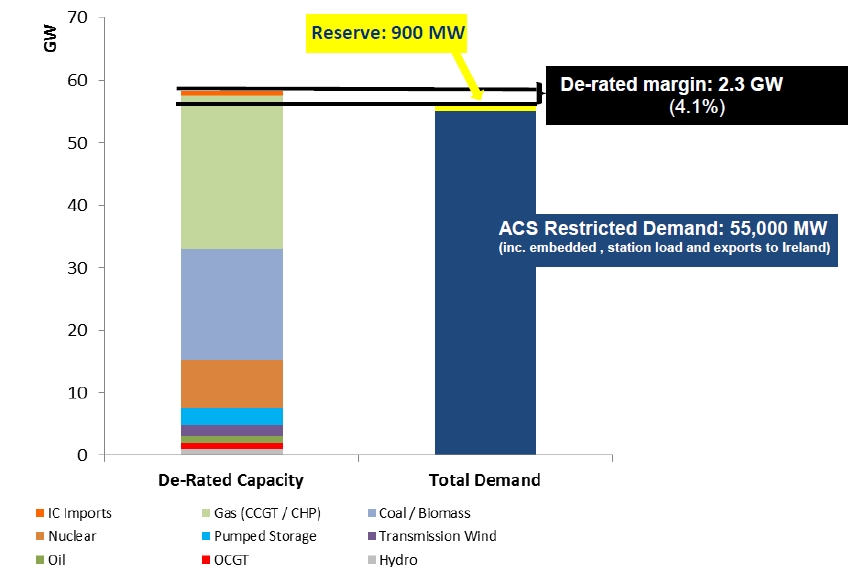
Publication of pre-qualification data has laid bare details of the 80 or so market participants and their assets which will compete to provide the government’s target level of 48.6GW of de-rated capacity for delivery in 2018/19. A summary of prequalified capacity supply versus demand curve ranges is shown in Chart 1.
Chart 1: Final pre-qualified capacity for 1st auction (MW)
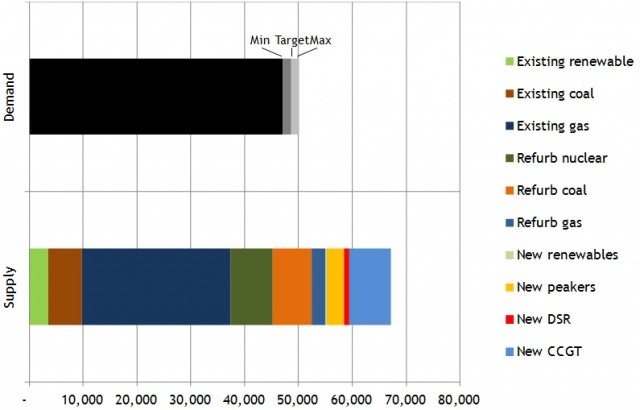
Source: Timera Energy
Some of the more important facts on pre-qualification are as follows:
- Just over 67GW of de-rated capacity prequalified, leading to the obvious initial conclusion that upwards of 15GW of capacity is likely to miss out in the 1st auction.
- Scotland’s largest power station, the Longannet coal plant (~2GW), has opted out of the CM leaving the option open for Scottish Power to close the plant prior to 2019. Plant economics are being eroded by increasingly unfavourable transmission charges given its northerly location.
- A number of other existing coal plants (Cottam, West Burton, Eggborough and Ratcliffe) have prequalified on the basis of 3 year refurbishment options, to cover plant efficiency upgrades and ensure IED emissions compliance.
- EDF Energy has chosen to submit all its existing nuclear assets for refurbishment, although it is not exactly clear how this refurbishment will enhance the UK’s capacity position. This has been somewhat of a surprise and has the potential to become quite politically sensitive (given existing concerns around support for EDF via the Hinkley Point CfD and the Carbon Price Floor).
- A wide range of smaller scale peaker plants (e.g. diesel gen sets, reciprocating engines, small scale gas turbines) have prequalified on 15 year terms. Although this provides an interesting dynamic, the overall volume is still small relative to conventional thermal power assets. Only slightly over 3GW of new build peakers are participating. There is also slightly less than 1GW of Demand Side Response (DSR), presumably mostly in the form of new back up peaking generators.
- 7.8GW of new CCGT has also pre-qualified on 15 year terms across 9 participants (SSE, ESB, Centrica, Scottish Power, Intergen and several other specialist developers). It however remains to be seen how much of this will be competitive enough on a cost basis to displace other capacity.
It is also important to note that the government revised down its 1st auction capacity target level to 48.6GW (initially set at 50.8GW) on 27th October, to account for opt out decisions (e.g. Longannet).
Analysing the auction outcome
Analysis of CM dynamics has been a key area of focus for Timera Energy across 2014. As a result we have developed a strong capability to model pricing interaction between the UK capacity and energy markets. To keep this article focused we do not provide a detailed description of our modelling methodology. However there are two principles behind our analytical approach that is important to set out upfront.
The first principle is that what looks like a complex mess of different plants, players, costs and expectations can be substantially simplified by focusing on the plants and cost structures that are likely to drive marginal pricing. In other words by working out which subset of plants are likely to drive the intersection between supply and demand.
The second important principle behind our modelling is having a healthy respect for uncertainty. There are a couple of important and interrelated CM drivers that will influence the auction outcome, yet remain uncertain up until the auction day:
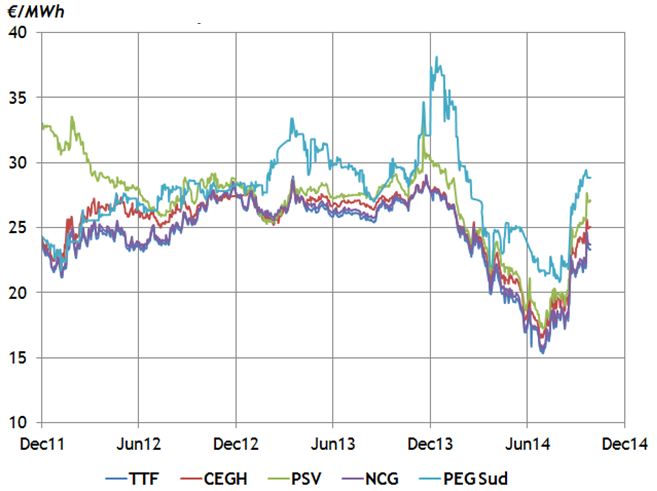
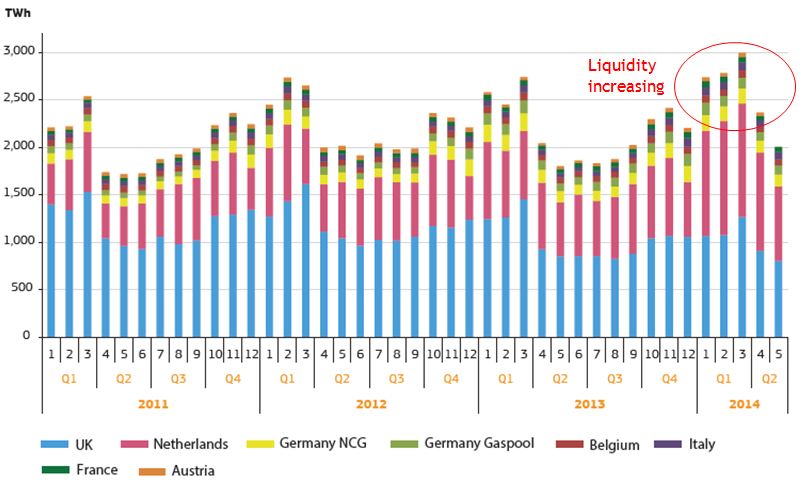
- Energy margin expectations: The margin required to support existing and new power plants can be broken into three categories: (i) capacity (ii) energy and (iii) reserve margin. Plant bidding levels (determining capacity margin) in the auction are directly influenced by player expectations on the evolution of energy and reserve margin over the period to 2018/19 and beyond. With poor forward market liquidity past 2016, there is there is scant quantified market price signal on forward energy margin, and expectations on this for the future may differ significantly. Uncertainty around these expectations is a reality that has to be recognised and confronted when analysing CM auction dynamics.
- Going forward losses: Some existing plants (e.g. older coal and CCGT assets) will suffer losses from weak generation margins in advance of delivering capacity in 2018/19. Players can recover for these losses by applying for price maker status (shortly prior to the auction). This allows them to bid above the price taker threshold for existing assets (25 £/kW), in order to attempt to recover for losses incurred by remaining open. Loss levels in turn come back to energy margin expectations. We can do some sensible analysis of the impact of losses on capacity bidding, but ultimately a significant degree of expectation based uncertainty remains.
In our view, trying to forecast these factors at an individual plant/player level tends to give credence to a spurious level of detail in CM analysis. We prefer to recognise the uncertainty involved around these factors and try and analyse how it may impact the auction outcome.
1st auction supply stack
In order to analyse CM dynamics it is necessary to construct a representation of the supply stack. The supply stack is driven by the costs of providing capacity in 2018/19, with the CM being designed such that players have quite strong incentives to bid plants at true cost.
The task of developing the supply curve is helped by the fact that good cost benchmarks are available by plant type. The important benchmarks are the fixed costs of existing plants, the upgrade capex required for refurbishment plants and the capex costs for new build. The more difficult task is netting off energy margin expectations to derive capacity bids (as described above). As a result, energy margin expectations become a key focus variable for running scenarios.
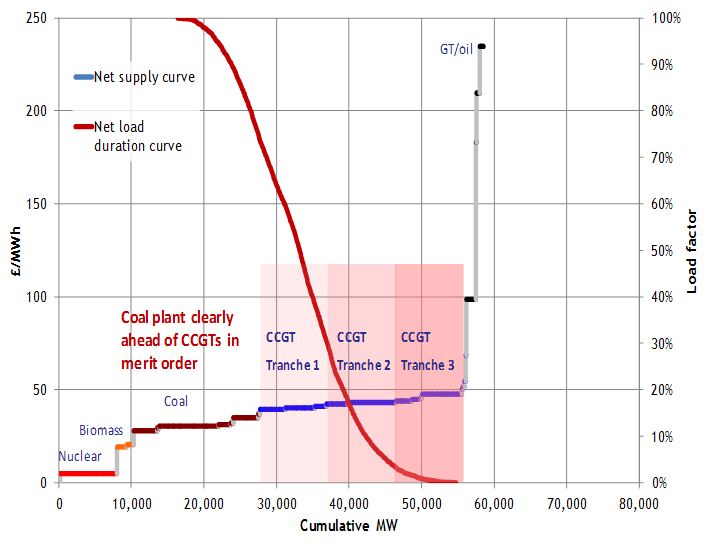
Chart 2 shows a stylised scenario view of the 1st auction capacity supply stack with the demand curve overlaid. We have constructed this chart to provide a simplified representation of some of the CM pricing dynamics (described below). As such it is illustrative and should not be interpreted as a forecast of the auction outcome.
Chart 2: Stylised scenario view of 1st auction supply stack
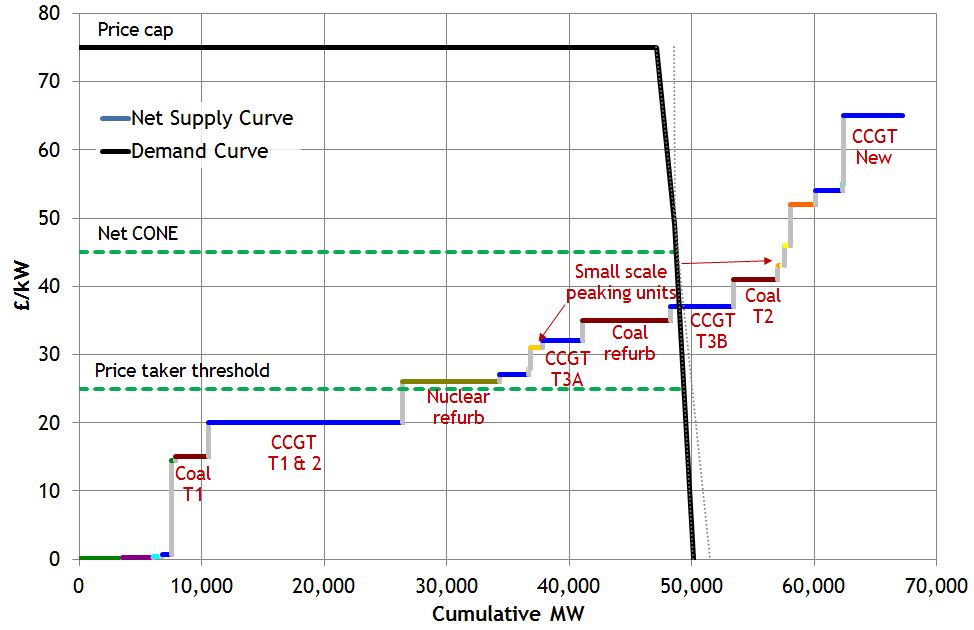
Source: Timera Energy
For the purposes of this chart, we have set up our CM model in ‘aggregated’ plant mode showing the supply curve grouped into tranches of capacity types based on cost of provision. Several of the key capacity categories around the margin are labelled. In practice we undertake detailed analysis at a more granular level, but it is easier to visualise the CM and draw high level conclusions at an aggregated level.
Some background in order to understand what the chart is showing:
- The demand curve (black line) reflects the new 48.6GW auction target level. It is downward sloping from a min volume of 47.1GW (at the 75 £/kW price cap) to a max volume of 50.1GW (at zero capacity price).
- The inflection point of the demand curve is at the government’s 49 £/kW estimate of net new entry cost (net CONE).
- The chart also shows the price taker threshold at 25 £/kW which caps the level at which existing plants can bid in the absence of going through the process of applying for price maker status (to recover going forward losses).
- With our supply stack model set in ‘aggregated’ mode, plants are grouped into 25 basic categories for which bids are defined based on cost and energy market expectations. These categories are shown for the illustrative scenario by different coloured sections of the supply stack.
- Some capacity types are made up of multiple tranches, e.g. existing CCGTs are split into 3 tranches (T 1-3) as we have explained previously here, with the oldest assets (T3) split into two subcategories to differentiate between the impact of going forward losses on capacity bids.
Marginal pricing setting
As we described above, analysing the CM becomes easier if you focus in on the range of the supply stack where the marginal price is likely to be set. A good case can be made for a lower price bound around the fixed costs of older CCGT plants (~20 £/kW). There is 6-8GW of CCGT built in the early/mid 1990’s that is currently making close to zero margins in the wholesale energy market. This capacity (and several GW of older coal capacity) will be very likely to close at a capacity price below that level. There also looks to be a reasonable supply of new build gas and peaking plants above 50 £/kW that is likely to act as an upper bound in the first auction. It is the range in between these two bounds where the 1st auction is likely to be fought out.
The supply stack representation in Chart 2 illustrates three key categories of plants that are likely to be competing to drive marginal pricing within this range:
- Older coal plants: 7GW of less efficient existing coal plant are bidding for 3 year refurb contracts to comply with IED requirements. In addition there are several more GW of other older existing coal stations that will likely apply for price maker status to recover going forward losses (with a view to closing by 2023 given IED constraints).
- Older CCGTs: Many of the 6-8 GW of older, less efficient CCGT that are currently making very little energy margin are also likely to apply for price maker status to recover going forward costs. The interaction between the bidding of these CCGTs and existing coal plant is likely to be a key factor driving the auction outcome.
- New small scale peakers: Low capex small scale peaking plants under advantageous 15 year capacity agreements (supporting attractive leverage structures) are likely to be the most competitive form of new build. Given the number of different players and technologies, some of these plants should feature around the margin. But relatively low volumes mean that they are less important than the two categories above.
Our conclusions from previous articles we have published on the CM were that (i) refurb and going forward costs will be key drivers of the 1st auction outcome and (ii) low capex small scale peakers will be competitive given leverage opportunities under 15 year agreements. Our analysis since release of the prequalification data only reinforces these initial conclusions.
A noteable exclusion from the list of key marginal price setting plants is the 7.8 GW of new CCGT capacity that is participating in the 1st auction. We assume ESB’s Carrington CCGT will be built regardless given it is already under construction. But the developers of other new CCGT projects face a key challenge in putting a price on energy margin from which to imply a CM bid. The source of this energy margin pricing falls into two main categories. Projects will either need to sign a third party market tolling agreement (e.g. IPP developers) or internalise the energy margin risk in their portfolio (e.g. utility developers). Both categories are likely to face the issue of heavily discounted energy margin as a result of the pain being caused by current weakness in sparkspreads. As a result it will take a very cost competitive new CCGT project to compete with existing assets and smaller peakers.
The first vs subsequent auctions
After focusing in on marginal price drivers, it is useful to take a step back and consider the 1st auction from a more strategic perspective. There are strong market design incentives to bid plant in a cost reflective manner. But first auction bidding behaviour will also be influenced by expectations of future auction outcomes.
If a plant bidding for a 3 year refurb or 15 year new build contract is unsuccessful, it has the option to try again next year. But the 1st auction looks attractive given greater competition next year (e.g. from interconnectors) and expectations that the government may introduce less favourable rules around longer term capacity agreements (e.g. via a price duration curve mechanism). This is likely to incentivise a more aggressive bidding stance in the first auction, particularly for new build plant chasing favourable 15 year terms.
For a number of existing gas and coal plants this year’s auction is likely to pose an existential challenge. Plant losses mean that assets need to bid as price makers to recover going forward costs. Yet owners run the risk of missing out in the auction if bids are high, necessitating plant closure. Ultimately first auction bidding strategy is linked to the complex assessment of plant abandonment economics. This may skew plant owners to take a more aggressive stance on assumptions such as energy margin recovery expectations (e.g. 2015-18 as the market tightens) to support lower bid levels. This effect and the new build one described above may result in downward pressure on the 1st auction capacity price.
Market pricing dynamics
Ultimately it is existing power plants that are going to be the main drivers of the first auction outcome. This is the logical result of an auction target level that does not require the delivery of incremental capacity volumes. The government’s target level relies heavily on DECC/Grid’s assumptions of peak demand reduction between now and 2018. If these turn out to be optimistic then it will mean substantial ‘top up’ buying of capacity or DSR in the year ahead auction. This is likely to favour developers of small scale peaking assets (with low capex and short lead times). It may also support contracting of supplementary reserve in the meantime.
There are 10-12GW of existing older coal and gas plants that currently have weak economics given low spark and dark spreads. Some of these plants will miss out in the 1st auction and subsequently close. This will have an important knock-on impact for pricing and volatility in a tightening energy market over the next three years.
This is particularly the case if low capex but high variable cost small scale peakers are successful in displacing significant volumes of existing gas/coal plant. That would act to support power price and volatility levels (and hence plant energy margins). Small scale peakers may be cheap on a capex basis but they are very expensive on a variable cost basis and hence will have a limited impact in dampening power prices relative to larger conventional plants.
It is this interaction between capacity and wholesale energy pricing dynamics that is going to be critical going forward. The capacity market will determine the level and type of system capacity. This will then drive price shape, scarcity rents and volatility in the energy market. As a result, the first capacity auction marks the start of a transformational change in the UK power market and the dynamics of generation investment returns.
Full commercial analysis of the 1st auction: For a more comprehensive analysis of the 1st auction and its commercial implications you can purchase Timera Energy’s First Auction in Focus briefing report.
The report provides a more detailed analysis of competition between plant types and the marginal pricing outcome in the first auction. Analysis covers the impact of energy market expectations, going forward losses, price maker/taker status, refurb option dynamics and new build competitiveness. The report also explores the key interaction between capacity and wholesale energy market pricing dynamics. It concludes with a set of key commercial considerations on market dynamics going into the first auction.