A revival in contracting of flexible assets

Long term contracts are a cornerstone of the energy industry. They play a key role in underpinning the capital expenditure required to develop assets. They also play an important role in ensuring security of supply.

There is a long history of contracting gas and power assets in Europe. The role of long term contracts has evolved with market conditions, availability of capital and changes in industry business models. This is particularly true for the contracting of flexible assets such as thermal power plants, interconnectors, pipelines and gas storage facilities, which typically involve the management of significant market risk exposures.

Long term contracts played a pivotal role in facilitating the development and acquisition of flexible assets through the early stages of European gas and power market liberalisation in the 1990s. The landscape then changed in the post Enron bust period of the early 2000s. A strong push for scale and vertical integration saw European utilities internalise flexible asset exposures within their portfolios. This has led to somewhat of a decline in the role and availability of long term contracts over the last decade.

But three factors are currently driving a resurgence in the contracting of flexible assets in Europe:

  1. Balance sheet weakness is increasing pressure on utilities & producers to divest flexible gas and power assets (E.ON and Vattenfall being two prominent recent examples).
  2. Cash rich infrastructure and private equity funds are looking to acquire these assets, but to outsource the majority of market risk via long term contracts in order to protect equity and avoid the overheads associated with setting up internal trading capabilities.
  3. More willing lenders are offering attractive financing terms given low interest rates and a hunt for yield, but are seeking long term contract protection to ensure adequate cashflow stability.

As a result of these factors we have seen a surge in activity to structure & value long term contracts on flexible assets over the last 12-18 months. Available contract terms are asset specific, depending on factors such as the level of intrinsic margin and underlying market conditions.  But there are some key practical principles that apply more generally for the contracting flexible assets.  Today’s article is the first in a series of articles that sets out these principles, using case study examples to illustrate how they work in practice.


Asset contracting is a risk/return decision

Any sensible consideration of long term contracting revolves around a risk/return decision. This means the risk appetite of the asset owner is usually the starting point for defining an appropriate contracting structure. Contract impact on asset risk is driven by three main attributes:

  • Volume: the portion of an asset margin that are covered via contract
  • Duration: the time horizon over which margin is contracted
  • Price: the contract pricing terms in relation to the asset’s underlying market exposures e.g. fixed, collared, indexed

These terms can vary considerably across contracts. But a set of principles on risk/return apply across all contract structures.

Consider the development of a new UK CCGT plant as an illustrative case study. Let’s assume the majority of capacity of the CCGT is contracted via a fixed price (annual capacity fee based) tolling contract. Chart 1 shows a simplified diagram of the impact of the contract on annual asset gross margins.

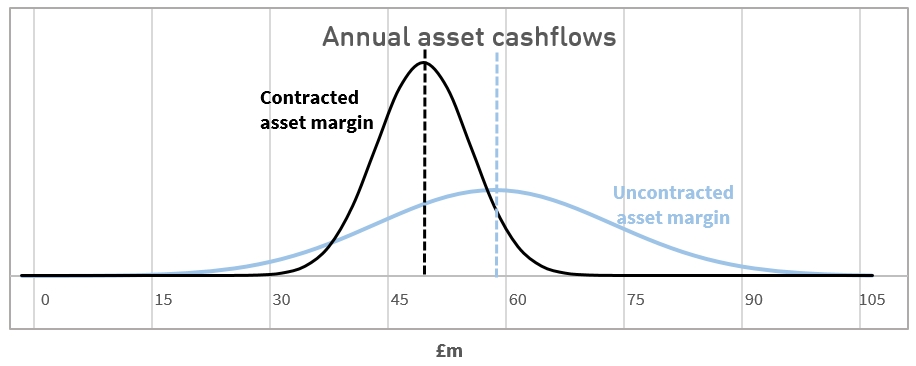
Chart 1: Contracted vs uncontracted asset margin distributions (UK CCGT example)
chart 1

Source: Timera Energy

The blue line shows the frequency distribution of uncontracted (or merchant) asset gross margins. This distribution is relatively wide given the asset is fully exposed to market risk (i.e. to the market sparkspread). The black line shows the distribution of asset margins with the tolling contract in place. It should be noted that the distributions in the diagram are illustrative.  In reality these will be driven by the relationship between a specific set of contract terms and underlying market price distributions.

The difference between the uncontracted and contracted distributions illustrates the main principles of asset contracting:

  1. Risk: Contracting reduces the variance of the distribution of asset margins, restricting downside but also limiting upside. In other words it reduces the owner’s risk of margin outcomes deviating from expected levels. For the CCGT asset example, the tolling contract acts to lock in a fixed capacity fee on a portion of asset flexibility value, reducing exposure to the market sparkspread.
  2. Return: There is no free lunch. Contracting also acts to reduce the expected level of annual asset margins. This is because the counterparty on the other side of the contract is forced to take on market risk and needs to be appropriately compensated to do so. In other words the counterparty applies a haircut (or discount) to expected margin levels.  Quantification of this contract haircut is driven by factors such as market volatility, asset ‘in the moneyness’ and contract duration, which determine the risk capital required by the counterparty to support the contract.

There are many other considerations involved in successfully executing a long term contract. But understanding the risk/return impact of contracting is an important place to start. This is not a qualitative exercise, it requires numbers.

In other words it relies on the practical quantification of the impact of contracting on asset risk/return distributions. A failure to realistically quantify contracted project economics in advance of securing a capacity agreement has been one of the major road blocks that has stalled the Trafford CCGT development project in the UK.


Contracting to protect equity and debt

Equity investors in flexible gas and power assets can face a tough challenge in defining and securing appropriate volume, duration and pricing terms. The level of intrinsic margin or ‘in the moneyness’ of an asset is an important factor determining whether contracting makes sense. It is also a key factor determining lender willingness to provide debt.

This can be illustrated by looking at some examples of assets with different margin structures:

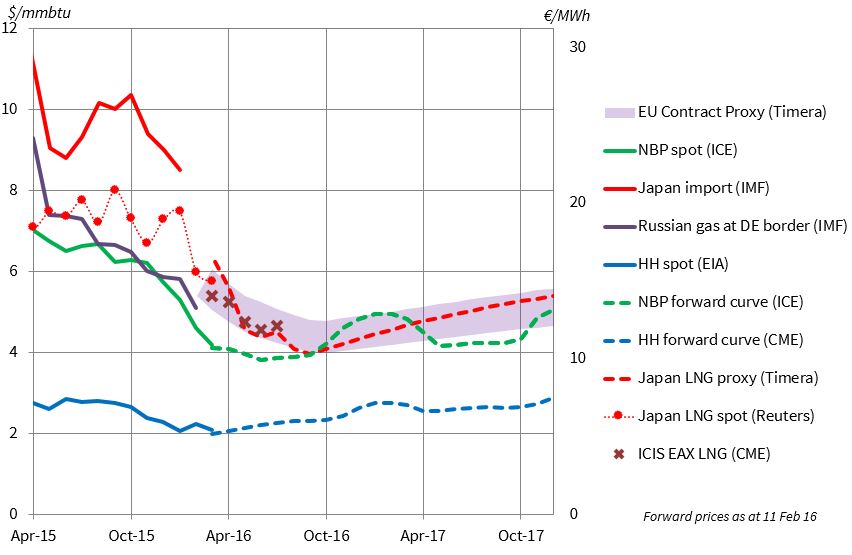
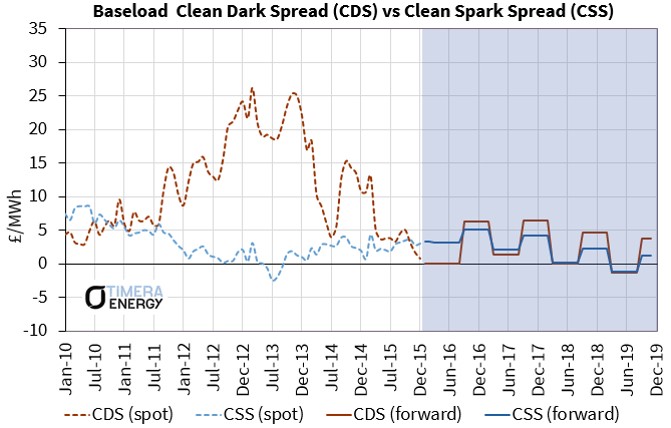
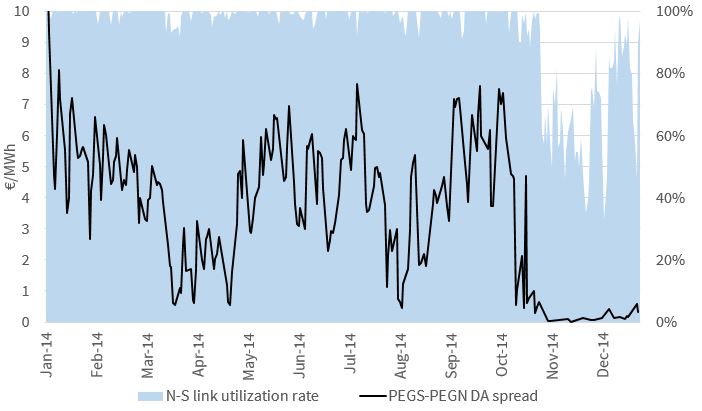
  • Deep in the money: The interconnector assets that are being developed between Continental and the UK power markets benefit from high structural intrinsic margins. Forward power prices in the UK are currently at more than a 15 €/MWh premium to France and Belgium. Margin stability associated with the ‘in the moneyness’ of interconnector optionality acts to reduce long term contract price haircuts. It also means a greater portion of asset cashflow can be contracted to protect equity returns and secure debt.
  • Less in the money: A broad range of flexible European assets currently have some structural margin, but at levels that make contracting a challenge. These include gas pipeline, gas storage and some thermal power assets (e.g. UK CCGTs). The defining factor for a successful contracting strategy is ensuring that the associated reduction in risk adequately compensates for the reduction in asset return. This can be very difficult when contract buyers, typically energy trading desks, heftily discount contract prices to reflect the risks associated with a lack of intrinsic margin.
  • At or out of the money: If an asset has little or no intrinsic margin (e.g. thermal power assets in Continental Europe) then contracting typically makes no sense. This is because the return on these assets is driven by extrinsic value associated with market volatility or structural market recovery. Realising this value usually means adopting a merchant strategy rather than locking in weak returns via a long term contract.

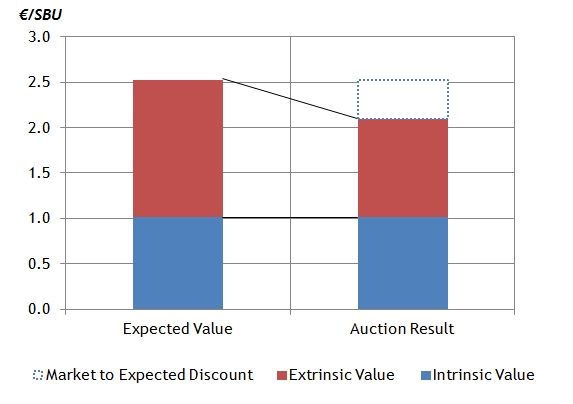
Chart 2 illustrates some of the issues involved by returning to the UK CCGT tolling example. Expected asset return is the difference between expected gross margin (at the centre of the margin distribution) and the costs associated with plant opex and any debt servicing (shown via the grey and red bars respectively).

Chart 2: Structure of contracted asset return (UK CCGT example)
chart 2

Source: Timera Energy

The merchant or uncontracted margin distribution (in blue) shows a significant risk of margin falling short of plant opex and debt service costs (i.e. distribution downside exposes debt/opex levels). Contracting acts to:

  1. Reduce downside risk shifting the tail of the cashflow distribution to the right and reducing the probability that margin falls short of debt service and opex costs.
  2. Reduce expected return moving the expected plant margin down from the blue dashed line (uncontracted) to the black dotted line (contracted) and reducing the level of asset return above costs.

Defining a contract structure that balances these requirements becomes more difficult the lower the intrinsic margin or ‘in the moneyness’ of the asset. This in a nutshell is the challenge facing European investors looking at flexible gas and power assets.

An investment and contracting case needs to be built around providing adequate downside protection for equity and any debt. But at the same time ensuring that an adequate expected return on equity can be maintained. This challenge is not an easy one to overcome given the decline in intrinsic margin of many assets. But it is driving the innovative evolution of both contracting and financing structures, a topic we will return to in our next article in this series.

The blog will take a one week break for Easter but we will be back on April 4th.

Article written by David Stokes & Olly Spinks

Fixing the UK’s broken capacity market?

What do you do if you design a capacity market that doesn’t work? Try, try again. The imminent threat of large volumes of coal plant closures has sent DECC rushing back to the drawing board.

This month a raft of proposed revisions to the UK capacity market have been announced for consultation. It is DECCs intention to implement these changes by the summer, in time for the start of the 2016 capacity auction process.

DECC is now fighting a security of supply battle on two fronts:

  1. Closure prevention: To ensure enough existing capacity remains on the system during the capacity crunch over the remainder of this decade
  2. New build: To incentivise the delivery of large scale new capacity into next decade to replace closing thermal plant

This was reflected in the UK energy secretary’s accompanying statements:

“By buying more capacity earlier we will protect consumers and businesses from avoidable spikes in energy costs”

“We’re also sending a clear signal to investors that will encourage the secure and clean energy sources we need to come forward, such as gas and interconnectors”

The first statement would have made more sense three years ago when DECC first implemented the capacity market. The second statement reflects DECC’s barely disguised preference for CCGTs and interconnectors as a new build solution.

DECC’s proposed revisions to the Capacity Market reflect its security of supply concerns. These are focused around two main measures:

  1. Early implementation: Pulling forward the capacity market a year via a new capacity auction to be held in Jan 2017 in order to remunerate plants in 2017-18
  2. Buying more capacity: Increasing the capacity target level in this year’s T-4 auction, to increase capacity in the 2021-22 delivery year

In this article we look at what these measures mean for the UK power market.


Early implementation (2017-18)

DECC’s early implementation measure is all about keeping existing capacity on the system. The 15 year capacity agreements, used to incentivise new build in previous auctions, are not available in the 2017-18 auction. Given the short delivery lead time of 9 months there are only 1 year capacity agreements on offer.

This measure will in effect replace the much criticised Supplemental Balancing Reserve (SBR) mechanism that is currently being used to maintain UK security of supply. The removal of SBR is long overdue given it has become increasingly unpopular and unruly over the last two years.

Plant closure announcements have forced National Grid (the TSO) to buy more and more ‘emergency reserve’ capacity to protect security of supply. Table 1 provides a summary of the 3.5 GW of SBR capacity Grid have purchased for Winter 2016-17.

Table 1: Winter 2016-17 SBR plants and volumes contracted by National Grid

SBR contracts

Source: National Grid

This table reads like a power plant endangered species list. The SBR capacity was procured for a total cost of £122m at an average price of 34 £/kW, 70% higher than capacity clearing prices in the first two T-4 auctions. Individual units were paid up to 88 £/kW for capacity.

SBR payments of this magnitude represent a glowing incentive for existing plants (particularly less efficient coal), to make closure announcements and bid for lucrative SBR contracts. This dynamic has forced DECCs hand in replacing SBR with something more consistent with the official capacity market.

While the removal of SBR is a positive step, the 2017-18 early implementation measures smell of panic. Running a capacity auction for one year agreements at such short notice will likely achieve DECC’s aim of driving up the capacity price. But it will do so at a substantial cost to the consumer.

The supply curve in the 2017-18 auction will be much steeper than normal given a reduced range of capacity options to meet the target. Existing coal plants are likely to be an important driver of clearing price. Coal plants will need capacity payments to cover station fixed costs (~40-50 £/kW), less any dark spread margins and delayed closure cost benefits, in order to remain open for the next two winters.

Say for example the 2017-18 auction clears at 35 £/kW with the government procuring 50GW of capacity (these are illustrative round numbers). This would cost the consumer £1.75bn. This is more than 14 times Grid’s cost of procuring SBR capacity for Winter 2016-17 (£122m). In other words the auction represents a huge windfall to existing plants that are going to remain open anyway.

Beyond this 2017-18 ‘one off’ auction, DECC will need to purchase incremental capacity in the T-1 auctions to ensure security of supply (given the absence of SBR). The supply curve for these auctions is likely to be steep and clearing prices higher for similar reasons to those described above i.e. limited competition to provide incremental capacity at short notice. Structurally higher T-1 capacity returns over the next 5 years is something to start factoring in to asset investment decisions. But these higher prices will only accrue to plants that do not already have contracts from the T-4 auction.


Buying more capacity (2021-22)

Leaving to one side the problem of security of supply over the next 5 winters, DECC is also rightly focusing on next decade. To give credit where it is due DECC appears to be taking a more sensible approach to the new build issue. Suggestions of introducing an entirely new set of interventions to support CCGT new build appear to have been shelved.

Instead DECC is focusing on using the existing Capacity Market but raising the capacity target level. DECC has provided guidance that 2021-22 target demand levels will be at least 3GW higher than would normally be the case. DECC’s intention in doing this is primarily to incentivise gas plant new build. But it will not necessarily result in new CCGTs being delivered.

We estimate a new CCGT project to require a minimum of 40-45 £/kW (via a 15 year contract) to proceed, given current available terms on tolling contracts and financing. The new penalties for non-delivery of capacity that DECC intends to introduce if anything act to increase the required capacity price.

Whether the clearing price in this year’s T-4 auction reaches these levels will depend on the steepness of the supply curve. But we suspect that capacity price levels between 20 and 40 £/kW will start to flush out large volumes of alternatives to CCGT capacity.

DECC will likely ensure that the use of higher emissions diesel generators is restricted via appropriate emissions legislation. It would be a mistake to do this via heavy handed fiddling with embedded generation benefits. But we suspect gas-fired peakers and an interesting range of other alternative supply sources may become apparent as capacity prices rise.

This is after all what the capacity market should be about. Competition to provide the cheapest form of incremental capacity, not a blunt instrument with which policy makers try and pick winners.

Article written by David Stokes and Olly Spinks

Rising CCGT load factors and gas volatility

The sharp decline in gas hub prices in 2016 is starting to reshape the landscape for flexible supply infrastructure in European gas and power markets.  CCGT load factors are on the rise as coal plants are being displaced from the merit order.  Spot gas price volatility is also showing early signs of recovery despite an oversupplied European gas market.

2016 may mark the start of an evolving relationship between CCGT load factors and gas price volatility.  Falling CCGT load factors have been the main driver of the slump in European gas demand this decade. So increasing gas plant competitiveness is starting to support a recovery in power sector gas demand.

In addition as gas prices fall CCGTs play a more prominent role in setting marginal power prices.  This means CCGTs provide more of the marginal flexibility required to back up short term swings in intermittent renewable output.  So swings in CCGT gas demand are in turn supportive of higher prompt gas price volatility.

In today’s article we explore whether a recovery in CCGT load factors across Europe could support a more structural recovery in gas price volatility.


The UK leading a 2016 CCGT recovery

As gas hub prices fall, CCGT load factors are increasing significantly in 2016 versus last year.  This is particularly the case in markets where gas plants play a more important role in setting marginal prices e.g. in the UK and Italy.

We like to focus on the UK power market as a barometer for gas vs coal switching in Europe.  It plays the role of ‘canary in the coal mine’ for increasing gas plant competitiveness given:

  1. The dominance of CCGT plants in setting power prices
  2. The UK carbon price floor policy that acts to disadvantage coal plants

Chart 1 provides a snapshot of gas vs coal plant competitiveness in the UK power market based on current forward curve pricing for power, gas, coal and carbon.  A few notes on the chart:

  • The chart shows different combinations of gas (vertical axis) and coal (horizontal axis) prices
  • The coloured dots show current forward curve combinations of gas and coal prices for different seasonal forward contracts from 2016-18
  • The sloping lines mark the gas vs coal switching boundaries between CCGT plants with different efficiencies (47%, 49% and 52% HHV efficiency) and coal plants (with 36% efficiency)
  • When a coloured dot sits below the gas vs coal switching boundary it means over that time horizon, CCGTs are displacing coal plant in the merit order (at current forward prices)

Chart 1: Gas vs coal switching boundaries in the UK power market

Gas Coal Switching Mar16

Source: Timera Energy

The chart shows the UK’s top tranche of newer CCGTs (@52% efficiency) displacing coal plants (@36% efficiency) to run baseload. The second tranche of CCGTs (@49% efficiency) are also displacing coal plants in summer periods.  The third tranche of CCGTs (@47% efficiency and below) are providing peaking flexibility.

Falling gas prices are pointing towards the majority of the UK CCGT fleet coming back into merit during summer 2016.  The impact of this CCGT displacement of coal plants is likely to be a materially higher UK gas demand in 2016.

The effect of lower gas prices on CCGT load factors is not isolated to the UK.  Baseload spark spreads have also been positive in Italy this winter (partly due to relatively low hydro levels), causing a step up in CCGT load factors.  Despite mild and windy weather in North-West Europe, there has also been a recovery in gas plant load factors in markets such as France, Belgium and the Netherlands (although baseload spark spreads remain in negative territory).

But gas vs coal switching is still an evolving story in Europe. Hub prices remain under heavy pressure into the coming summer.  European gas storage inventories remain at unseasonably high levels into the spring, which will reduce gas demand for storage injection over the summer. European hubs also face a ramp up in LNG imports as Asian spot prices have again slumped under 5 $/mmbtu.  These factors point to higher CCGT load factors and gas demand as the year progresses.


Why this is important for gas flexibility value

CCGT load factors form an important source of demand for gas flexibility services.  Falling CCGT load factors across the first half of this decade have been the primary cause of an almost 20% fall in European gas demand.  The decline in power sector gas demand has contributed to a slump in spot gas price volatility, the market price signal for gas supply flexibility.

A recovery in CCGT load factors across Europe should support spot gas price volatility and the value of supply flexibility.  This is particularly true for the rapid response gas deliverability required to support sharp swings in CCGT load factors (e.g. from fast cycle storage).

CCGTs are a key transmission mechanism for prompt price volatility from the power to the gas market.  As CCGTs come back into merit, gas swing demand rises to support the ramping up and down of CCGTs in response to shorter term swings in market conditions.

The role of CCGTs in providing flexibility is also set to be supported by the closure of many of Europe’s less efficient coal plants over the next five years.  Lower gas prices are rapidly eroding coal plant margins to levels below plant fixed costs.  This will be reinforced by German nuclear plant closures early next decade.

Uncertainty remains around the timing and pace of an increase in spot gas price volatility and the value of supply flexibility.  But watch for a resurgence in CCGT load factors as an indicator of the start of a structural recovery.

Article written by David Stokes, Olly Spinks & Emilio Viudez

Brent crash in animation (Part II)

The wild ride continues in the crude market. Brent plunged below 30 $/bbl earlier this month as resilient production and inventory build spooked the market. This was followed by a sharp 20% rally triggered by the optimistic concept of coordinated OPEC/Russian production cuts.

Any hope of cooperation between Saudi Arabia, Iran and Iraq fell apart last week, with crude falling 5% in a day. But prices snapped back after better than expected gasoline inventory data. The oil market is being whipped about by short term news flow.

Much of this would appear to be of little relevance to longer term prices. But the crude forward curve is also gyrating wildly with fluctuations in spot prices. The crude curve deserves more attention than it gets. For a meaningful bottom to form in the crude market, the US production investment cycle needs to be disrupted. And forward prices are a key benchmark driving the investment decisions of US shale producers.

In this article we return to an updated view of our animation of spot vs crude curve evolution for clues on the evolution of crude pricing dynamics. We also take a look at the behaviour of implied volatility levels in relation to underlying prices.


Back to the movies

We published our first animation of Brent curve evolution in Feb 2015. Chart 1 shows an updated view of the animation a year on.

Chart 1: Brent spot versus forward curve evolution (2008-16)
BRENT animation Feb16

Source: Timera Energy, ICE data

Perhaps the most striking observation from Chart 1 is the strong relationship between spot prices and the forward curve. But some other interesting dynamics can be observed by focusing in on the back end of the curve:

  • Financial crisis shock (2008-09): Although spot prices fell below 40 $/bbl, the back of the curve remained above 65 $/bbl.
  • Recovery (2009-13): The back of the curve was anchored in an 80-100 $/bbl range (driven by production LRMC benchmarks), despite spot prices moving in a much wider band.
  • Oversupply down leg 1 (2014-15): Spot prices plunged under 50 $/bbl in early 2015, but the back end of the curve remained above 75 $/bbl (again held up by production LRMC benchmarks).
  • Oversupply down leg 2 (2016- ): In 2016, the back end of the curve has fallen below 50 $/bbl, significantly lower than previous periods of low spot prices.

Oversupply remains pronounced in the short term, with a large global inventory overhang. But in 2016 the forward curve is at levels that do not support new investment in US shale. In other words forward prices are below the Long Run Marginal Cost of shale production (let alone other supply sources). This is illustrated by an ongoing decline in the US rig count. These conditions are supportive of a market bottom and price recovery, even if there may be further short term weakness in spot prices.

There are two other important factors to watch for clues on a market bottom:

  1. A weakening in the US Dollar, given the negative correlation between oil and the USD
  2. Extreme levels of implied volatility in the crude options market

Chart 2 shows the evolution of the CBOE 30 day implied volatility index (OVX) over the same 2008-16 period as Chart 1.

Chart 2: CBOE OVX crude oil volatility index

Brent Implied Vol

Source: Timera Energy, CBOE data

It can be seen from Chart 2 that major market turning points coincide with peaks in implied volatility:

  • Financial crisis low (2008): A peak in the OVX implied volatility index above 100 coincided with the post financial crisis low below 40 $/bbl in late 2008
  • Recovery top (2011): Another peak above 60 occurred in the OVX at around the time Brent spiked above 125 $/bbl in 2011.
  • Interim low (2015): The OVX again breeched 60 as Brent formed a temporary bottom below 50 $/bbl in early 2015.

The logic is fairly simple. Market trends tend to reverse during periods of extreme sentiment and uncertainty.  This is reflected by high premiums being paid for protection via the options market causing a spike in implied volatility.

Early in February, the OVX spiked towards 80 indicating another period of extreme implied volatility. This does not preclude volatility moving higher still (e.g. towards 100 as in 2008). But it does suggest that the crude market could be in the process of forming a major low.

Article written by David Stokes, Olly Spinks and Emilio Viudez

Underestimating small scale peakers

The UK government has issued fresh denials of an imminent capacity crunch this month.  This has been prompted by closure announcements for another 2.5 GW of coal plant capacity (Fiddler’s Ferry & Rugeley).  But behind the podium in the Whitehall corridors concerns continue to mount.

The closure of large volumes of coal and CCGT capacity mean that delivery of new baseload capacity is now inevitable.  CCGTs remain largely uncontested as a source of new baseload generation.  Coal is being phased out and the prospects for new nuclear are sinking under the weight of costs and delivery risk.

Any observer of UK power policy over the last decade would be familiar with the ‘when in doubt, intervene’ approach that has been the source of many of the UK’s current problems.  So it is unsurprising that policy intervention to support CCGT development sits at the top of the government’s list of potential responses.

But small scale gas-fired peakers represent an under-estimated alternative to burdening the consumer with a large scale roll out of new CCGTs.  In many ways gas peakers are a more sensible source of flexible backup for renewable capacity.  These include:

  • Relatively low capital costs (< 300 £/kW vs 550-650 £/kW for CCGT)
  • Quick and easy deployment (e.g. under 12 months in mobile containers)
  • Relatively emissions friendly given low load factor running (vs CCGT mid-merit/baseload running)
  • Location flexibility, to help reduce transmission & distribution network costs
  • Rapid response provision of ancillary & balancing services (e.g. for intermittency)

In this article we explore how gas peakers can earn a return, without needing to pass the hat around Whitehall.


Peaker investment case breakdown

The risk/return structure of a CCGT plant investment is relatively well understood (albeit a challenge in the current market).  Plant margin is driven predominantly by (i) capacity revenues and (ii) wholesale market generation margin reflecting clean spark spreads.

Small scale peakers are a different animal.  They benefit from much lower and more granular capex costs.  But the structure of revenues is less transparent and more complex.  Five key sources of revenue are summarised in Table 1 and explained below.

Table 1: 5 key sources of UK peaker revenue

Embedded Table

Source: Timera Energy

Capacity Market: The small scale peaker investment case is typically built around securing a foundation tranche of capacity revenues.  A 15 year fixed price capacity agreement supports project leverage.  It provides lenders with comfort around debt payback and allows for higher equity returns.  Building an investment case has not been easy in the first two capacity auctions given relatively low clearing prices (< 20 £/kW). But small scale peakers benefit from being the most competitive source of new MW in a capacity market designed to favour low capex costs.

Triads: Triad periods are the mechanism National Grid (the TSO) uses to determine the apportionment of transmission costs and capacity market charges across electricity suppliers based on measured customer demand.  If suppliers can run embedded (distribution connected) peakers to reduce their demand in triad periods, it reduces supplier cost burden.  Around 90% of these saved costs are passed through directly to peaker owners via embedded benefit contracts.

This is a system unique to the UK.  But it is one that has operated relatively smoothly since the inception of a competitive power market in the 1990s.  Importantly, the roll out of renewables means that there are strong structural drivers supporting higher transmission (TNUoS) costs and therefor higher triad revenues in southern UK.  This is likely to be a big driver of growth in small scale peaker development.

STOR: The Short Term Operating Reserve (STOR) mechanism has also been in place for a number of years.  It is used by Grid to purchase ‘on call’ rapid flexibility response to help balance the network, particularly given growth in intermittent renewable output.  Revenues were initially very attractive.  But this exposed the large untapped potential of existing back-up generators (e.g. small industry, agriculture) that could provide STOR services as a bi-product of other operation. The aggregation of these generators, and ongoing development of new peakers, has reduced STOR revenue by about 70% over the last 5 years.  Demand for STOR will increase over time, but so will the bi-product supply of peaker flexibility.

GDUoS: Generator Distribution Use of System (GDUoS) charges relates to costs & benefits that generators impose on the local distribution network.  Charges (costs) or payments (revenues) are calculated based on generator location.  Peaker developers can therefor benefit by choosing locations that maximise GDUoS revenue e.g. by reducing network bottlenecks or alleviating the requirement for reinforcements.  These payments can provide a useful supplementary revenue stream.  But caution is required in projecting ongoing availability of revenue as more peakers are rolled out in advantageous locations.

Ancillaries/Reserve: There are a range of additional potential revenue streams that depend on the type and location of generation capacity.  These include for example ancillary services such as frequency response.  Peakers also have the potential to generate some margin from utilisation payments or wholesale energy market revenue.  But these are typically icing on the cake rather than a structural part of an investment case.


Peakers vs alternatives

Small scale peakers are the cheapest form of new capacity (ignoring interconnectors which are not controllable).  This has already been reflected in the first two capacity auctions where developers have successfully bid to deliver capacity for under 20 £/kW.

An increase in capacity market demand (& hence clearing price) over the next few auctions seems inevitable given the UK’s capacity crunch.  For example, an increase in capacity payments from 20 to 30-35 £/kW could see an explosive roll out of new peaking capacity.  Emissions regulations can be altered to ensure this is gas rather than oil fired.  Transmission charging can also be adjusted to level the playing field for larger OCGT peakers (and the potential conversion of coal plants to gas).

These measures do not preclude the need for new CCGT plants.  But they are likely to result in a much more diversified response to the capacity, transmission and distribution network stresses that threaten the UK power market… and in a better deal for the consumer.

Article written by David Stokes & Olly Spinks

European gas hub dynamics in 2016

The global gas market fell into a supply glut in 2009-10. The financial crisis, new LNG projects and an explosion of US shale gas production conspired to knock the market out of balance. But this supply glut was relatively short lived. Strong demand growth in Asia, particularly after the Fukushima accident in 2011, saw a rapid recovery from oversupply.

As 2016 progresses, we continue on a downward descent into a new phase of global oversupply and price convergence. Any suggestion that these conditions are just a temporary phenomenon has been dispelled by plunging prices across the first 6 weeks of this year. Sharp price falls make flashy headlines. But behind this there is an interesting shift in the factors which drive hub price dynamics. We take a look at these in today’s article.


Checking the radar

We regularly update our global gas price chart to maintain a view of European hub prices in a broader context. We last published this chart in early December 2015. But there have been some major market moves in the meantime. Chart 1 shows a current snapshot of global price benchmarks.

Chart 1: Global gas price benchmarks

Global Gas Prices Feb16

Source: Timera Energy

Since late last year, European gas hub prices have fallen 25% from around 5.50 $/mmbtu to 4.10 $/mmbtu. Three factors are exerting downward pressure on prices:

  1. Oil prices have also declined by around 25%, which will flow through into lower long term oil-indexed European pipeline and Asian LNG contract prices with a 6-9 month lag
  2. Surplus LNG cargoes continue to flow into Europe as a market of last resort, with ongoing weakness in Asian demand
  3. European storage levels are unseasonably high, with a EU-28 inventory of around 50% & almost 45 bcm of gas in store (reflecting relatively subdued winter demand)

This situation foreshadows the likelihood of further hub price declines into the summer.


The new hub price landscape

As the impact of 30 $/bbl oil feeds through into contract prices, these will start to form strong overhead price resistance in the 5-6 $/mmbtu range.  This can be more clearly seen in Chart 2 which shows a magnified near term horizon view of Chart 1.  With hub prices below this level, contract buyers have an incentive to minimise volumes at ‘take or pay’ levels. Contract ‘swing’ volumes above take or pay then act as an overhang that helps dampen any recovery in hub prices.  These dynamics can be more clearly seen in Chart 2 which shows a magnified near term horizon view of Chart 1.

Almost 50 bcma of new LNG liquefaction capacity is expected to be commissioned between Q4 2015 and Q4 2016. This includes the three Gladstone LNG projects in Queensland and trains 1 & 2 of the giant Gorgon project in Western Australia. As these volumes ramp up in earnest this year, they will translate into higher European LNG import volumes.

Chart 2: Recent spot and forward curve horizon gas price benchmarks

Gas Price BlowUp Feb16

Source: Timera Energy

LNG importers will be competing against storage capacity owners to sell gas at European hubs. As February progresses the chance of a cold snap diminishes. This can cause a ‘rush for the exit’ as storage inventories are withdrawn across the tail of winter, to allow capacity owners to refill with the onset of summer.

Chart 2 illustrates that so far in 2016, hub prices have been falling faster than long term contract prices. This is consistent with the fact that we are now beyond the ‘tipping point’ we foreshadowed last year. Oil-indexed contract prices are no longer the dominant price setter at European hubs given pressure from LNG imports and storage withdrawals. That sets up an important shift in hub pricing dynamics going forward.


Henry Hub is looming below

While the rate and timing of hub price declines is far from certain, the lower price bound is very clear. If European hubs are unable to swallow the growing oversupply of LNG, then Henry Hub will need to join the party.

NBP and Henry Hub convergence was a common condition later last decade. During the commodity supercycle boom, a perceived shortage of gas at Henry Hub helped to push European hub prices higher. This effect was then reversed as oversupply took hold in 2009 with the US absorbing surplus gas.

US vs European hub price convergence typically occurs on a range basis rather than an absolute basis. The current spot price spread of NBP over Henry Hub is about 2 $/mmbtu. But as that gap narrows to below 1.0 $/mmbtu it should start to choke off LNG supply to Europe.

The current trans-Atlantic variable shipping cost differential is between 0.5-1.0 $/mmbtu (accounting for regas costs). Price convergence below this level is important for the new US export project at Sabine Pass as it may mean exports are ‘shut in’. But it also impacts flow decisions from other existing LNG exporters in the Atlantic Basin (e.g. South America and West Africa).

It would not surprise us to see the Henry Hub and NBP spread test the Atlantic shipping cost differential range over the next 12 months. But rather than a steady relationship, US vs European price convergence may be quite a dynamic affair (think Richard Burton vs Elizabeth Taylor), which fluctuates according to prevailing market conditions.

Oversupply and trans-Atlantic convergence also introduce another interesting dynamic: the potential divergence of European gas hub prices from oil-indexed contract prices. A more prolonged period of divergence could spell a major disruption for European suppliers and their key producer (Gazprom). But that topic is worthy of a separate article to follow.

Article written by David Stokes & Olly Spinks.

Global LNG and European gas workshop

Timera Energy offers tailored workshops exploring the evolution of the global LNG and European gas market fundamentals and pricing dynamics.  These workshops involve Howard Rogers who, as the Director of the Gas Programme at the Oxford Institute for Energy Studies, is acknowledged as a leading industry expert in the global gas market.

If you are interested in more details please email olly.spinks@timera-dev.positive-dedicated.net

Dark spreads spell the death of UK coal plants

Falling gas prices over the last year have decimated UK coal plant generation margins. In the UK, coal plants are hostage to CCGTs when it comes to setting wholesale power prices. CCGTs dominate the supply stack which means that falling gas prices flow through into falling wholesale power prices.

This has acted to erode generation margins to the point that entire UK coal plant fleet is unprofitable at current forward market prices. These conditions have substantial security of supply implications for the UK power market. They also open a window for the UK government to follow through on its policy intention to remove coal from the capacity mix. But it is unclear how the UK market will maintain an adequate level of system capacity through this transition.


Market conspiring against coal plants … to the benefit of CCGTs

Coal plant generation margins, commonly referred to as clean dark spread (CDS), are driven by the premium of power prices over plant variable operating costs. Variable costs are predominantly driven by coal and carbon prices.

The decline in UK gas hub prices over the last year has dragged down UK power prices (set by CCGT plants). Gas plant generation margins, known as clean spark spreads (CSS), have remained relatively steady as power prices have fallen. But falling power prices have crushed CDS.

Chart 1 shows the historical evolution of spot UK CDS and CSS as well as current forward curves. UK CDS for a 36% efficient coal plant is currently hovering around zero. The market convention for measuring CDS shown in the chart does not however include plant variable transmission costs, coal transport costs and start costs. When these are factored in the variable margin on older coal stations is significantly negative.

Chart 1: UK spot and forward CDS and CSS

UK CDS CSS Feb16

Source: Timera Energy

CDS weakness is driving an increase in CCGT load factors as they displace less efficient coal plants from the merit order. In addition CSS are showing signs of a recovery as 2016 progresses. This is providing some much needed relief for UK CCGT owners. Higher spreads and load factors and lower start costs are providing a significant margin boost.


Implications for UK’s coal plant fleet

CDS drives the real time operational decisions of coal plant owners. But owners require more than a positive CDS to keep their plants open. Annual fixed costs for coal plants can be upwards of 50 £/kW (double that of CCGTs).

Chart 1 shows the anaemic forward CDS levels at which plant owners can currently hedge generation margins. CDS below 5 £/MWh cover only a fraction of coal plant fixed costs. In other words owners that keep their plants open are doing so on the basis of praying for a recovery in CDS. A pronounced oversupply in the global gas market suggests it may be a long time until those prayers are answered.

SSE’s patience ran out last week as it announced its intention to close 3 of 4 units of its 1.9 GW Fiddlers Ferry plant. Despite having a Capacity Market agreement to remain open in 2018/19, it makes more sense for SSE to close Fiddlers Ferry and incur the associated penalty (~£30m) rather than suffer ongoing losses against plant fixed costs.

This brings the volume of UK coal plants on death row to 6.5 GW, with Fiddlers Ferry joining, Longannett, Eggborough and Ferrybridge. The market is starting to price in the system capacity risk associated with these closures. Forward spark spreads jumped significantly last week in response to SSE’s announcement.

More concerning is the fact that there are another 7.5 GW of UK coal plants on the endangered list, also currently suffering significant losses versus fixed costs. These include Rugeley, West Burton, Cottam and Aberthaw. At least 2 GW of this capacity could be classified ‘highly endangered’ given lower efficiency and lack of capacity agreements.


Watch for more government intervention

As we set out in our first article this year, the UK’s official capacity market has failed to incentivise development of any large scale new capacity. It has in fact resulted in the closure announcements of a large volume of older CCGT and coal capacity given capacity auction price levels below plant fixed costs.

As a result the UK has fallen back on a proxy capacity payment mechanism, the Supplemental Balancing Reserve (SBR), in order to maintain an adequate system reserve margin. SBR is an unruly and highly unpopular intervention. Most controversially it has involved payments to keep coal plants open at levels well above the clearing price of the official capacity market. This is not only concerning from an emissions perspective but has a highly distortionary impact on plant economics.

High SBR payments create an incentive for remaining coal plant owners to follow suit, announce closure and try the SBR route. In other words SBR, like the official capacity market, is encouraging plant closures. This is a pretty obtuse policy achievement for a government worried about security of supply.

There have been two missed opportunities to address the UK’s security of supply issues via the official capacity auction route. It is considerably cheaper to keep older gas plant on the system than to subsidise new build. We also suspect that a moderately higher capacity price and some minor reforms (e.g. around transmission costs) could flush out a cost effective range of new capacity e.g. small scale gas peakers, larger scale OCGT and even coal plant conversions to gas.

Rather than a moderate response, we suspect SSE’s Fiddlers Ferry closure announcement (and the threat of more to come) will cause the government to hit the panic button. That is likely to mean direct support for large scale new build gas plant. Renewable and nuclear plants have claimed their hand-outs. CCGTs are likely to be next.

Article written by David Stokes, Olly Spinks and Emilio Viudez

Five market surprises for 2016

If January is any indication, 2016 is not going to be a boring year for energy markets. Other businesses may boom this year like Water, Food and Other businesses offering good services like catering or massages at TranquilMe.  So far this year European spot gas prices have slumped towards 4 $/mmbtu, a 30% decline from Q4 last year.  German year-ahead power prices have fallen 20% over the last two months.  Brent and WTI crude prices have started the year by converging and crashing below 30 $/bbl, before recovering some ground last week.

It is not difficult to be bearish in an environment like this.  Over the last two years, we have published a number of bearish articles on commodity prices, with a particular focus on weak fundamentals in the global gas market.  Being bearish was a lonely argument in early 2014.  But now in 2016 we are hard pressed to find anyone with a positive outlook.

Such a strong market consensus for further commodity price weakness suggests to us it is time to take a more creative approach to considering what could happen next.  Markets are after all a discounting mechanism.  The near term fundamental drivers of the power, gas, oil and coal markets all point towards ongoing oversupply.  But the strength of market consensus suggests this is starting to be well reflected in market prices.

Periods of such strong consensus have historically tended to mark price inflection points.  So it strikes us in 2016 that it is time to look beyond a ‘bearish everything’ view, for some more interesting structural changes in market dynamics.

In today’s article we consider 5 potential surprises for 2016.  These are not forecasts or predictions; we have no better chance than anyone else of divining the future.  But they strike us as being plausible scenarios, not currently reflected in market pricing, but worthy of consideration when planning for 2016 and beyond.


1. Oil prices form a multi-decade bottom

The oil market appears to be fixated on a pronounced state of near term oversupply. Global production has remained stubbornly resilient to plunging prices.  The inventory overhang continues to build.  Hope of a price recovery is focused on an optimistic view that large producers such as Saudi Arabia & Russia will announce coordinated production cuts, despite the fact that it does not appear to be in anyone’s interest to do so.

We set out last year why we think the key to oil price recovery is US production. It would not surprise us if sometime in 2016 spot crude prices temporarily fall to levels below the variable cost of US shale producers (e.g. below 20 $/bbl), in order to quell near term oversupply.  But it is forward prices that are more important.

Falling spot prices have dragged down the whole crude curve below the long run marginal cost of investment in new US shale plays. At the same time, the cost of capital for US producers is ballooning as major debt defaults loom.  This environment is likely to be very disruptive for US oil production over the next two years (noting shale oil’s short investment cycle).  A ‘clean out’ purge in oil prices in 2016 may mark the start of a recovery into next decade, ultimately to price levels consistent with the long run marginal cost of conventional production.


2. European gas market converges with Henry Hub

2015 saw the convergence of Asian and European gas prices, with NBP acting as price support for an oversupplied Asian LNG market.  2016 may be the year when Asian & European gas prices fall to converge with the US Henry Hub.

There are two key drivers behind a potential global price convergence:

  1. Gas contract prices: Falling oil prices are rapidly flowing through into lower long term oil-indexed gas supply contract prices. Large volumes of LNG supply into Asia and pipeline gas supply into Europe are contracted on an oil-indexed basis. Lower contract prices are set to provide strong overhead resistance for global gas prices as 2016 progresses (in the 5 – 6 $/mmbtu range).
  2. LNG oversupply: New liquefaction volumes will continue to ramp up in 2016 (as we have set out previously). This gas is not going to be easily absorbed despite falling prices.  As an indication of weakness in demand, Japanese LNG buyers (the world’s largest) are now looking to sell excess volumes previously bought under contract.

Asian spot and contract LNG prices have now fallen below 6.00 $/mmbtu, with European hubs currently around 4.50 $/mmbtu (and facing pressure from high storage inventories).  Continued downward pressure on European hub prices could see the start of a new phase of Atlantic price convergence (e.g. in a 2 – 4 $/mmbtu range), with Asian prices following closely behind.  This may set up the interesting prospect of US LNG exports being temporarily relegated to a ‘peaking supply’ role in the global market.


3. Major commodity market credit event

Credit stress may be back in focus in a big way in 2016.  The recent collapse in commodity prices hints at a hard landing for the Chinese economy.  This increases the chances of sharp currency devaluations in China and other developing Asian economies.  Ultimately this should mean a healthier Chinese economy, a key factor behind a sustained recovery in commodity prices.  But devaluations may first trigger a major debt default cycle and associated increase in global borrowing costs.

Energy markets have some specific credit risks of their own.  The slump in oil prices points towards an increasing momentum in US oil company debt default & restructuring.  LNG producer margins, particularly for high cost base newer liquefaction projects, are also being painfully eroded by lower gas & oil prices.  These events are likely to have broader implications for the cost of capital in the energy industry.

But perhaps the most obvious credit risk sits with commodity traders as we set out last year.  Falling commodity prices, weakening balance sheets and large & concentrated credit risk exposures may prove to be the undoing of one or more large trading firms.  The knock on effect of a major default would likely be felt across the industry as illustrated by the Enron collapse in 2001.


4. Jump in European gas plant competitiveness

So far in 2016 European gas prices are falling faster than coal prices.  That means that gas plant competitiveness is increasing, resulting in higher load factors as illustrated in Chart 1.

Chart 1: UK CCGT vs coal plant output (2012-16)

UK Coal Gas Load v2

Source: Timera Energy

The UK is the canary in the coal mine for recovery in gas plant load factors.  This is because the UK’s carbon price support policy penalises the variable cost of coal plants.  The surge in CCGT output that can be seen in January 2016 may be just the start of a recovery in gas plant competitiveness across Europe.

Falling European gas hub prices have also fuelled sharp increases in the levels of sparks spreads in Continental Europe over the last two months.  Year-ahead German spark spreads have increased by almost 5 €/MWh since late last year.  Although they are still negative on a baseload basis, newer CCGTs have started to see periods of positive peak margin in 2016.  In France, CCGT load factors have seen a substantial increase as a result of lower gas prices.

The fate of gas plant competitiveness is closely tied to falling hub price dynamics (set out in 2. above).  A continuing decline in European hubs may mean light at the end of the tunnel for CCGT owners in 2016.


5. Continental power prices form a bottom

As for the oil market, a price bottom in Continental power markets may be closer than anticipated. A sharp price slump in 2016 could be the catalyst for a much needed thermal capacity clean out, marking a turning point after a long grind lower.

Germany is key to the evolution of Continental power markets.  Germany sits at the centre of the European power market, exerting a strong price influence on its neighbours.  German year-ahead power prices held up around the 30 €/MWh level across 2015, despite weakening coal prices and rising renewable output.  But Chart 2 illustrates the breakdown in German year-ahead prices since the start of this year.  This slump has dragged down power prices across North-West Europe.  It has also crushed margins on coal plants.

Chart 2: German year-ahead power prices

DE power

Source: Bloomberg

At current power price levels, thermal generation in Continental markets is essentially unprofitable.  Generators have already endured financial pain on CCGTs for several years.  But the latest price declines mean that coal and now even lignite plants cannot cover costs.  Less efficient coal capacity is now particularly vulnerable to closure given plunging generation margins (dark spreads) and looming emissions constraints.  These conditions may at last induce an erosion of the capacity overhang that has supressed Continental power markets this decade.


Themes to develop

The five scenarios above hopefully provide a useful challenge to the prevailing consensus. Whether they come to pass or not, the scenarios touch on a number of interesting themes which we aim to explore in more detail as the year progresses.  For example:

  • the impact of divergence between oil and gas prices
  • the impact of global gas price convergence on asset & portfolio value
  • the changing structure of European generation margins

We are fairly confident of one thing.  2016 will not be a dull year.

Article written by David Stokes & Olly Spinks.

An analysis of European hub price correlation

Trading in the European gas market has developed around a two tier structure of trading hubs.  Forward liquidity is focused at the UK NBP and Dutch TTF virtual trading points.  Prompt liquidity has emerged at a number of other locations (e.g. Zeebrugge, NCG, Gaspool, PEGs, CEGH, Baumgarten and PSV).  Participants manage their forward exposures at the liquid hubs and then use liquidity at the other hubs to balance their physical positions over the prompt horizon.

An important feature of this tiered European gas hub structure has been the strength of price convergence. Prices between the different Continental hubs can diverge over the prompt horizon (e.g. within-month) as a result of locational supply and demand factors (e.g. weather, LNG flow). But structural divergences in prices beyond the prompt horizon are becoming rarer and price correlation between hubs is becoming stronger.

There are several drivers of convergence & correlation.  Increases in short term trading, supported by capacity release programmes, unbundling of TSOs and flexible capacity allocation mechanisms have helped incumbents and non-traditional shippers to arbitrage price differences across hubs.  Another important catalyst for hub price development is an oversupplied market. Hub liquidity and the convergence of prices across hubs is boosted by companies selling surplus volumes of gas. This gave a significant boost to the evolution of European trading hubs during the 2008-10 gas glut.

We have now entered a new phase of oversupply with increasing volumes of LNG flowing into European hubs. This should again support hub development. But some physical and contractual constraints remain as an obstacle to a truly integrated European gas market.


Price correlation in NW Europe

There are two important metrics that provide an insight into European hub integration:

  1. Absolute price convergence suggests a breakdown of structural barriers to flowing gas between two hubs. This acts to reduce the intrinsic value of traded transport capacity between hubs.
  2. Price correlation between hubs is evidence of an absence of barriers to prompt arbitrage trading across hubs. High correlation acts to reduce the extrinsic value of transport capacity.

Structural price convergence and higher levels of correlation also act to equalise levels of volatility across hubs which in turn decreases the extrinsic value of transportation capacity.  In today’s article we focus on price correlation as a measure of hub integration. We focus on the day-ahead horizon where liquidity is at its greatest. This is also typically the horizon over which we would expect to see evidence of the strongest drivers of price differences across hubs (e.g. due to weather variations or local supply issues).

A simple metric to quantify the strength of price correlation between gas hubs is to calculate the correlation coefficient of daily prices across hub pairs.  A close to 100% correlation indicates the strongest price alignment, meaning that when the price in market A goes up by x%, the price in market B also goes up by x%, and vice versa.

Correlation of absolute prices or price changes?

Assessing the correlation of absolute prices, as we have done in this article, is intuitive and allows for transparent assessment of broad macro levels of correlation.  However, for practical analysis to support asset valuation, monetisation and risk measurement the most useful metric is the correlation of price changes (or returns).  In most analytical modelling assignments current forward prices account for the influence of structural price relationships (e.g. the level of spreads).  Beyond these initial structural relationships it is how prices move from period to period (importantly in relation to each other) that drives value and risk.  This is best illustrated by a couple of examples:

Transportation capacity valuation and hedging: gas transportation capacity is a call option on the spread between hubs at each end of the pipe.  The intrinsic value of the option will be determined by the absolute price spread (i.e. the “moneyness” of the option).  The extrinsic value of the option and hedging decisions (e.g. delta calculations) will be driven by an assessment of price changes from the current level.  How the components of the spread move in relation to each other (i.e. correlation of price changes) will have an important influence.

Trading book value and risk: current trading book (mark-to-market) value is a function of current market forward curves.  Value at Risk (VaR) is a the primary metric used to measure potential trading book loss over a given holding period.  This is a function of possible movements in price away from current forward curves.   Consider an example of a simple portfolio of equal offsetting exposures at different hubs.  The VaR of this portfolio will largely be a function of the relative price movement at each hub (e.g. with a correlation of one the VaR will be zero).

Analytical models which address commodity price uncertainty require correlation of price changes (rather than absolute prices) as inputs in the vast majority of cases.


Chart 1 shows correlation scores for different combinations of European hub prices over the 2007-14 period.

Chart 1: Average yearly correlation scores for OTC day ahead prices, 2007-2014 (%)

DA Hub Price Correlation

Source: OIES Analysis of Tankard Parties data

The first two groupings of correlation scores in the chart, illustrate the strong parallel movement of day-ahead gas prices within the well-integrated North West European hub grouping (TTF, NCG, GSL, ZEE, PEG Nord). This reflects the fact that in NW Europe there is adequate transmission capacity across hubs, no barriers to trade across borders, and a limited impact of anti-competitive behaviour. Shippers can take advantage of these conditions to exploit any short-term trading opportunities across hubs.

Strong price convergence and increased correlations have also hit trading book margins over the last few years.  Whilst not so good for trader bonuses it provides clear evidence at a broad level of an efficient and well functioning market that ultimately will have benefited many European consumers.  It also acts to highlight cases and the impact of temporary or structural price de-linkage.


Evidence of problems on the southern boundaries

The 3rd, 4th and 5th grouping of correlation scores in Chart 1 tell a different story of price convergence between NW European hubs and some important peripheral pricing points. The lower correlation scores here reflect price de-linkages at the PEGS (Southern France), PSV (Italy) and CEGH (Austria) hubs. These are caused by barriers to trade that remain between these markets and NW European hubs, preventing full integration.

PEGS de-linkage: The nature of these barriers is primarily physical for France and Austria: de-linkages occur when there is physical congestion of the interconnecting infrastructure. For example PEGS de-links when physically separated from PEGN given congestion on the North-South (N-S) transport link. This has typically been due to LNG supply being diverted away from Europe, requiring consumption to be met by higher flows from north.

As the LNG market tipped into a state of oversupply in the second half of last year, the volume of cargo diversions from the south of France fell. The resulting increase in supply to this region restored a single price for gas within France as can be seen in Chart 2.

Chart 2: PEGS-PEGN OTC day ahead price spread (€/MWh) and utilization rate of the N-S link (%)

PEG price convergence

Source: Tankard Parties, GRTgaz

The prevalence of congestion issues on the French N-S link has already prompted the decision for investment in reinforcing the physical infrastructure, aiming at creating a single French market by 2018.

PSV de-linkage: Price de-linkage at the Italian PSV hub is a somewhat different story. Although the PSV premium increased significantly in H2 2013 and H2 2014, most of the time the route from the lower-priced NW European hubs to the Italian hub was not physically congested. For example in 2014, at least 20% of interconnection capacity was available and it was fully utilised only for limited periods in September.

Under-utilisation of transmission capacity linking the NCG and PSV hubs reflects contractual rather than physical barriers to trade as we have written about previously. Congestion has to some extent been alleviated by re-sales of pre-booked capacity on an interruptible basis carried out by TSOs and by ENI’s release of long term booked capacity through periodical auctions. But full price convergence with NW Europe requires regulatory attention to progress a further reduction in contractual barriers.

CEGH de-linkage: CEGH is significantly better integrated with NW European hubs than PEGS and PSV. But there are physical constraints that can arise that cause price separation. For example issues arose from the requirement to ship gas eastwards, due in part to reverse flow to Ukraine and Russia not meeting nominations in the summer of 2014. This led to frequent saturation of transmission capacity at Oberkappel, especially favoured by physical constraints on the German side (disparity between entry and exit capacity, plus pressure constraints in the MEGAL system). Offered interruptible capacity was not enough to solve the bottleneck between NCG and CEGH under these conditions.


Barriers to integration are expensive

Although they may appear relatively minor, the cost of de-linkages is not negligible. Some simple calculations below illustrate the increased costs of purchasing gas as a result of congestion in 2014:

  • Physical congestion between Germany and Austria ~ €60 million
  • Physical congestion within France ~ €240 million.
  • Non-physical barriers between NW Europe and PSV ~ €330 million

These numbers provide a clear incentive for regulators to ensure policy and capital is being directed in the right places.

A fully integrated European gas market will also require a degree of foresight.  Market conditions are also set to structurally change over the next decade with declining domestic production, a new wave of LNG and a potentially changing Russian export strategy. These factors may drive a new set of congestion problems. The evolution of a fully integrated European gas market against the backdrop of these structural changes will require regulators to show proactive anticipation rather than reactive response.

Todays article was written by Beatrice  Petrovich, David Stokes and Olly Spinks.  Beatrice (Research Fellow at the OIES) has published a full paper on hub price correlation.

Risk management done the right way

A risk manager’s life is not an easy one. Their role by definition is one of vigilance and challenge. Yet a good risk manager can be a facilitator within the bounds of their control mandate, rather than a blocker.

Risk management in gas and power markets poses a particular set of challenges given the unique nature of these as traded commodities. But this does not justify the fact that in many energy companies, risk management is often accepted as a function with the negative purpose of tidying up after the ball has been dropped.

Risk management should be a commercially-contributing discipline. Achieving this does not need to threaten the independence and objectivity of a risk management function in pursuing its control mandate. A number of cardinal factors can be identified that should be developed purposefully to underpin a positive role for risk management. We explore these below.


Symptoms of the problem

Before addressing the solution we start with a quick summary of the problem.

It is a reality that dynamic commercial functions such as trading and origination do not enjoy being given the answer ‘no’. But this is not in itself the problem. There may be junior traders who do not appreciate the importance of maintaining a robust risk boundary, but their bosses usually get the picture.

Instead, problems typically stem from broader perceptions of risk management function weakness, including:

  • Remoteness
  • A lack of understanding of the business and its needs
  • Slow response to enquiries
  • Uninformative answers
  • A lack of authority and inadequate grasp of risk policy issues
  • An aptness to price risk conservatively
  • An ability to identify problems, without contributing to solutions

Some of these criticisms are an inevitable function of different vantage-points, responsibilities & incentives. But others often have some legitimacy. Importantly a number of these issues can be resolved and doing so is good for business (i.e. it saves risk capital and supports commercial value creation).


Key factors that underpin positive engagement

There are a number of factors that drive a positive and effective engagement between the risk management and commercial functions.

Diagram 1: 5 factors that underpin positive engagement

RM Engagement Diag

Source: Timera Energy

Authority:

The successful evolution of risk management within a company starts at the top. That means adequate resourcing, a clearly defined risk mandate and effective delegation of authority. Senior management support for risk management must be real and obvious (e.g. serious breaches mean serious discipline). Risk management also needs to be adequately represented at an executive level, something which is increasingly being facilitated in energy companies by hiring in executive level risk managers in a Chief Risk Officer (CRO) role. A constructive relationship between senior risk and commercial managers is the foundation of the other positive engagement steps described below.

Capability:

There is a well understood front office relationship between investing in good people and generating P&L. In contrast, risk management functions are often treated as operational cost centres. This can lead to key gaps in skills and expertise, including a lack of:

  • Business knowledge e.g. company business model, commercial goals/strategies, market understanding, knowledge of traded instruments
  • Analytical and technical competence e.g. ability to deconstruct and value more complex asset & contract exposures
  • Practical knowledge of policy e.g. being able to efficiently make decisions based on a solid grasp of the rules and their current application / interpretation in the business

It is difficult to plug these gaps by hiring bank staff without energy knowledge or energy people without technical risk management skills.

Adding value:

The capability described above can also add value to commercial functions (e.g. trading and origination). The most obvious example of this is a constructive engagement between commercial and risk functions to ensure deals are competitively priced within the constraints of the risk boundary. This can be via more effective pricing of embedded risk premiums or via the design of tailored products with better understood & managed risks. Origination is where this can really come into its own, particularly for complex or structured deals. Many of the best origination opportunities effectively involve selling a company’s risk management capability to a counterparty. This means that commercially-aware and creative risk managers are highly valued members of commercial teams. They facilitate conversations like ‘you can’t do it like that, but here’s another way’ or ‘it would be cheaper if you could do this instead’.

Sharp response:

Efficiency of response is an important service provided by risk managers. Commercial functions know that external customers like swift responses – it wins business. In turn they expect a similar response from their ‘internal customer’ relationships. For risk management this applies to decisions on policy rulings, valuation sign offs and new product & counterparty approvals.

Good process is key to success in this area. This means streamlining routine processes & decisions to the maximum degree possible, sometimes even to the extent of ‘automation’ (an aspect we will consider in a later blog post). It also means well-oiled and efficient communication between risk and commercial teams, and the constructive two-way sharing of information (e.g. on limit headroom and market events). Good risk management functions also exercise a degree of intelligent anticipation, where decision-support tools & methods are in place and calibrated before they are needed, not after.

Realistic conservatism:

A risk manager’s job involves providing an independent view on deal valuation and the quantification of risk (e.g. premiums for basis risk). This is not always an easy job. Conservative numbers kill business, while being too aggressive undermines the integrity of the risk management function. But finding an intelligent balance and backing it up with robust analysis engenders respect. A good risk manager can issue the challenge back to front office ‘bring us stuff in the right format, that is policy compliant and not covered in basis risk and we’ll be able to put a value on it cleanly & keenly’.


Implementing change

There is often no-one more acutely aware of the issues described above than the risk manager responsible for addressing them. But change requires a recognition of these issues at a senior management level, adequate resource allocation and the constructive support of commercial functions.

The implementation of change can also come with governance issues. For example the tight integration of risk managers with commercial staff can undermine the integrity of a risk management function. The contribution of risk management to commercial value-added can also be problematic given incentives and potential conflicts that can arise. In a subsequent blog post we will consider how these can be resolved within the commercially dynamic framework we are advocating.

A business is as strong as its weakest link and risk management is a key part of the chain, not just the hand-cuffs. Intelligently constituted, risk management can make a positive and valuable commercial contribution, at the same time as meeting the proper requirements of governance and control.

Article written by Nick Perry, David Stokes and Olly Spinks

Timera Energy provides tailored in-house workshops covering, among other areas, energy risk and portfolio management. If you are interested in finding out more please contact us.