The Timera Blog is about to evolve

We have been publishing a weekly blog for 6 years now. Our regular readership has grown to more than 15,000 and the blog has evolved into one of the industry’s leading sources of views and analysis on the LNG and European gas & power markets.

The blog has been developed based on several key principles:

  1. Opinion: Publishing clear views based on our practical experience working in the energy industry
  2. Analysis: Supporting those views with thorough and transparent analysis
  3. Challenge: Aiming to challenge industry consensus where our views differ
  4. Independence: Ensuring objectivity and a clear separation from our client work
  5. Transparency: Maintaining an archive of all articles, whether our views prove to be accurate or otherwise

These principles remain core to the evolution of the blog.  But the time has come to grow and evolve.

So what’s new?

We will continue to publish our regular weekly analytical articles. But we are launching a new blog page after we return from a summer break.  A preview of the page can be seen below.

As well as providing access to the current and recent weekly articles (via the top panel shown in the picture), the blog page will have two new content columns.

Timera Angle column

The left hand ‘Timera Angle’ column will provide you with shorter, sharper written content than our regular blog articles.  A starter to compliment the main course.

Our focus here is the efficient delivery of views and opinions, backed by relevant facts and data.  Where it makes sense, we will also provide links to other useful sources of information (e.g. presentations, briefing papers, articles, data sources).

In terms of content our, aim is to keep a practical commercial focus. To provide you with information and views on investment, value management and markets that has a tangible application.

An example of ‘Timera Angle’ content is shown below.

Timera Snapshot column

The right hand ‘Timera Snapshot’ column is focused on fast dissemination of information using visual content e.g. charts and tables. You can digest the key messages from these ‘Snapshots’ in seconds.  If the material is relevant then you can examine the information provided in the charts/tables in greater detail via a pop out graphic.

As Timera has evolved we have developed large databases of market and commercial information.  We also have a range of analytical tools and models that draw on this data to provide us with a ‘dashboard’ view of the evolution of markets, asset value drivers and risks.  This generates a rich source of information that we intend to share via this column.

An example of ‘Timera Snapshot’ content is shown below.

Mining the archive

One of the weaknesses of our blog to date has been the categorisation and tagging of articles and the ability to search previous published content via the blog archive.  This is a shame given many of our blog articles contain information, analysis and charts that have a relatively long shelf life. We are addressing this by building a new Blog Archive page with enhanced search functionality.

Firstly we are re-categorising and re-tagging all our articles using a cleaner structure of keywords.  The new Blog Archive page will then allow you to bring up a list of articles by filtering with a specific chosen set of keywords.  Alternatively you can choose your own keywords by typing into a blog search box.

Expanding team, expanding content

Timera as a company is also evolving and growing. Our core focus is still Europe, but this is extending to a global reach, particularly due to our expanding presence in the LNG market.  This is reflected in the fact that a growing proportion of our clients are Asian and North American companies.

Our team is also expanding.  But the common theme across our team members is still senior ex-industry experience, in order to maintain our delivery of practical commercial advice.  As our blog content evolves, we intend to draw on wider input across our growing team to improve the depth and breadth of the views and analysis we publish.

This will be the last article before a summer break.  In the meantime we will be working to implement the changes described above. The blog will be launched in its new format in late August.  We will also be distributing content using Twitter and Linkedin.

Until then, we thank you all for your continued interest in the blog and wish you a relaxing summer break.

European gas supply sources: Norway

Norway benefits from low sovereign risk, commercial flexibility and close proximity to key gas demand centres. Norwegian exports to Europe hit a record 108.56 bcm in 2016, more than 20% of total European gas demand. But this may well have marked the peak in Norwegian market share.

Norwegian gas production from existing fields is maturing and new gas is becoming more difficult to access. Norway is also cutting upstream investment expenditure, driven in part by a lower oil and gas price environment.

Chart 1 shows a projection of Norwegian production, plateauing this decade, then declining in the 2020s.

Chart 1: Monthly Norwegian exports to the UK & Continent

Source: Timera Energy

The chart also illustrates the pronounced Norwegian seasonal production pattern, which provides the European market with a key source of seasonal flexibility in addition to gas storage capacity.

Diagram 1 provides an overview of the Norwegian pipeline network, which allows access to UK, Germany, Belgium & France.

Diagram 1: Key Norwegian pipeline supply routes

Source: Timera Energy

On average about 75% of Norwegian gas flows to the Continent, predominantly via long term hub indexed contracts. There is ample capacity headroom into the UK, but there can be constraints on flows into the Continent.

However flow volumes to the UK versus the Continent can fluctuate significantly, driven by factors such as LNG import volumes, weather patterns and power sector gas demand. The loss of the UK’s Rough storage facility has also had a major impact on flows. Norwegian exports to the UK are becoming more seasonal in order to ‘backfill’ lost storage deliverability across winter, while making way for UKCS production no longer injected into Rough across the summer.

Hub indexation of long term contracts means Norwegian gas flows are driven by spot price signals. That is also true of the significant volume of uncontracted Norwegian production, which Statoil optimises against UK vs TTF/NCG/Zee hub price signals. This ability to optimise delivery across the multiple entry points shown in Diagram 1, provides important shorter term deliverability flexibility to the European gas market. The ability to arbitrage price differentials across hubs also underpins the structural price convergence across North West European hubs.

But is Norway a contender in the evolving battle for European gas market share? In a word no. Norwegian export volumes are driven by an annual government production mandate that is set to decline as production matures. Norway will continue to be a key exporter to Europe for many years to come. But it will watch the evolving battle between Russian and LNG imports as a price taker from the sideline.

Article written by Olly Spinks & David Stokes


Practical view of Brexit impact on UK gas market

The uncertainty surrounding Brexit is a breeding ground for theories and threats. There are some genuine economic risks posed by Brexit that may have a knock on impact on energy markets. But some increasingly exaggerated claims are circulating as to the direct impact of Brexit on the UK gas market.

We are particularly sceptical about the ideas that:

  1. “Trade barriers will be imposed on gas”
  2. “A major shift in gas regulatory policy will take place”
  3. “The UK’s gas security of supply will be compromised”
  4. “UK hub liquidity will disappear”

We look at the potential implications of Brexit in these four areas in today’s article. This is also directly relevant to the UK electricity market, given the importance of the UK gas market as a driver.

UK gas trade barriers

In terms of the UK’s future trade & economic relationship with the EU, the two most likely outcomes appear to be either:

  1. A negotiated trade deal: which (from the EU side) would be inferior to the terms of EU Membership, and from the UK side would have to be more attractive than the WTO option
  2. The WTO default option: which provides a ‘floor’ above which an eventual negotiated settlement can be measured on the basis that ‘no deal is better than a bad deal’.

Several industry and media sources have raised the prospect of new tariffs being placed on gas flowing between the UK and EU Member States (Ireland, Netherlands, Belgium) and by extension Norway (an EEA/EFTA Member). Notwithstanding a possible political desire to ‘punish’ the UK (‘pour discourager les autres’), this is a poorly constructed argument on several levels.

The purpose of a tariff is to protect and incentivise ‘domestic’ production by making imports more expensive. But both the UK and continental Europe in aggregate are net importers of gas. Therefore it makes eminent sense for the UK and EU parties to encourage the efficient sharing of gas. In the case of the UK and North West European regions the same logic applies to gas flows. Given both regions have liquid gas trading hubs, flows should respond to price with minimal tariff barriers.

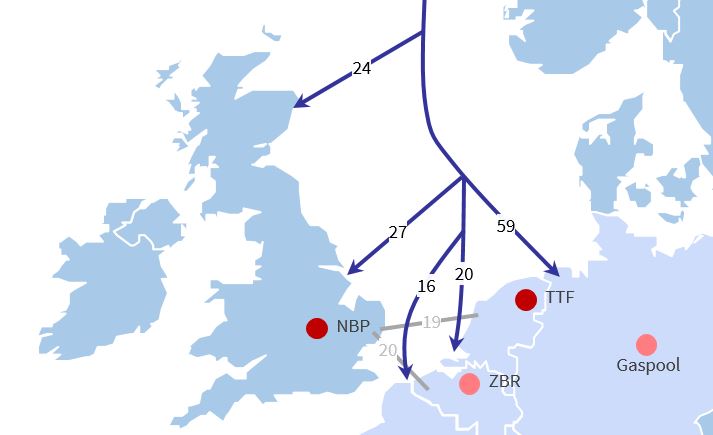
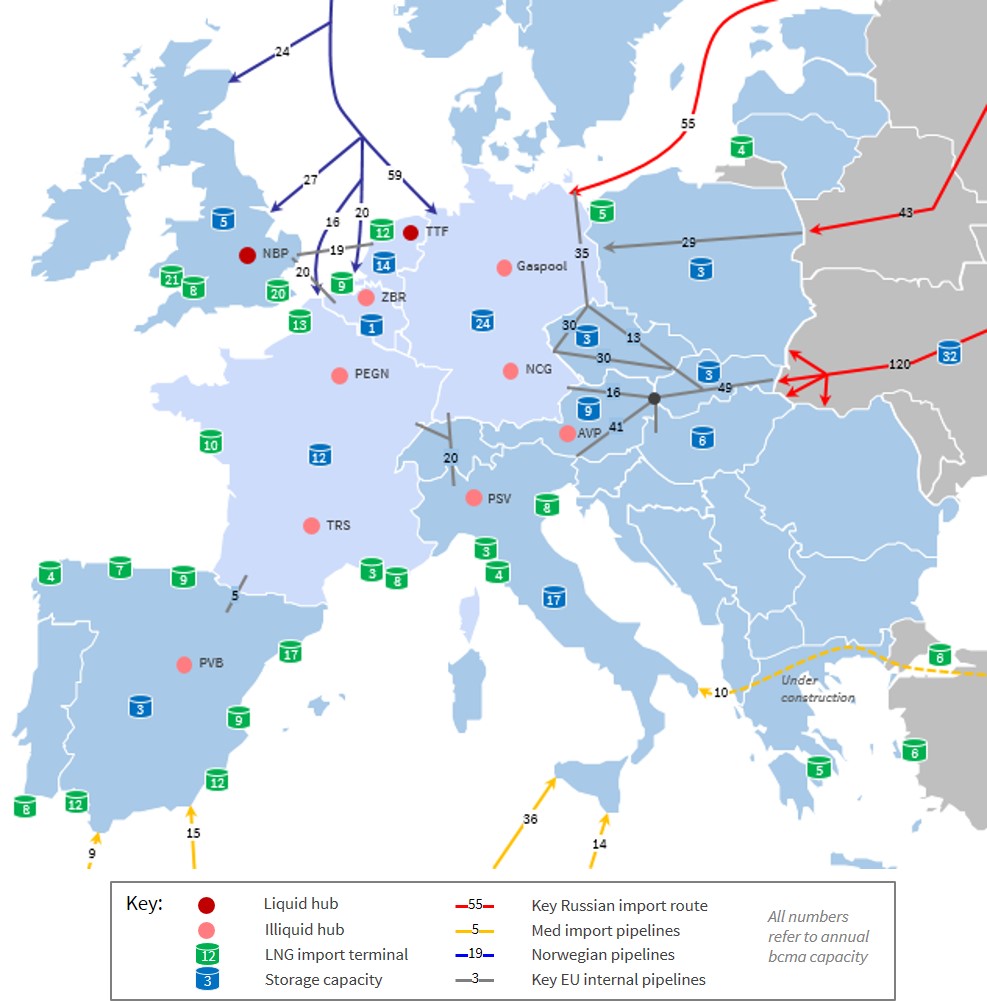
The UK is a large export market for Norwegian gas (supplying some around 37% of UK requirements in 2016). Furthermore the pipeline infrastructure from Norway to the European continent has insufficient capacity to take all Norway’s output. Norway would be unwilling to be penalised by having a tariff charged on its pipeline exports to the UK and lose out to LNG imports paying nothing.

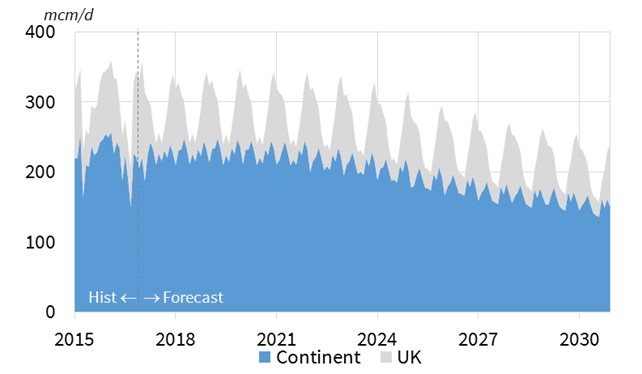
But the situation is more complicated than this. With the closure of Rough storage, flows between the UK and NW Europe are set to become even more seasonal. This means higher exports from the UK in summer as LNG imports and Norwegian gas, surplus to the UK’s immediate requirements, seek storage capacity in onshore North West European facilities. In the winter, the UK will receive higher flows from NW Europe (storage withdrawals, Dutch production and Russian pipeline flows).

The imposition of tariffs on gas flows in both directions between the UK and the Continent would benefit the respective governments of Belgium, Holland and Norway (and the UK if it chose to retaliate with a tariff charge on imports from the EU and EEA). But tariffs would create periods of dislocation between TTF and NBP, probably partially ameliorated by LNG arbitrage. Norway would still need to send considerable volumes of gas to the UK as its pipeline delivery system to the Continent is close to capacity in winter months with high volumes to the UK.

Before going further down this road of speculative cause and effect, it is worth asking if this is really a likely outcome? We can shed light on this question by looking at the tariffs imposed by the EU to a range of non-EU member countries in Table 1.

Table 1: EU tariffs on non-EU member countries

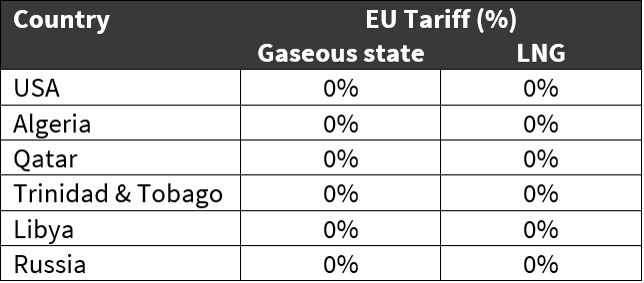
Source: EU Tariff Tables (Code: 2711)

With the EU a long-time net importer of pipeline gas and LNG it is perhaps no surprise that it imposes zero tariff on imports.

So if there was to be a post-Brexit tariff imposed by the EU on imports/exports of gas with the UK, it would likely be in the context of a ‘punitive’ deal offered by the EU to the UK. In this outcome the UK may (as has been stated as its ‘negotiating position’) opt for ‘no deal’ and a default to WTO terms.

What does the WTO have to say about gas trade tariffs ? Inspecting the WTO database it is clear that the EU applies no tariffs to either natural gas or LNG under WTO terms.

Given the above it is reasonable to conclude that there is little if any prospect of post-Brexit tariffs being applied to gas flows between the UK and the EU/EEA.

Gas Regulatory Framework Development

The EU on the European continent lagged the UK in liberalising its gas markets by several years. Although the development of EU gas market regulation was based on a ‘from first principles’ approach, the active involvement of interested UK players ensured that ‘lessons learned’ from the UK experience were incorporated. This has led to the UK and EU being reasonably harmonised on gas regulation, with the exception of those continental member states who have been slow to adopt some regulatory packages in full.

UK interests and policy to date clearly support free unimpeded interflow of gas with the European continent in response to hub price signals. As a result it is reasonable to expect that UK regulatory authorities (and industry participants) will continue to broadly comply with future regulatory developments.

Gas Crisis/Security of Supply Management

A set of Draft Security of Supply Regulations published in 2016, shed some light on the EC’s approach to a major supply disruption. The key principle is that in the situation where a key European gas supply source is cut off, the allocation of supply would be taken over ‘by committee’. This approach might conceivably work in some specific cases, for example a group of East European markets with no trading hubs, state monopoly system operators and suppliers/distribution companies and one or two sources of cross border imports. But it seems inapplicable to the liberalised gas markets of NW Europe.

In a supply crisis a ‘committee of the great and good’ on the above model would have to:

  1. Suspend trading on TTF or other liquid hubs (and potentially compensate for losses/declare force majeure)
  2. Take over the control of flows into or out of the bloc of countries forced to share supply and optimise the distribution to customers on a merit order basis, as well as regulating a storage drawdown
  3. Presumably impose a wholesale and retail price controls to guard against speculation.

What seems more practical is the present system of national response, where the system operator intervenes to shed industrial demand in the face of a supply shortfall. The price signals between hubs in northwest Europe will perform a faster and more efficient job of allocating supply and storage withdrawals than any committee (as shown by the Russian gas supply crisis in February 2012). The exclusion of the UK from this framework post Brexit in practical terms is immaterial. Even if invoked it would be unworkable.

Nevertheless this leaves the EU member state of the Republic of Ireland in a seemingly vulnerable position. It has recently brought onstream the much-awaited Corrib offshore field which for a few years may cover some 60% of domestic demand. However the balance is imported from the UK.

Once the Irish Kinsale Head and Seven Heads gas fields commenced decline, imports from the UK met the balance of Ireland’s requirements from 1995 to the present day. Against the backdrop of UK taxpayers bailing out Irish banks after the financial crisis to the tune of £14bn with no popular dissent, it is inconceivable that the UK, post Brexit would fail to supply Ireland with gas (via pipeline interconnectors). Even without the Corrib Field, this is only 5 bcma, just 6% of UK consumption.

NBP vs TTF hub dynamics

The biggest practical impact of Brexit on the UK gas market may be its impact on relative pricing and liquidity of the UK NBP and Dutch TTF hubs.

The key differences between these two hubs are:

  1. NBP is sterling denominated; served by (declining) UK production, Norwegian imports and some 48 bcma of LNG import capacity.
  2. TTF is Euro denominated; served by (declining) Dutch production, Norwegian imports, Russian imports and 12 bcma of LNG capacity in the Netherlands (plus 9 bcma in Belgium).

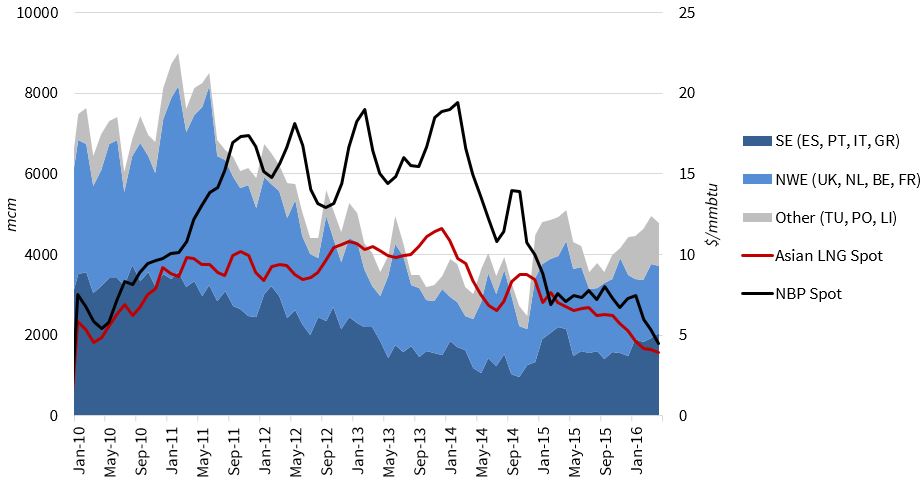
In recent years TTF has been in the ascendancy, overtaking NBP in terms of total trading volumes. TTF also now has a futures curve at least as liquid, and therefore useful for risk management, as the NBP. Brexit will likely support a continuation of that trend, particularly given the additional risk associated with GBP exchange rate volatility post Brexit.

But this does not mean that UK gas market liquidity is going to disappear. The recent move to merge the TTF hub and BBL pipeline to cut the cost of the Dutch-UK gas flow illustrates that both hub areas are deemed to be important. It also demonstrates that the view that the UK will be ‘cut off’ from the Continent post Brexit does not seem to be shared by key players. This is reinforced by the UK’s role as a desirable destination for LNG cargoes given substantial regas capacity and liquid market access.

Instead of disappearing, the UK NBP is evolving into a ‘satellite’ hub to TTF. European gas prices are anchored by the TTF hub in EUR terms. NBP prices then reflect any EUR-GBP exchange rate movements (which create additional NBP volatility) as well as the variable transport cost differential to TTF. Major NBP and TTF divergence typically only takes place during periods of interconnection constraints. It is market forces that will dominate the evolution of NBP and TTF, not Brexit related regulatory intervention.

Article written by David Stokes & Olly Spinks

European midstream gas infrastructure in focus

Midstream gas assets are coming back into focus after a lull across the first half of this decade. A 20% decline in European gas demand between 2010 and 2015, caused a pronounced erosion of midstream asset utilisation and capacity value. But the sands are shifting as European gas supply dynamics change and demand continues to recover.

Midstream asset transaction momentum is starting to build again. Last year saw EPH sell a 30% stake in its key Slovakian transit pipeline & storage business, with Global Infrastructure Partners selling its 45% stake in the Transitgas pipeline into Italy. EDF, Uniper & Edison are currently in the process of selling equity stakes in French and Italian regas terminals. The gas storage market is also coming to life, particularly in the UK given the permanent closure of Rough.

In the more than 20 years we have been working in European energy markets we cannot remember a time of greater divergence in views on gas market evolution. This lack of consensus on supply mix, flow patterns, midstream asset utilisation and capacity value is an environment of opportunity for investors. But how do you think about midstream asset value?

Europe in a state of transition

The key force acting on the supply side of the European gas market is rising import dependency. This is reflected in increasing Russian import volumes in 2016-17, accompanied by an ongoing shift in flow patterns as Gazprom favours the Nordstream (Baltic) routing over Ukraine. European LNG imports and regas terminal utilisation have also risen to their highest level in five years.

The fact that Russian and LNG imports are rising together reflects growth in European gas demand, with a 27  bcma (5.4%) increase in 2016. 20 bcma of this was driven by higher power sector demand as coal plants were switched for CCGTs. The evidence so far in 2017 points to a continuation of that trend.

Even the substantial overhang of gas supply flexibility is starting to abate. Centrica Storage has now announced permanent closure of its large UK Rough storage facility (more than 70% of UK working gas volume). Further storage closures and capacity reductions are looming on the Continent. And European upstream flexibility is declining as field production matures (particularly given rapidly lowered volumes from the Dutch Groningen field).

Midstream infrastructure map

A map is a good place to start when considering the impact of this European gas market transition on  midstream gas infrastructure. Diagram 1 shows the key supply routes into the main European market hubs. Volumes of storage capacity and LNG regas terminal capacity are also shown.

Diagram 1: Summary of key European midstream infrastructure

The structural trend behind the transformation of the European gas market, is a terminal decline in production, which is projected to fall from 246 bcma in 2016 to 165 bcma by 2025 (volumes including Norway). This widening gap is driving an increase in European import dependency.

Europe’s sources of imported supply can be grouped into four categories:

  1. Russia: Europe’s dominant existing supplier with around 150 bcma of long term contracted ‘take or pay’ volumes, and a further 100 bcma of ‘shut in’ West Siberian gas production that could support additional sales to Europe.
  2. LNG: Europe has ample regas capacity headroom and there is more than 150 bcma of new global liquefaction capacity under construction, but European LNG import volumes will strongly depend on demand growth in Asia.
  3. Norway: Norwegian production is managed to an annual target (~110 bcma), which is set to decline into next decade as existing fields mature.
  4. Mediterranean: North African supply from Algeria and Libya is set to decline into next decade, partially offset by limited growth in imports of Azerbaijani gas into Italy via Southstream.

In a nutshell, the next stage of evolution of the European gas market comes down to a battle between Russian and LNG imports. In our briefing pack on midstream assets we set out two scenarios contrasting ‘LNG Dominance’ vs ‘Russian Dominance’. The volumes and routing of Russian vs LNG imports is set to be the key factor driving midstream asset utilisation and capacity value into next decade.

5 drivers of midstream asset value

One of Timera Energy’s key areas of engagement is advising ‘buy side’ investors on the value of pipelines, regas terminals and storage assets. In doing this we aim to understand and quantify the impact of 5 key drivers of asset value. These are summarised in the table below along with examples. Extrinsic value of UK regas & storage capacity set to rise with spot price volatility given Rough closure

Table 1: 5 drivers of European midstream asset value:

Driver Dynamics Example
1. Utilisation Evolution of supply volumes, routes and flow patterns drive capacity utilisation LNG import growth will drive regas utilisation and pipeline flow volumes in UK, Netherlands & France
2. Constraints Physical and contractual constraints drive capacity value premia Value premia from contractual pipe constraints into Italy and physical Spain/France pipe constraints
3. Flexibility value Interaction between physical asset flex and market price signals drives asset extrinsic value Extrinsic value of UK regas & storage capacity set to rise with spot price volatility given Rough closure
4. Liquidity access Access to liquid hub price signals drives ability to monetise capacity value Dutch & UK storage assets have clean access to liquid forward curves vs e.g. Czech & Slovak assets
5. Regulation Regulations on access, tariff structure and security of supply impact capacity value Regulated tariffs drive competitive variable cost dynamics impacting regas & pipeline utilisation

Source: Timera Energy

There are of course other important considerations driving midstream asset value, for example legacy long term contract position, expansion options, interaction with adjacent assets and commercial flexibility to monetise capacity value (e.g. via overselling). But if you can develop a structured view on the 5 drivers in the table and quantify their impact on asset risk/return it builds a strong investment case foundation.

Article written by David Stokes & Olly Spinks

Client briefing: European midstream gas

A Timera Energy client briefing pack on midstream assets can be downloaded here:

European midstream gas: Asset value drivers & market evolution


Europe providing global gas supply flexibility

Asia dominates global LNG demand. The US and Australia are challenging the Middle East for domination of global LNG supply. But it is Europe that has become the LNG market ‘swing provider’.

Chart 1 shows a view of the evolution of European LNG imports this decade. This illustrates Europe’s role as swing provider under different prevailing market conditions:

  1. Tight LNG market: Under conditions of global tightness, the European gas market diverts flexible LNG supply to meet shortfalls in Asia and other regions (e.g. post-Fukushima 2011-14)
  2. Oversupplied LNG market: Under conditions of oversupply, European hubs absorb surplus LNG (e.g. 2015-2017).

Chart 1: European LNG imports

Source: Timera Energy

In today’s article we explore 5 drivers of Europe’s role as a provider of global supply flexibility:

1.  Price responsive demand 

Unlike Asia, European gas demand is directly responsive to changes in market prices. The mechanism driving this demand elasticity is switching of CCGTs for coal plants in the power sector, driven by spot fuel prices. As gas prices fall the competitiveness and hence load factors of CCGT plants increases (and vice versa). This key demand side flexibility mechanism allows Europe to efficiently absorb LNG in periods of surplus and divert LNG supply in periods of tightness, e.g. the 20 bcma of additional gas absorbed by the European power sector in 2016.

2.  Price responsive supply 

The European gas market also exhibits supply elasticity. Flexibility is supported by swing volumes above take or pay levels on long term pipeline contracts (particularly for Russian gas). In addition Norway has significant upstream production flexibility that is profiled on a seasonal basis, with daily flows managed by Statoil against spot price signals. In contrast to Asia, Europe also has substantial volumes of underground gas storage capacity that is also optimised against hub prices. These supply flexibility mechanisms combine to facilitate substantial ebbs and flows of European LNG import volumes.

3.  Liquid hub price signals 

The price responsiveness of European gas supply and demand is underpinned by trading hub liquidity. This provides robust spot price signals against which LNG cargoes can be monetised. Hubs also support the forward hedging of LNG exposures facilitating portfolio and supply chain management. This is why the North West European hubs (NBP and TTF) currently form the key global benchmark against which LNG cargoes, contracts and tenders are priced.

4.  Regas capacity headroom 

European flexibility to absorb large swings in LNG volumes is also a function of adequate import infrastructure. European regas capacity is rarely constrained, although this situation may change with LNG’s growing role in the supply mix. Access to regas capacity connected to liquid hubs via UK, Dutch, Belgian and French terminals is particularly important in servicing shorter term flexibility requirements. But there is further headroom beyond this given the key security of supply role played by regas infrastructure, for example on the Iberian Peninsula.

5. Flexible portfolios

Last but not least is the impact of the portfolio construction of European gas companies. There are a number of large European gas players whose portfolios span both the global LNG and European gas market supply chains, e.g. Shell, BP, ENI, Total, Engie, Statoil, Uniper and RWE. The internal optimisation of gas within these portfolios provides a substantial additional source of supply flexibility. The exercise of this internal portfolio flexibility, such as the re-routing of flows and swapping of cargoes, is highly responsive to spot price signals even though it often does not involve direct transactions visible in the market.

European LNG imports are set to grow significantly into next decade as domestic production declines. But there is inherent price responsive flexibility in the European gas market to service large swings in import volumes. As LNG imports grow, so too will Europe’s ability to export LNG supply flexibility to the global market. This will underpin the role of European hub prices as the reference for Asian spot LNG prices in a world where growing, flexible LNG flows intensify inter-regional arbitrage opportunities.

Article written by David Stokes, Olly Spinks & Howard Rogers


Options confronting gas storage owners

Seasonal storage operators across Europe are confronting a harsh reality. Many slower cycling seasonal storage facilities are not economically viable at current seasonal price spread levels.

The seasonal price spread at the key Dutch TTF hub has fallen from levels above 10 €/MWh a decade ago to below 2 €/MWh over the last 5 years. This has left storage operators struggling to cover fixed costs, let alone to earn any return on capital.

2016 saw some recovery in spot price volatility, the other key market price signal for gas storage assets. A recovery in spot volatility is good news for faster cycling storage assets designed to respond to shorter term price fluctuations.

But seasonal price spreads remain in the doldrums, suggesting a continuing surplus of seasonal supply flexibility, despite the loss of Rough flexibility and reductions in Groningen production. This can be seen in Chart 1 showing the evolution of the front year TTF seasonal price spread.

Chart 1: TTF seasonal price spread (2008-17)

Source: Timera Energy

Ongoing weakness in seasonal spreads has caused operators, including Uniper, RWE, OMV & Engie, to suffer impairment charges relating to seasonal storage assets. Many European operators are now in the process of strategic reviews to decide on the future of storage assets. We consider the strategic options that they face in today’s article.

Summary of strategic options

The level of seasonal price spreads is only one of a number of factors driving storage asset economics. The level of fixed and variable cycling costs are a key determinant of asset returns and competitiveness versus other facilities . Long term contract positions  can insulate owners from the pain of lower price spreads, but can on the other hand result in long term obligations to service customers. Ability to access cushion gas value is also a key consideration.

We summarise the main strategic options confronting owners of seasonal storage assets in Table 1.

Table 1: Strategic options

  Option description Cashflow implications
1.    Remain open
  • Minimise fixed costs to try and preserve margin
  • Wait for recovery in market price signals for flexibility
  • Negative or weak cashflow until market recovery
  • Retain option to access to future asset cashflow upside
2.    Close
  • Close asset & blowdown
  • Withdraw cushion gas and sell at current hub prices
  • Stem negative cashflow & losses
  • Move forward cashflow from CG sale (time value of money)
3.    Mothball
  • Avoid fixed costs by mothballing
  • Retain option to re-open if market price signals recover
  • Stem negative cashflow & losses
  • Inability to access cushion gas value, but retain potential upside
4.    Sell asset
  • Aim to sell asset at a premium to value of cushion gas withdrawal
  • Stem negative cashflow & losses.
  • Monetise cushion gas value & aim to realise a value premium

Source: Timera Energy

Many owners (and their shareholders) are losing patience with Option 1. This in our view is going to precipitate a growing shift towards Options 2, 3 and 4.

Transmission charges, which vary from country to country, form a significant portion of fixed opex of gas storage assets.  Moves to harmonise gas transmission charging methodologies and potential discounts for storage assets may help reduce fixed costs faced by storage operators.

Relative economics of closing vs hanging on

It is useful to look at some high level numbers on seasonal storage asset economics to appreciate the challenges facing owners. In order to do this we focus on the key option to remain open (1) or to close and withdraw cushion gas (2). The other options to mothball or sell (3 or 4) are variations on these.

Chart 1 shows a breakdown of NPV economics of a generic seasonal storage facility under three scenarios:

  1. Remain open assuming no market recovery, with seasonal price spreads and volatility staying at current levels (1.35 €/MWh TTF spreads; 50% TTF spot price volatility)
  2. Close and withdraw cushion gas, with cushion gas assumed to be sold at current forward curve prices over a 5 year extraction horizon (this will in practice vary by asset)
  3. Remain open assuming some market recovery, with seasonal spreads recovering to a long run average of 3.00 €/MWh

Chart 1: Scenario lifetime economics of a generic seasonal storage asset

Source: Timera Energy

Key assumptions:

  • Cycling time: 180 days (90 in/out)
  • Cushion gas: 100% of WGV, 3 year drawdown (sold at long run price of 20 €/MWh)
  • Fixed opex (including transport capacity): 1.5 €/MWh of WGV
  • Extrinsic value premium: 25% above extrinsic (50% for market recovery scenario)
  • Remaining economic life: 15 years for remain open cases

Scenario 1 illustrates how the economics of a generic seasonal storage asset are marginal at current spread levels (NPV of only 5 € per MWh of working volume). Less advantaged assets may actually be NPV negative, assuming no market recovery.

Scenario 2 (NPV of 16 € per MWh of working volume) illustrates the incremental value of closing and monetising cushion gas value vs Scenario 1.

Scenario 3 (NPV of only 22 € per MWh of working volume) illustrates the potential value upside from a recovery in seasonal spreads, back to a long run average of 3.00 €/MWh by 2020.

This recovery upside represents a relative small incremental gain compared to closing and selling cushion gas, bar any regulatory relief via fixed transmission cost reductions. It is this dynamic that is likely in our view to lead to a number of seasonal storage assets closing over the next year or two.

Storage asset sales

Aside from closing or waiting, the other option open to storage facility owners is to sell assets, an option that is currently on the table for a number of operators. Sale could either be to an investor with a more optimistic view on market recovery or with a more aggressive risk appetite.

Selling a storage asset has the attraction of allowing owner fast access to cushion gas value, without having to incur market risk across the gas withdrawal period. But asset price is clearly key to determining whether there is value for prospective buyers. The aborted sale of the RWE DEA German storage assets in 2016 illustrates the challenges of selling storage facilities in the current market environment.

The attractiveness of storage assets to potential buyers comes down to:

  • Flexibility & cycling speed: The European gas market has a greater need for the short term deliverability provided by faster cycle storage, than for seasonal flex (which can be provided by e.g. Norway, LNG imports).
  • Asset cost structure: Low variable costs mean storage is more competitive in providing flexibility. Low fixed costs reduce required revenues to hit return targets.
  • Location: Some markets/locations have strategic/insurance premiums or regulatory volume mandates associated with storage capacity that support asset value.
  • Contracts: Legacy long term contracts signed at higher price levels can help protect asset margin while buyers wait for market recovery.

There is a genuine interest in gas storage as an asset class from more adventurous infrastructure investors. But this has not been well tested in recent years due to a limited number of storage asset transactions.

Implications for the value of supply flexibility

Whether via direct closure of sale and consolidation, Europe is likely to lose a significant volume of slower cycling storage capacity over the remainder of this decade. Decisions to close less flexible and higher cost seasonal assets should help underpin the recovery in the value of faster cycling assets with a lower variable and fixed cost base.

The closure of seasonal storage assets may also help to accelerate the recovery in hub price volatility. In an environment where there is a weak seasonal spread price signal, slower cycling storage assets focus more on responding to short term price fluctuations. So closure of seasonal storage capacity reduces the volume of working gas volume competing to dampen spot price volatility. That is good news for faster cycle storage assets.

Article written by Olly Spinks & David Stokes


European gas for coal switching boundaries in 2017

The switching of gas for coal fired power plants was one of the key themes in European energy markets in 2016.  Switching drove a 20 bcma recovery in power sector gas demand last year.  This reversed the downtrend in European gas demand across the previous five years.

A year ago we looked at the relative fuel price dynamics driving switching in the UK and on the Continent, foreshadowing significant switching potential as the year progressed.  In today’s article we look at the current forward market switching boundaries, to provide an insight into how switching may evolve in 2017 and 2018.

The UK power market has switched

Switching happens first in the UK power market because of the UK carbon price floor.  This additional 18 £/t variable cost imposed on coal plant supports switching from coal to CCGT plants at higher gas price levels than in Continental European power markets.  This is illustrated by the fact that the UK accounted for almost half of additional power sector gas burn in 2016.

Chart 1 shows switching boundaries in the UK power market at current forward price levels for gas, coal and carbon.

Chart 1: UK switching boundaries

Source: Timera Energy (coal plant 36% HHV efficiency)

The chart shows whether current forward market fuel prices favour gas or coal burn.  The coloured dots represent different combinations of gas and coal prices for seasonal forward contracts over the next three seasons (Sum 17 to Sum 18).  The diagonal lines show the baseload switching boundaries for CCGT plants of different efficiencies (a 52% new plant through to a 47% 1990s plant).  In simple terms, if the dots sit below the diagonal switching lines then market prices favour gas burn.  If the dots sit above the switching boundaries they favour coal burn.

It can be seen from Chart 1 that CCGTs now have a structural variable cost advantage over coal in the UK.  This advantage is more pronounced in summer, given seasonally lower gas prices.  But it is also sustained across the winter.  With the carbon price floor in place, UK coal plant are effectively providing peaking capacity, with the influence of coal units on peak prices driving an increase in CCGT margin rents.

Summer switching potential in the German power market

Germany has the lowest power prices of the major European power markets (excluding the hydro dominated Nordpool markets). This is due to a combination of relatively low variable cost coal/lignite capacity and high renewable penetration. In this environment, CCGTs have been structurally out of merit for most of the last five years.

Germany is Europe’s toughest major market for switching.  There is no carbon price support like in the UK.  Germany is also well interconnected to allow imports of hydro flexibility from Nordpool and the Alpine markets. But most importantly, the German fleet of coal plants has relatively high efficiency levels.

Despite this, significant switching occurred in the German market in summer 2016 given seasonal weakness in hub prices.  Chart 2 shows that the German switching boundary is not too far away for current Summer 2017 fuel prices (the green dot).

Chart 2: German switching boundaries

Source: Timera Energy (coal plant 36% HHV efficiency)

It is important to note that the switching boundaries shown in Chart 2 are for older 36% efficient coal plants, the first to be displaced by CCGTs as gas prices fall relative to coal.  The efficiency of German power plants range from the 36% level up to around 45% for the newest stations built this decade.  These new coal stations require a more significant decline in gas prices (~3 €/MWh) to be displaced by newer CCGTs.

That said, the 36% German switching boundary is a useful benchmark to signal switching potential across other Continental European power markets.  If switching is taking place in Germany, it will also be happening in other key markets e.g. Italy, France and the Netherlands.

Switching over the next two years

European spot coal prices have remained stubbornly above 70 $/t this year (currently around 75 $/t), despite strong backwardation in the coal forward curve.  Gas hub prices on the other hand have been weakening into the summer as a result of unseasonably warm weather and robust LNG import volumes.

The behaviour of European gas prices across this summer will be an important barometer for 2017 power sector switching dynamics.  If gas prices continue to decline, e.g. another 1 to 2 €/MWh relative to current levels, this will likely trigger significant switching across European power markets.

The path of gas hub prices across the remainder of 2017 will be strongly driven by European LNG import volumes.  Cargo flows into Europe have been steadily rising this year as global supply grows and Asian LNG demand weakens into the summer. If LNG imports continue to rise, power sector switching will be the primary mechanism that allows European hubs to absorb more gas.

Article written by David Stokes & Olly Spinks

UK peaker investment: here comes consolidation

Competition to provide new capacity across the UK’s first three capacity auctions has been dominated by thousands of small peaking units. In contrast, only one relatively small CCGT has bid successfully (Centrica’s 0.4GW Kings Lynn plant).

3.5GW of distribution connected diesel and gas fired peakers have received 15 year capacity agreements across the 2014-16 auctions. An additional 2GW of new Demand Side Response (DSR) has been successful, mostly supported by peaking units behind the meter.

The capacity market has been designed to deliver competitively priced capacity. And the relatively low capital and fixed costs of distribution connected peaking units has seen developers substantially undercut competition from larger scale, grid connected CCGT and OCGT plants.

Peaker investment to date has been driven by a range of smaller developers. But larger players are eyeing the peaker sector which appears ripe for aggregation and consolidation. And portfolios of small scale peakers fit the risk/return profile of large infrastructure investors, unlike larger scale thermal assets which have a higher dependence on more volatile wholesale margins.

State of play in the peaker sector

There are several established medium sized players focusing on peaker investment in the UK market. At least two of these, Green Frog Power and UK Power Reserve are flagged for sale. But these initial sales processes may just be the tip of the iceberg.

There is strong infrastructure investor interest in peaker portfolios given margin protection from 15 year capacity agreements. Market entry options include acquiring an established player, aggregating smaller projects and/or growing organically via development of new capacity. All of these options are being actively pursued in a flexing of investor muscles that is yet to determine who will dominate the peaker sector going forward.

The other factor that suggests consolidation is a shift in the regulatory environment. The investment case for distribution connected peakers was dealt a blow by Ofgem earlier this year, when it indicated its intention to slash the ‘triad benefit’ that peakers earn by generating in peak periods to reduce supplier transmission charges.

In addition the UK government has indicated it intends to remove ‘double payment’ for the Capacity Market Supplier Charge (on top of the capacity price) and to constrain investment in higher emission diesel peakers.

While the more established players have been preparing for these regulatory blows, reduction of the triad benefit has hit some smaller, less experienced developers hard. A number of projects may be scrapped or consolidated within other peaker portfolios.

But despite these regulatory changes, distribution connected peakers are still a competitive source of highly flexible and low capex capacity, to support low load factor backup of intermittent renewable generation. But there are a number of challenges  investors face in getting comfortable with the peaker investment case summarised in Table 1.

Table 1: Peaker investment case considerations

Factor Consideration Getting comfortable
1. Investment model Building a scalable peaker portfolio: Acquire, aggregate or develop? Benchmark business & financing models & capability development costs.
2. Competitive dynamics Quantifying threat from alternative flex providers (CCGTs, OCGTs, DSR, batteries)? Excess Analyse competitor economics and co-dependence of margin streams
3. Capacity margin How will UK capacity pricing and the role of peakers in the capacity mix evolve? Model evolution of capacity market & supply stack (drivers of capacity price)
4. Other margin streams Projecting co-dependent margins streams (e.g. energy, balancing, STOR)? Model peaker flex value capture from energy, BM & STOR market evolution
5. Route to market Acquire/develop internal trading capability or use incentivised 3rd party market access? Benchmark market access service options vs internal trading development.

Source: Timera Energy

Quantifying peaker portfolio risk and return

A key challenge for investors looking at peaking units is getting comfortable with the evolution of the multiple margin streams that drive asset economics. These can be broadly split into four streams:

  1. Capacity margin: driven by capacity market pricing
  2. Energy margin: driven by the wholesale energy market and Balancing Mechanism evolution
  3. Balancing services margin: driven by e.g. STOR market and ancillary services pricing
  4. Embedded benefits: driven by the evolution of regulatory policy and supplier grid charges

Peaker margin streams are not simply additive e.g. a decision to provide STOR services directly impacts energy and BM margin capture. This means it is key to overlay a realistic view of how peaking units will practically generate value.

The regulatory changes described above are shifting the relative risk/return profiles of peaker margin streams. Gas reciprocating engines are now the principal technology (given diesel unit emissions). These units have higher capital costs than diesel generator sets. But they are also more efficient, meaning significantly lower variable costs.

Lower variable costs increases the opportunities for gas engines to capture value from power price volatility in the wholesale energy market and Balancing Mechanism (BM). Peaking units are extremely flexible (e.g. fast ramp times, low start costs), but quantifying this flex value requires a robust probabilistic plant modelling approach. This means using a stochastic pricing simulation engine and associated plant dispatch optimisation model. The two key advantages of this approach are:

  1. It is consistent with the way trading desks actually optimise and dispatch portfolios of peaking units
  2. It generates margin distributions (as opposed to scenario forecasts), providing a robust view of asset risk/return dynamics

The peaker investment case is still built around 15 year capacity agreements and access to balancing services revenue. But understanding wholesale energy market and BM margin are becoming a key element of gas peaker economics.

A traditional Base, High and Low scenario approach for peaker margin may have been adequate when the investment case was driven by the triad benefit and diesel engines. But gas engine investment requires a more sophisticated analytical approach.

Article written by David Stokes and Olly Spinks


Timera take on the Flame gas conference

Each May the European energy industry convenes in Amsterdam for the annual Flame gas conference. The 2016 conference was somewhat overshadowed by a focus on plunging commodity prices. In contrast, this year’s conference had a more constructive and forward looking perspective. This was driven by a focus on structural themes emerging from the early stages of a major transformation in the European energy industry.

In today’s article we set out 5 key themes that we took away from this month’s conference:

The three Ds

Decarbonisation, decentralisation and digitalisation. These three trends formed the backbone of conference discussions, reflecting their role in the energy industry transformation, being driven by both regulatory and commercial forces. Importantly, it appears that consensus is shifting towards this being an opportunity rather than a threat to the gas industry.

The nature of the ‘three D’ trends also emphasises how the evolution of the European power and gas sectors is converging. To a large extent decarbonisation, decentralisation and digitalisation has ‘first impact’ on the power sector, driving a shifting focus towards payment for capacity rather than energy. But there are profound knock on implications for gas, as a provider of flexibility to the power sector, as a source of heat, as a substitute for oil in the petrochemical industry and possibly transport.

Business models

The evolution of European utility business models is playing an integral role in the industry transformation described above. This evolution is focused on:

  1. Balance sheet repair
  2. An appetite for stable and regulated cashflows
  3. A strategic shift towards renewables, networks and customer services (driven to a significant extent by 1. & 2.)

These business model trends are consistent with the shift in regulatory policy towards the ‘three Ds’. But they also reflect a period of recovery from industry wide asset write-downs as market conditions have squeezed margins on conventional assets (e.g. thermal power and upstream & midstream gas assets).

The dominance of vertically integrated utility business models is also being eroded. This is illustrated for example by the spin-off of Uniper from E.ON, utility divestment of E&P and generation assets and the transformation of Centrica towards a customer services company. The traditional role of utilities is also being challenged by new entrants e.g. car & battery manufacturers and retail services companies such as Google and Amazon.

Diagram 1: Evolving trends with utility business models and asset investment

Source: Timera Energy

Investment

Another key theme at Flame was the growing role of funds as investors in European energy infrastructure. This reflects opportunities to both:

  • Acquire assets being divested by energy companies repairing balance sheets
  • Invest alongside energy companies to develop new assets

Timera chaired a plenary panel on Investment and Divestment that focused on the evolving roles of utilities and funds. Discussion here highlighted how different pools of fund capital were driving asset investment.

A greater willingness to take on market risk has seen private equity and sovereign wealth funds dominating investment in non-regulated assets (e.g. KKR’s acquisition of French CCGTs and ADIA backed TAQA’s investment in Bergermeer gas storage). Infrastructure funds on the other hand are being driven by a mandate to protect capital, underpinning an investment focus on regulated assets such as renewables and networks.

The panel also discussed the interesting competitive tension between infrastructure funds and utilities, given a shared appetite for stable and regulated cashflows. This is being reflected in increasingly lean returns as highlighted by Dong and EnBW’s recent ‘zero subsidy’ wind project bids.

Gas market share

In an environment of surplus gas supply, market share strategy was a dominant theme. Discussion revolved around three key players in the global gas market:

  • US LNG – the dominant source of committed new supply over the next two years and a competitive and potentially huge source of new supply in the 2020s
  • Russia – presenting an increasingly assertive stance on European market share in response to the growing threat of LNG imports, backed by large volumes of shut in production in West Siberia
  • Qatar – which in April fired a shot across the bows of LNG competitors as it lifted its production moratorium on the giant North field (we will shortly publish a specific article on the implications of this).

There are interesting strategic dynamics around market share in the nearer term. If European hub prices continue to converge more closely with US Henry Hub, Russia may be able to temporarily displace some US exports by placing more gas at European hubs. But the more important question is how these players will interact to provide the new supply required in the 2020s and how this supply will be priced. There is a lack of clear industry consensus here and it highlights a key strategic issue for further attention.

Gas market pricing

The emerging role of Europe as a key provider of LNG flexibility to the global LNG market was another important theme. This is a function of Europe’s hub price response mechanisms that allow efficient adjustments to both gas demand and supply (e.g. gas vs coal switching and flexible gas supply contract structures).

Europe’s swing provider role also underpins its influence in setting global gas prices. Timera gave a Flame presentation on this topic setting out evidence on how European hubs drive marginal LNG price signals (summarised here by ICIS Heren).

The increasing importance of US Henry Hub was also a key topic. As US export contracts ramp up, the influence of Henry Hub on LNG flow decisions will increase in significance. Convergence of European hubs with Henry Hub over the peak of the current supply glut could also see the US gas market temporarily driving global spot price signals. But for the moment that role sits with European hubs, which are also likely to dominate LNG price signals well into the 2020s.

Article written by Olly Spinks & David Stokes

Germany’s replacement of baseload capacity with wind

There was much excitement last month when EnBW and Dong bid to deliver 1.4GW of ‘zero subsidy’ offshore wind projects in the 2017 German offshore wind auction. Grid connection costs for these projects will be borne by German consumers. But the developers will need to recover the remainder of costs from wholesale power price revenue alone.

A case of return free risk? Maybe. But the auction results point to two interesting dynamics:

  1. Continuing reductions in offshore wind technology and implementation costs.
  2. Germany’s focus on wind as the main source of replacement capacity for closing nuclear and thermal power plants.

These dynamics have important implications for the German power market balance, given large volumes of scheduled thermal and nuclear capacity closures over the next 5 years. They are also important for the broader pan-European market balance, given the size of the German market and tightening reserve margins in neighbouring markets.

Looming German capacity closures

To date the German power market has absorbed new wind capacity in a relatively orderly fashion, although system stress points are starting to show. The transition to higher volumes of wind output has been helped by a large buffer of flexible gas, coal and nuclear capacity and high volumes of interconnection with neighbouring markets.

But the German power market faces a new challenge over the next five years. Not only will Germany continue to add large volumes of intermittent renewable capacity, it will also lose large volumes of flexible coal and gas and baseload nuclear capacity. And market price signals do not currently support adequate returns on existing thermal plants, let alone investment in new flexible capacity.

The plant closure issue Germany faces was highlighted recently by BDEW (the German Association of Energy and Water Industries), who are projecting 26GW of German capacity closures by 2022 as shown in Chart 1.

Chart 1: Recent and projected German conventional capacity new build and closures

Source: BDEW (translated)

While the BDEW projection may somewhat over estimate closures, the chart illustrates an important point. The German market saw a net addition of 3.3GW of flexible capacity over the last 5 years (2013-17). But it is confronting a very substantial net deficit of flexible capacity over the next 5 years (BDEW estimates 24GW of net closures), given a lean development pipeline of non-renewable capacity (1.8GW).

Capacity closures are being driven by two main factors:

  1. 11GW of regulatory driven closures of German nuclear plants by 2022.
  2. Ongoing closures of coal and gas fired plants as a result of more stringent emissions requirements and weak generation margins.

We recently showed the very low levels of prevailing spark and dark spreads in the German market. Spark spreads have been negative for more than 5 years, with dark spreads hovering near zero for the last 18 months. This has crushed returns on coal and gas fired generators, resulting in an ongoing flow of announcements by plant owners of their intention to close capacity.

So far the German electricity regulator (BNetzA) has been notified of a total of 13.3GW of thermal capacity closures. Of this volume 5.7GW has already closed. Another 7.6GW is awaiting closure, although 3.3GW of this is required to remain open for security of supply reasons (e.g. relating to constraints in the South of Germany).

The implications of swapping baseload capacity for wind

Germany has close to 55GW of installed wind capacity. Average wind farm load factors range from 20% for onshore projects to more than 40% for advantaged offshore projects. As Germany continues to rollout wind capacity, this contributes significant additional generation output on an annual average basis.

But it is periods of low wind & solar output that are important for German security of supply. System continuity depends on a buffer of adequate flexible capacity to meet peak demand in periods of low wind generation. And this is where capacity closures leave the German market exposed, a fact that is being disguised by complacency driven by a number of years of over-capacity.

Germany’s gradually increasing security of supply exposure was illustrated over the past winter when renewable contribution to the German market stagnated. For a two week period renewables contributed little more than 3GW of capacity through a period of higher winter demand. In these circumstances Germany relies heavily on imported flexibility, for example from hydro capacity in Scandinavia and the Alpine regions. This cross-border dependence means that swings in German renewable output are also forcing unwelcome stress on neighbouring transmission systems.

Investment in replacement flexible capacity?

Germany has not implemented any form of market wide capacity payment mechanism. So as renewable output grows, margins on coal and gas fired power plants will continue to be eroded by lower variable cost units setting marginal prices. In this environment it is hard to see how significant volumes of new CCGT capacity will be developed without capacity payment support.

Germany has so far instead been pursuing a capacity reserve policy The proposed approach involves network operators initially procuring and holding 2GW of reserve capacity outside the wholesale market from Winter 2018.

But last month the EU raised a number of state aid concerns relating to the German reserve scheme (e.g. it is not open to foreign capacity or DSR). The German approach is not helped by the fact that grid operators are playing an increasingly interventionist role after the day-ahead auction has cleared, causing growing divergences in real time pricing and dispatch.

In our view, pressure on thermal generation margins may precipitate a capacity crunch sooner than expected in Germany. If the regulator does not provide a clean answer, the market will. This could have a significant knock-on impact across North-West Europe as reserve margins also tighten in neighbouring markets (e.g. France and Belgium).

The UK’s experience with its Supplementary Balance Reserve (SBR) policy suggests that piecemeal capacity reserve schemes are a mistake. Germany would be better anticipating the requirement for a competitive, technology neutral, system wide capacity market, well in advance of a system capacity crunch.

Authors: David Stokes & Olly Spinks