The 2015-2020 wave of new LNG supply has been built on Australian and US export projects. Australian liquefaction projects were underwritten by long term oil-indexed contracts with Asian buyers. In contrast, US terminals were financed off the back of long term Henry Hub indexed tolling contracts that pushed US gas price risk onto LNG buyers.
Both these models now appear to be ‘broken’. In the current market environment there is little interest from Asian buyers or LNG portfolio players to sign new long term contracts on either basis.
Many Asian LNG importers are already over-contracted, particularly in Japan, China, India and South Korea. Projecting future LNG requirements is also challenging given uncertain energy demand and policy-induced changes to the energy mix.
Liquefaction project developers are also confronted by a gap between LNG spot price expectations and prices required to support the cost of investment in new supply.
Yet the LNG market needs investment commitments for new liquefaction projects to be made before the end of this decade to avoid a supply squeeze in the early to mid-2020s. This sets up an interesting dynamic around the ‘next wave’ of new LNG supply projects.
Next wave characteristics
A successful investment & business model for ‘next wave’ LNG projects is yet to be defined. But it is likely to reflect the following characteristics:
- Market risk: New supply will be dominated by projects whose investors do not require long term contracts i.e. equity investors will need to bear market risk.
- Cost of capital: Cost of capital will be key to keeping project costs down. This is likely to drive a focus on robust balance sheets and low debt costs rather than project finance.
- Reserve access: Investors looking to monetise existing upstream reserves, with infrastructure access to terminals are likely to dominate.
- Market access: An absence of long term contracts means a greater importance of LNG supply chain presence and capability to monetise cargoes directly in the market.
These factors point towards oil & gas majors and large LNG portfolio players dominating the next wave of supply .
Competition for marginal supply
Chart 1 shows our estimates for the long run marginal cost (LRMC) of key generic sources of potential new LNG supply.
Chart 1: Next wave LRMC by supply source
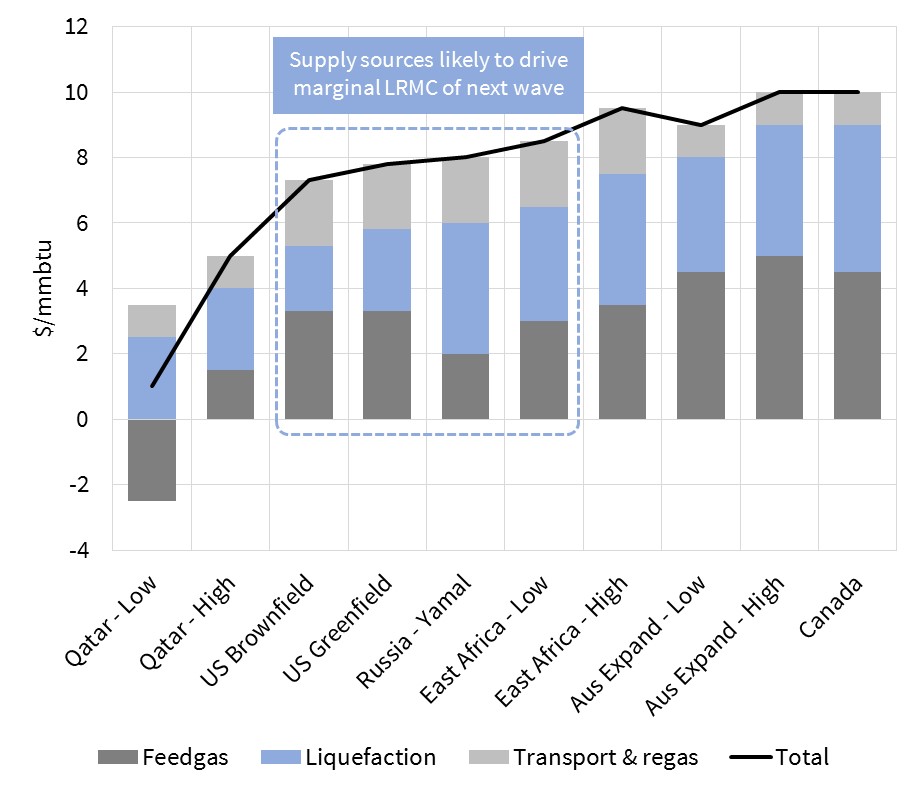
Source: Timera Energy
Qatar
Qatari expansion options are at the head of the cost curve. Qatar has announced its intention to lift the 2005 moratorium on LNG export expansion and develop 23 mtpa of new supply over the next 5-7 years. Based on reported condensate yields, we estimate delivered LRMC of 5 $/mmbtu for this LNG, assuming 1 $/mmbtu for shipping and regas costs into Europe or Asia.
However it is our understanding condensate & LPG yields could be significantly higher (e.g. based on data provided by the Qataris in the late 2000s), in which case LRMC could be lower. Qatar may also be able to increase exports via relatively low cost debottlenecking of supply into its existing trains.
There is no doubt that Qatar is the cheapest source of new global supply. But expansion volumes are not enough to meet global demand growth. That means Qatari supply sits below the expansion options likely to drive the marginal cost of new supply.
US LNG
There is a growing consensus that US unconventional gas production can meet US consumption as well as LNG export volume requirements at Henry Hub prices of around 3.00-3.50 $/mmbtu. We have assumed a 3.00 $/mmbtu cost base for Chart 1.
US export contracts signed to date have included a 15% variable liquefaction fee. But this has included some margin for terminal owners. The true variable costs of liquefaction (e.g. costs of gas consumed) are closer to 10% (i.e. $0.30 at $3.00 Henry Hub).
The liquefaction tolling fee in existing contracts was $2.50 in early contracts, rising to $3.50/mmbtu in later contracts. But there is mounting anecdotal evidence that fixed and capital costs for the next wave of terminals may come in under even the lower end of this range. Costs can be driven down by standardising terminal design rather than pursuing the specific site designs deployed to date. We assume 2.00 $/mmbtu for brownfield sites and $2.50 for greenfield sites.
We then assumed long run marginal shipping and regas costs of 2.00 $/mmbtu to deliver gas to Asia. That gives all in LRMC estimates (delivered into Asia) of:
- Brownfield: 7.30 $/mmbtu
- Greenfield: 7.80 $/mmbtu
Second wave US export projects look to be an increasingly competitive source of new supply. But ownership structures and business models may need to evolve to support new FIDs.
Russia
New Russian LNG supply also looks relatively cost competitive. But supply is likely to be limited to two projects.
Yamal LNG benefits from large onshore arctic fields (Russia’s core expertise). Yamal LNG comprises three trains each of 5.5 mtpa, the first of which comes onstream late 2017/early 2018. Arctic LNG (also known as Artic LNG II) may reportedly be able to supply up to 18 mtpa.
Russian state infrastructure funding and good project executions would support a delivered breakeven cost or around 8.0 $/mmbtu.
East Africa
There have been huge (dry gas) discoveries in East Africa. But progress to achieve development frameworks for investment have been hampered by government capability and opposition opportunism. The offshore Coral LNG project (Eni, Anadarko) is moving towards construction. However the likelihood and timing of other land based liquefaction projects are less certain.
Our estimates of delivered cost into Asia for an efficiently executed project is $8.5/mmbtu. This may increase to $9.5/mmbtu if additional infrastructure spend is required (or cost overruns).
Australia Brownfield
With cost reductions by competitors, new Australian supply projects are looking increasingly compromised. Further east coast export options are constrained by a shortage of feedgas. West coast and northern options suffer from expensive labour costs and/or incremental infrastructure requirements.
We estimate generic feedgas costs at 4.5 – 5.0 $/mmbtu, with a further $3.4 – 4.0 of liquefaction costs. Add on transport to Asia and project breakevens look to be in the 9-10 $/mmbtu range.
Canada
The economics of Canadian LNG projects are eroded by the relative distance of gas supply from export terminal access. Costs are also impacted by the complication of gaining ‘First Nation’ and environmental approval for pipeline corridors and navigation of an overlapping approval, regulatory and fiscal system. In addition the availability of sufficient skilled labour for liquefaction project construction is questionable which adds to the risk of cost escalation.
We estimate feedgas costs including transportation to the terminal at 4.5 $/mmbtu and greenfield liquefaction costs of another 4.5 $/mmbtu. That means a delivered cost into Asia of 10 $/mmbtu.
Summary of new supply options
The analysis above relates to breakeven costs for generic projects by location. There are also a number of specific projects likely to benefit from unique characteristics that give them a cost advantage.
For example:
- Offshore FLNG projects, if they are able to realise cost and schedule advantages, such as the Coral (Mozambique) and Fortuna (Equatorial Guinea) currently in the process of FID.
- Exxon’s PNG expansion option benefitting from existing infrastructure and an impressive implementation track record.
- Other projects with LPG and Condensate co-production which can significantly improve economics from those in Chart 1.
However we have focused on large generic sources of new supply as the key driver of the marginal cost of new LNG going forward. The cost structure of these supply sources will have an important influence on LNG pricing dynamics next decade.
In summary, Qatari volumes are cheap but limited. Incremental supply from the US (high volumes) and Russia (more restricted volumes) look most competitive. Advantaged East African projects look to be the ‘best of the rest’ of the major sources of new supply.