USD points to higher commodity prices

Two big years for energy prices

Global commodity prices started a major recovery in Q1 2016.  Energy markets played a core role in this recovery.  Brent crude doubled in price from 27 $/bbl in Jan 2016 to 54 $/bbl by year end.  European coal prices also doubled across 2016 to finish the year at 78 $/t.

Energy prices continued to rise in 2017 with crude up another 23% (to 67 $/bbl) and coal prices up 21% (to 95 $/t) by year end.  Gas prices also rose significantly in Europe and Asia, despite healthy volumes of new supply.

Entering 2018, prices rises in energy markets are starting to look stretched from a fundamental perspective.  Spot oil and coal prices are above consensus benchmarks for the long run marginal cost (LRMC) of new supply.  And gas markets will need to absorb large volumes of committed new supply coming online across 2018-20.

So what are the chances of commodity prices continuing to rise in 2018?

The USD suggests there is more to come

Jan 2018 has seen an important shift in currency markets. The US dollar has declined sharply against other major currencies, breaking out of its three year trading range (from 2015-17). A falling USD may have important implications for energy markets, given the strong negative correlation between the USD and commodity prices.

The USD has historically been an excellent barometer for major commodity price moves. This is illustrated by the inverse relationship between the USD index and crude prices shown in Chart 1.

Correlation does not necessarily imply causation and the drivers behind this inverse relationship are complex.  But the historical consistency of the inverse USD vs commodity price correlation means it is worth watching closely.

Chart 1: USD index (top panel) vs front month WTI crude price (bottom panel)

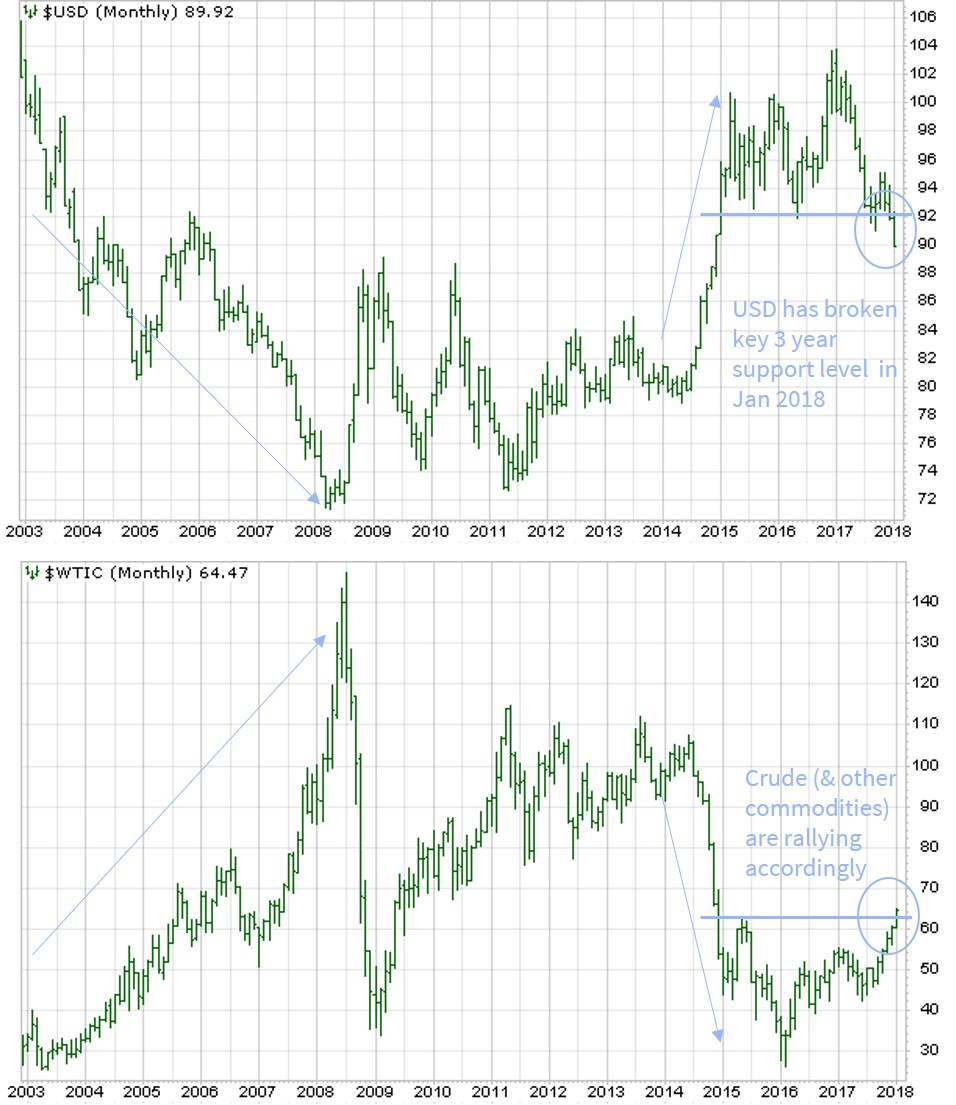
Source: Timera Energy, stockcharts.com

The USD decline is being driven by shifting investor expectations of monetary policy and capital flows. European currencies (EUR, GBP) are rising against the USD, in response to a stronger economic growth outlook and rising inflation expectations.  These factors may force European central banks to start to normalise historically loose monetary policies.  Capital is also flowing out of the US (weighing on the USD) as economic growth strengthens in Europe, Asia and South America.

Economic growth supports the story

So if a declining USD points to higher commodity prices, is this consistent with the fundamental drivers of commodity markets?

The catch phrase of 2017 was ‘synchronised global growth’. This is illustrated by a wall of green blocks in the 2017 columns of Chart 2 and it is driving higher commodity demand.  The last time this synchronisation occurred was back in 2009-10, a period of rapidly rising commodity prices (see Chart 1).

Chart 2: Quarter on quarter GDP growth across major global economies

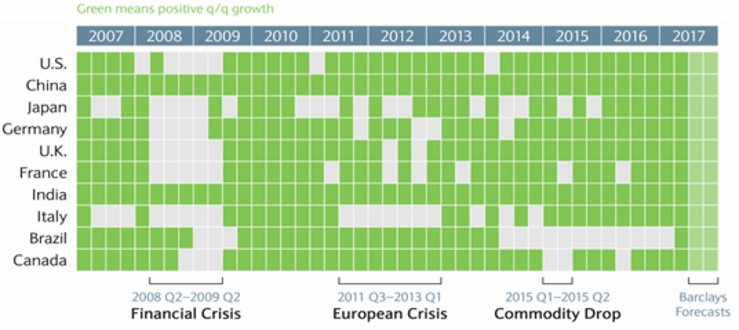
Source: Doubleline Capital, Haver Analytics, Barclays Research

2017 was dominated by a falling USD and rising commodity prices.  So far markets are pointing to a continuation of this trend in 2018.

Commodity markets are notoriously vulnerable to the effects of inelastic short term supply curves. Commodity demand tends to rise more quickly than the ability of supply to respond.  Prices rise rapidly as a result until new supply can be brought online.  This can lead to curve backwardation and prices rising above the LRMC of new supply.

There is evidence of this dynamic currently in the coal, oil and LNG markets (although there are more temporary seasonal drivers for LNG). Strong Chinese demand is an important factor for all three markets. If the pace of demand growth continues to outstrip supply response this year, commodity prices may continue their upward trend in 2018.

Hub pricing is already winning in Asia

Have you heard the following arguments?

The Asian LNG market cannot transition to hub pricing because:

  1. Existing Asian LNG supply contracts are almost all indexed to oil
  2. Asia does not have a reliable established trading hub to support gas on gas trading

The same arguments were made in Continental Europe 15 years ago and the UK in the 1990s. And they were wrong.

Gas on gas competition will evolve differently in Asia to Europe.  But there is already a quiet revolution underway supporting the growing influence of hub pricing in the Asian LNG market.

Asian portfolio evolution and a ramp up in US export volumes is driving an increase in spot and shorter term contracting of LNG.  Market liquidity is being reinforced by growth in the activity of commodity trader intermediaries.

European hubs are already the key reference price benchmark for shorter term LNG deals in Asia. But a more active Asian spot market is evolving with price formation based on prevailing regional market fundamentals. As liquidity is improving it is paving the way for a truly Asian price signal.

In today’s article we look at three drivers that will continue to support the increasing influence of hub pricing in Asia.

Asian portfolio evolution

The need to clear portfolio imbalances is a primary driver of spot trading. There are some pronounced imbalances in Asian LNG portfolios over the next 5 years.  Japanese and Korean utilities are over-contracted, driving short term contracting to reduce portfolio length.

On the other hand, many emerging Asian buyers are under contracted with a requirement to make up volumes via shorter term purchases. In addition, low volumes of domestic storage create a requirement for balancing via short term LNG purchases e.g. in China.

The rapid pace of ramp up in new global LNG supply from 2018-20 also supports increasing shorter term liquidity.

These factors are combining to create a growing structural requirement to transact cargoes which is helping boost the relevance of regional spot price markers.

LNG trading growth

Portfolio imbalances are providing a clear motivation for Asian LNG players to develop stronger trading & optimisation capabilities.  This is reinforced by the requirement to hedge and optimise US export contract volumes against prevailing market prices. Japanese utilities in particular have been active over the last 12 months in expanding their trading presence in both Asia and Europe.

The other shot in the arm for traded market liquidity is coming from commodity traders.  Companies such as Trafigura, Vitol, Glencore & Gunvor are applying expertise developed in the oil market to support expansion of their LNG midstream & trading presence.

As intermediaries, the business model of commodity traders strongly relies on hub price signals. By transacting between producers and buyers they are boosting both hub price penetration and LNG market liquidity.

The evolving dynamics around LNG traded market growth are summarised in Chart 1.

Chart 1: LNG market dynamics


Source: Timera Energy

Hub price penetration

European hubs already act as a strong marginal price signal for the LNG market.  The prices of short to medium term LNG contracts are typically priced at a basis to the TTF/NBP hub price alternative.  This is reflected in the clear relationship between Asian spot prices and TTF shown in Chart 2.

Chart 2: Global gas price benchmarks


Source: Timera Energy, SGX, ICE

LNG supply contracts which have delivery flexibility are being optimised against spot price signals.  And rapid growth in US export contract volumes will reinforce this, with forward exposures hedged against TTF/NBP and delivery optimised against regional spot prices.

Prices are increasingly being influenced by short term supply and demand conditions. The divergence between Asian LNG spot prices and European gas hub price levels in winters 2016/17 and 2017/18 is a good example.  This has been a function of high Asian winter demand (particularly in China). But it underlines the need for an Asian reference price, to provide:

  1. A signal for the market-led disposition of cargoes between Europe and Asia and
  2. A pricing basis for short to medium term transactions.

The development of a ‘triangle’ of price references – Henry Hub, European hubs and Asian spot LNG – provides the necessary guidance for market development as LNG volumes ramp up.

The factors above are driving a virtuous cycle supporting the strengthening influence of hub price signals on the Asian LNG market.  Hub price penetration will not wait for the end of oil-indexed contracts and an established Asian hub. It is here already.

Briefing pack: LNG market transformation
A Timera Energy briefing pack on ‘How the next 5 years will transform the LNG market’ can be downloaded here: LNG market transformation


UK capacity auctions set up stack transition

The UK power market is preparing for two capacity auctions in Q1 2018.  There is no shortage of competition to provide capacity.  The outcome of these auctions will be key to determining how the capacity mix will evolve over the next 5 years.

In today’s article we look at auction dynamics.  We also consider what a changing capacity mix means for the supply stack, price formation and prompt margin capture of flexible assets.

Capacity market balance & pricing

This month’s T-1 auction for the 2018/19 capacity year looks very well supplied against a demand target of only 4.9GW. This points to a single digit clearing price, potentially low single digits.

The auction will be fought out at the margin between the older CCGTs (e.g. Peterborough & Corby) and 36% efficient coal units (e.g. Fiddler’s Ferry, West Burton) that missed out in the 18/19 T-4 auction.  Bidding will be driven by complex end of asset life economics. At least 2 or 3 large grid connected units are likely to miss out and may close as a result.

The Feb 18 T-4 auction for the 2021/22 also features a large surplus of existing and prequalified capacity over the 49.5GW demand target.  Key drivers to watch for in this auction are:

  1. Older existing thermal How much existing capacity is knocked out by cheaper new build, with a specific focus on the older 36% coal units with 35+ £/kW fixed costs and very low forward energy margin.
  2. New gas engines The volume of gas engines that manage to bid below 25 £/kW, despite a substantial reduction in triad avoidance revenue. A number of engine developers look to be under-pricing the risk associated with wholesale and BM margins in a chase for volume.
  3. New CCGTs Further efficiency increases with latest generation CCGT technology help with wholesale energy margin capture. This could lead to new CCGT projects bidding under 25 £/kW.  Damhead Creek 2 looks to be the most advantaged project given its location.
  4. Batteries Large volumes of prospective battery projects will not necessarily translate into large cleared volumes in the auction. Developers of short duration batteries were dealt a heavy blow in Dec 17 with derating factor reductions (18% for 30 min, 36% for 60 min). Frequency response revenues are also at risk given the rapid scale up in battery volumes.

Marginal price setting in the T-4 auction is likely to be dominated by competition between new gas engines, new CCGTs and older coal units.  Unit economics suggest bids converging around the 25 £/kW level.  But growing investor enthusiasm, and in some cases under-pricing of risk, is driving down project cost of capital. This opens up the risk of another downside price surprise e.g. to 20 £/kW.

Supply stack transition & peak pricing

The UK supply stack is set to rapidly evolve over the next 5 years as older coal and gas units are replaced by renewables, interconnectors, gas engines and batteries.  Chart 1 shows a simplified view of the 2021/22 supply stack.


Source: Timera Energy

Some observations:

  • Renewables with low variable costs are being pushed into the bottom left of the stack, with offshore wind particularly important. This capacity is dominating the provision of new energy but also significantly increasing system intermittency.
  • Thermal closures are causing the removal of flexible capacity from the middle to right hand side of the stack. The pace of closure of the remaining 11GW of coal units will be particularly important as will the volume of older CCGTs that close or are converted to run as OCGTs.
  • Gas engines and short duration batteries with high variable costs are being pushed into the top right hand side of the stack. These units are dominating the provision of new flexible capacity. But they have higher variable costs (e.g. 70+ £/MWh for 35% efficient gas engines) than the coal & CCGT units they are replacing which will drag up system prices when they are required to run.

So while the capacity market is currently well supplied, the energy market is likely to see increasing peak price shape & volatility over the next 5 years.  A growth in renewable output is gradually eroding the load factors of CCGTs.  But rising peak prices and volatility have a positive impact on CCGT margins.

Prompt and Balancing Mechanism returns

A higher volume of system intermittency is going to manifest itself in higher prompt price and Balancing Mechanism volatility.  Marginal prices may swing from low or negative levels in periods of low net system demand, to being set by 70-90 £/MWh peaker costs when there is high net system demand. This is going to significantly increase the emphasis for flexible asset owners on optimisation of unit flexibility against prompt prices.

Ofgem’s cash out price reforms are also set to drive more volatile cashout price behaviour.  Gas engine owners are targeting this volatility by ‘chasing’ cashout prices i.e. spilling when the system is short and turning off when the system is long.  Developer enthusiasm about returns from this strategy does not always properly account for:

  • The risk associated with forecasting cashout prices i.e. getting it wrong costs you money.
  • The impact of large volumes of new gas engines and batteries in dampening the impact of rising cash out price volatility.

Some engine and battery developers are ‘pricing for perfection’ i.e. assuming that BM returns will only improve. This may be setting up some painful writedowns in the 2020s.

The other interesting dynamic looming on the horizon is longer duration energy storage.  The economics of 4-6 hr duration batteries do not yet support large scale rollout.  But the pace of battery cost declines suggests that load shifting arbitrage will start to feature from the mid 2020s. The combination of grid scale and distribution connected storage arbitrage may be a game changer.

Briefing pack: UK power capacity mix transition and asset value

We have just published a briefing pack on the implications of the UK capacity mix transition for flexible asset value. This pack can be downloaded here: UK power: capacity mix transition driving flexible asset value“.


5 energy market surprises for 2018

Welcome back to our first feature article of the year.  We kick-off the year with a set of 5 potential surprises to watch for on the radar screen in 2018.  Usual caveat – these are surprises to take into consideration, not predictions to anticipate.

1. A setback for LNG prices?

Commodity price strength may continue to surprise in 2018.  In particular, oil looks to have broken out of its 40 – 60 $/bbl trading range of the last two years.  Commodity demand is being driven by China but also supported by healthy economic & manufacturing growth across most global economies.

Asian spot LNG prices have doubled across the last 6 months, rising above 11 $/mmbtu.  Behind this was a surge in Chinese LNG demand to 37 mtpa in 2017, up 40% year on year. A number of factors have aligned to support Chinese demand including a strong policy shift to gas, rising coal prices, colder Q4 weather, strong economic growth and lower H1 spot LNG prices.

So it seems reasonable to assume LNG prices will continue to strengthen in 2018… doesn’t it?  We’re not so sure. There is a risk that momentum behind the drivers of Chinese demand growth weakens in 2018.  This is particularly the case if China’s 2017 policy shift to gas captured much of the ‘low hanging fruit’ from residential heating & industrial production.

As new supply continues to ramp up from Australian and US producers, a slower pace of Chinese demand growth could erode the LNG market tightening trend of H2 2017.  That may support the re-convergence of Asian and European spot prices.

2. Blockchain transformation takes off

We wish you good luck if you want to convert your savings into bitcoin in 2018.  But the blockchain technology behind bitcoin could radically change energy markets. 2018 may be the year the blockchain moves from the fringe to the centre of energy industry debate.

Blockchain is a technology that supports ‘peer to peer’ transactions.  It is supported by the distributed storage of data across multiple users. As such, blockchain fundamentally challenges the conventional approach of centralised data storage e.g. via an exchange, a payment system or a grid operator.  It also facilitates real-time multilateral trading at very low cost.

The energy industry is enormously data intensive.  This provides powerful incentives to adopt blockchain technology, for example:

  • Transaction costs: Blockchain efficiency has the potential to crush energy transaction costs. With an eye on this, BP & Shell are leading a push to set up a blockchain based energy trading platform by the end of 2018.
  • Security: Cyberterrorism is rapidly becoming a key threat to energy systems, whether physical (e.g. grids) or financial (e.g. exchanges). Blockchain is effectively un-hackable and removes the risk of attack on a central data repository.
  • Connectivity: Blockchain supports a much broader range of decentralised energy transactions, e.g. facilitating the purchase & sale of electricity from distributed solar & wind and EV charging.
  • Disintermediation: The flexibility and transparency of blockchain encourages direct peer-to-peer dealings. Blockchain’s responsiveness and efficiency in doing this breaks down barriers for fully optimising smart grids, demand side response & distributed generation.

3. Reality check for UK batteries & engines

There has been enormous momentum behind investment in UK distribution connected reciprocating engines and batteries in 2016-17.  This been supported by a rapidly evolving requirement for flexible capacity as well as falling costs of capital and technology.

While battery cost reductions continue at pace, they are last year’s story.  The focus for battery developers in 2018 may shift from costs to revenues, as short duration lithium-ion batteries start to become a victim of their own success.

Frequency response revenues present the biggest risk for battery economics.  More than 500MW of batteries already have capacity agreements. At least as much again are likely to receive agreements in this year’s auction. 2018 may be the year when UK frequency response prices start to buckle under the weight of new battery supply.  Battery capacity market revenue was also dealt a blow in Dec 17 with more penal derating factors.

Competitive pressure may also rise for UK gas engine developers in 2018. Business model focus has shifted to wholesale market and balancing mechanism (BM) revenues, given the rapid decline in triad revenue by 2020.  But 4-5 GW of new peaking capacity over the next 3 years raises the risk of a surprise erosion in prompt energy & BM margin.

4. Big step towards global hub based gas market

Legacy long term gas contract positions will ensure that oil-indexation remains in Europe and Asia for many years to come.  But the relevance of oil-indexation is being rapidly overrun by the penetration of hub prices. This is creating greater spot price signal connectivity across the world’s regional gas markets as illustrated in Chart 1.

Chart 1: Global LNG price benchmarks


Source: Timera Energy, SGX, ICE

Gazprom’s change in strategic tack in response to the 2017 EU antitrust case is the last key hurdle on the way to hub dominance in the European gas market. Gazprom is allowing ‘TTF corridor’ price concessions on oil-indexed contracts as well as more actively managing the delivery of its gas at hubs. This transformation has helped Gazprom to grow its European exports, from levels averaging around 150 bcma across the first half of this decade, to almost 185 bcma in 2017. Gazprom’s willingness to recognise hub prices may surprise again in 2018.

Hub price signals are also transforming the LNG market as it transitions towards shorter term contracting and spot price optimisation. This is reinforced by a ramp up in flexible US export volumes that are being optimised against spot price signals.  These factors may support a step change in hub price penetration and trading liquidity in the LNG market in 2018.

5. Fund acquisition momentum builds

In a record low interest rate environment, infrastructure assets have become a key target for both dedicated infrastructure and private equity funds. The average infrastructure fund size has roughly tripled over the last 5 years, with 2017 seeing record capital raising for infrastructure.  2018 may be the year that fund acquisition of European energy assets causes some big surprises.

Big US and Asian funds are converging on European energy markets to compete for assets with the local players.  Decentralisation, decarbonisation and digitisation are strong catalysts for restructuring of utilities, assets sales and aggregation of smaller players.  Private equity capital is particularly targeting the more complex risk profiles of thermal power and unregulated midstream gas assets.

Transaction momentum may be helped by the restructuring or breakup of incumbent utilities. Fortum’s bid for Uniper may act as a catalyst for a broader restructuring of the large German utilities. This could have a knock-on effect in the UK, reinforced e.g. by Centrica’s current woes and the recent Innogy/SSE retail merger.

Again, it is unlikely to be a dull year.  We wish you all the best in navigating the surprises of 2018.

Major energy surprises of 2017

At the beginning of 2016 we started a tradition of publishing 5 surprises to watch out for on the radar screen.  In 2016 we focused on major reversals in market prices given cyclically depressed market conditions. Our surprises included major price reversals in oil & German markets, a recovery in spark spreads and an energy credit shock.

After the market fireworks of 2016, 2017 has been a relatively calm year. But there has been no shortage of surprises along the way.

As 2017 draws to a close, we revisit the 5 potential surprises we set out in January.  We also use the benefit of hindsight to look at 3 other major surprises that turned heads this year.

Revisiting our 5 surprises from Jan

As we set out in Jan, our surprises are not forecasts or predictions.  They are areas where we think it is worth challenging prevailing industry consensus. A quick status check on each.

1. Macro shock – e.g. political upset, rising inflation &/or interest rates
In a sigh of relief from markets, Macron & Merkel prevailed and the Italian government limped through the year.  Broad based global growth continued and there were no major macro shocks to interrupt it.  However there was a step up in inflation in some European countries, e.g. UK breaching 2% target rate with Germany hovering just under 2%.  Watch for a reversal in monetary stimulus in 2018 if inflation continues to rise.

 2Asian LNG demand upside surprise
Asian LNG demand growth was definitely one of the surprises of 2017.  This has underpinned a recovery in spot LNG prices in Q4 2017 to 10 $/mmbtu as Asian buyers have been competing for spot cargoes.  China has played a pivotal role with LNG imports increasing 40% vs 2016 as shown in Charts 1 & 2.  The surprise within China has been the effectiveness of the government’s pollution driven policy shift to gas. Despite the absence of market based mechanisms, the Chinese authorities have implemented a rapid shift to gas, focused on industry, space heating and some power-generation near key cities.

 Chart 1: Historical Asian LNG Demand

*Note: 2017 has been estimated by combining actual demand data up until the end of October with demand estimates for November and December.

Chart 2: 2016 vs 2017 Asian LNG demand

Source: Timera Energy

3. Growth in European gas & power M&A
There has been a steady pick up energy transactions activity flow in 2017. Fortum’s ongoing €8 bn bid for Uniper has featured (& may be the catalyst for further German portfolio restructuring). Utilities have also continued to sell assets e.g. Engie’s $1.5 bn upstream LNG portfolio sale to Total, DONG’s $1.3 bn oil & gas sale to INEOS and Centrica’s E&P and CCGT sales.  The proposed SSE/Innogy retail merger suggests that utility restructuring is set to continue.  There has also been a significant pick up in infrastructure & private equity fund competition to acquire energy assets.

4. Capacity payments becoming more widespread in Continental power markets
There was no watershed moment in 2017, but capacity price penetration continued to grow.  France joined the capacity market club in Jan 2017, with capacity prices for 2017 & 2018 clearing at 9-10 €/kW. Italian capacity market plans took a step forward this year. Some issues remain with clarifying the structure and pricing of the reliability options that will underpin Italian capacity pricing.  But these are likely to be resolved in 2018 to pave the way for implementation. The EU also turned up the heat on Germany to move to a more market based capacity solution, announcing a probe into its strategic reserve mechanism.

 5. Jump in value of gas supply flex
The UK gas market has seen a major shift in supply flex value in 2017. The permanent closure announcement of Rough storage has seen a step change in buyer interest to acquire flexibility. Part of this is portfolio repositioning to replace Rough capacity.  But there is a broader focus on accessing gas deliverability, particularly with the demand recovery driven by the power sector.  The UK transition has not yet spilled over into Continental gas markets, where seasonal price spreads remain structurally weak and spot volatility is well below UK levels.

Major 2017 surprises in hindsight

As well as those above, there have been 3 other surprises that have caught our attention this year.

1. Ongoing strength in coal prices
Despite the looming reality of ‘peak coal’, prices have had a very strong year in 2017. Spot European (ARA) coal prices have consistently held above 80 $/t and look set to close the year near 95 $/t. As with spot LNG price strength, the drivers are focused on China (responsible for half of global coal demand).  Chinese authorities have stuck to their policy announcements and significantly reduced the overhang of inefficient and unsafe domestic coal production.  This has seen a surge in Australian coal exports & prices, with a knock-on impact in Europe.

 2. Strong European gas demand
European gas demand is likely to rise around 6% in 2017 after a similar strong increase in 2016.  Power sector demand growth has played a pivotal role.  The coal to gas switching transition that took off last year, continued to gain momentum in 2017, helped by higher coal prices. French nuclear outages in Q1 supported higher gas plant load factors.  There were also unusually dry conditions on the Iberian peninsula which saw substitution of CCGTs for hydro capacity.

3. Renewable & battery cost declines
Wind and solar capacity costs continued to steeply decline.  UK offshore wind costs in the 2017 CfD auction (58 £/MWh) were half the level of the previous auction in 2015. Solar panel costs have continued to plummet, driven by cheaper Chinese production.  This was evident in the first non-subsidised UK solar farm at Flitwick (developed in combination with batteries). Battery costs have also fallen sharply with shorter duration lithium-ion batteries breaching the 200 $/kWh level.  Longer duration battery costs are falling too, but are still well short of levels that support widescale commercial deployment.

These surprises set up some of the issues on our radar screen for 2018.

Timera news

The Timera team has been growing in 2017.  New members include:

  • Phil Robinson, previously the commercial head of UK power producer Calon Energy, who will play a key role in growing Timera’s power advisory business.
  • Henry Crawford, coming from a gas trading and analytics background from Nova Energy, who is strengthening our commercial analysis expertise.
  • Sonia Youd, previously commercial director of Centrica Storage Ltd, who is providing commercial subject matter expertise to support our midstream gas work.

Their experience is also feeding valuable additional insights into our blog material.

Our client base has continued to expand in 2017 with new clients including Fluxys, Interconnector UK, Sembcorp, Arcus & Stonepeak Infrastructure.  Transaction work with existing clients has also been a focus this year, advising on acquisition & development of flexible power and midstream gas assets.

We launched a new blog format in August 2017, with the addition of two new columns (Angle & Snapshot) and a revamped Blog Archive.  The additional content has been well received with a big jump in blog subscriptions, allowing free access to a weekly subscribers list of new content. We are also publishing blog content now via Linkedin & Twitter.

This is our last feature article for 2017. We will back in early Jan with 5 new surprises for 2018.  In the meantime we will be continuing to publish material via the Angle and Snapshot columns. We have also published a briefing pack on LNG market transformation over the next 5 years (see link in blue box below).

All the best for a relaxing and enjoyable festive season.

Briefing pack: LNG market transformation
A Timera Energy briefing pack on ‘How the next 5 years will transform the LNG market’ can be downloaded here: LNG market transformation


Asian portfolios drive LNG contracting evolution

Asian demand growth has never been more important for the LNG market.  Two credible scenarios bound the range of likely outcomes:

  1. High demand – where demand growth broadly keeps pace with currently contracted supply
  2. Low demand – where a significant surplus of LNG emerges vs contracted positions by 2020.

In either scenario the LNG market needs substantial volumes of new supply in the first half of next decade.  But it is the pace of Asian demand growth that will determine whether new LNG will be required by 2020-21 or 2023-24.

This timing is key given a hiatus in new liquefaction project FIDs and 4 to 5 year lead times to bring new supply to market. To date there has been limited willingness by either producers or buyers to invest or contract in anticipation of a high demand scenario.

In the meantime, Asian portfolio positions are helping to drive a rapid evolution in the way LNG is contracted.  Over contracted buyers are selling surplus volumes (e.g. Japanese utilities).  Under contracted buyers are purchasing spot cargoes (e.g. China).

This is supporting a transition to shorter term LNG contracting and hub-linked pricing. It is also eroding the dominance of long term oil-indexed supply contracts.

The ‘Big 5’ Asian buyers

The top 5 buyers (Japan, Korea, Taiwan, China & India) make up more than 90% of Asian LNG demand (173 mtpa in 2016).  Growth dynamics across smaller buyers (Thailand, Malaysia, Indonesia, Singapore & Pakistan) are strong, but these countries currently only account for 13 mtpa of demand.

Chart 1 shows the historical and projected net long term contracted position of the Big 5.  2017 has seen strong demand growth (12% vs 2016), driven particularly by China. This has been consistent with a high Asian demand growth scenario.

If growth were to continue on this trajectory then the net over-contracting of Asian LNG portfolios is likely to be limited. A low demand scenario could see a more than 20 mtpa surplus evolve over the next three years, much of which may be sold at European hubs.

Chart 1: Big 5 Asian net contracted LNG position vs demand

Source: Timera Energy.

Note: Charts show future contract volumes as signed on an ACQ volume basis. In practice there may be some flexibility for buyers and sellers to negotiate lower contract volume take, particularly over summer periods.  

All eyes on China

China is the key driver of Asian demand growth uncertainty. There is a credible range of 25 mtpa between low and high Chinese demand paths by the beginning of next decade, as shown in Chart 2.

Chart 2: China’s contracted LNG position vs demand

Source: Timera Energy

2017 has been a strong growth year for Chinese demand, consistent with the high demand scenario.  This has seen Chinese buyers actively sourcing spot cargoes this year. But that does not necessarily mean a further 3 years of growth at this pace to follow.

Persistently high coal prices have helped support Chinese LNG demand this year.  2017 has also been important in the Chinese political cycle, given the lead up to the 19th National Congress which saw Xi Jinping consolidate his power. There has been a strong associated incentive for the incumbent Chinese leadership to support economic growth.

Looking forward, the pace of Chinese economic growth remains a key factor.  But LNG demand is also set to be influenced by a combination of coal price levels, pipeline volume take, responsiveness to prevailing LNG spot prices and a pollution driven policy shift towards gas.

Japanese positions key to LNG contracting innovation

Beneath the net position of the big 5 buyers, there are some more substantial contractual imbalances in Japan and South Korea. Chart 2 illustrates this issue, with Japan facing a 15-20 mtpa contract surplus by 2019.

Chart 3: Japan’s contracted LNG position vs demand

Source: Timera Energy

The surplus of contracted LNG in Japan and Korea is driving a rapid commercial evolution amongst utilities. Buyers are trying to negotiate increased flexibility in legacy supply contracts e.g. allowing cargo resales and relaxing destination clauses.

But Japanese & Korean buyers are also increasing their focus on short to medium term contracts to manage LNG portfolio exposures.  This is evident in the current push by Japanese utilities to expand their LNG trading & optimisation capabilities to manage:

  1. Over-contracted positions, with surplus LNG being priced against European hubs
  2. The ramp up in flexible hub-indexed US export contract volumes, with forward exposures that are managed against US and European hub prices.

LNG market liquidity is also being boosted by rapid growth in the role of commodity trader intermediaries (e.g. Gunvor, Vitol, Trafigura & Glencore). These players are injecting innovation and expertise developed in oil and other commodity markets.

This evolution of the LNG contract market is driving a virtuous cycle which is acting to increase the influence of hub price signals.  It is also seeing Asian portfolios shifting their focus to the west, in order to access liquid US & European hubs to manage portfolio exposures.

Funds taking on market risk to boost returns

Investment funds have made a big push into European energy infrastructure this decade. This has been fuelled by a search for yield in a record low interest rate environment. But yields on regulated infrastructure assets are now also being driven down to historically low levels.

A key issue is that energy infrastructure investors are competing with utilities for the same sort of assets and development projects. In both cases capital preservation is key. And this has meant a focus on regulated or long term contracted assets, for example ‘feed in tariff’ or CfD protected renewable assets and regulated or contracted pipes and wires.

However as regulated asset yields compress further into single digits, infrastructure investors are being forced out along the risk curve. Alternative pools of capital are also being formed with a more open investment mandate than that of classic infrastructure funds.

The search for yield is driving a greater tolerance for market risk exposure. And this is becoming evident in the types of assets that fund investors are targeting (e.g. conventional power assets, gas & electricity storage, pipelines & regas).

Investment funds targeting European energy assets

In Table 1 we have grouped funds that are active in European energy infrastructure into 3 categories based on capital type, target returns and risk appetite. We have also provided some examples of specific funds and transaction case studies.

Table 1: Summary of investor categories

Investment drivers Fund examples Transaction examples
Infrastructure & pension funds Focus on capital preservation. Regulated or contracted cashflows. Low market risk tolerance. JP Morgan, Ardian, iCON Infrastructure, Allianz Capital Partners Denmark PKA pension fund wind investments. Allianz Capital Partners acquisition of Gas Connect Austria.
Alternative infrastructure & Sovereign Wealth Requirement for a base level of secure cashflows (e.g. from capacity payments). Some market risk tolerance to increase returns. Macquarie, Blackrock, Brookfield, ADIA, CKI Macquarie UK CCGT acquisitions. Fund investment in UK peakers (e.g. Infrared, AMP). Brookfield acquisition of Mitsui stake in First Hydro pump storage.
Private equity Comfortable with market risk. Need clear value growth & exit strategy. Business model efficiencies also important. KKR, Riverstone, ECP, Blackstone, Warburg Pincus ECP acquisition of UK CCGTs. KKR acquisition of French CCGTs. Star Capital development of Eleclink interconnector.

Source: Timera Energy

Infra & pension funds

The investment mandates of infrastructure & pension funds drive a focus on protected cashflow. Risk tolerance of these funds is steadily rising, for example taking on greater development or regulatory risk. But any assets with significant exposure to market risk struggle to make it past the investment committee approval stage.

Alternative infra & sovereign wealth

A recognition of this challenge by some of the larger infrastructure fund managers has seen new pools of capital emerging. This can be in the form of ‘special situations’ funds, or alternatively via raising specific capital to pursue a target asset or portfolio.

Behind this transition are institutions, sovereign wealth funds and individual investors who are also being pushed into riskier asset classes to boost returns. As long as the low interest rate environment persists, energy asset acquisitions from this category of alternative infrastructure capital is set to grow. But the key challenge these funds face is how they manage market access, hedging and optimisation of assets post acquisition.

Private equity

Private equity funds are already big owners of energy infrastructure in the US. Step forward five years and it may be the same in Europe. Value growth and a clear exit strategy are key. But these funds have a strong tolerance for market risk, which can either be managed via in-house trading functions or outsourced via market access contracts.

Private equity backed acquisitions of European energy assets have been more opportunistic to date. These have included for example KKR, ECP and Castelton’s acquisition of CCGT assets. PE funds have also been active with oil & gas assets e.g. upstream and midstream acquisitions from Blackstone, Riverstone, Hitec Vision & Warburg Pincus.

As utilities and producers continue to offload energy assets, we are set to see a shift from opportunistic purchases to structural growth in private equity asset ownership in Europe.


Taking nuclear life extensions seriously

France has reignited the debate around nuclear power plant closures in Europe this month. The French government has just reneged on its promise to reduce the nuclear share of generation output from 75% to 50% by 2025.

Why? Nuclear closures of that scale and pace cannot realistically be replaced by renewable generation. So the practical impact of the closure policy would have been to commission a fleet of new gas-fired plants in order to maintain security of supply.

France’s decision may mark the start of shift towards a more pragmatic stance on nuclear life extensions across Europe.

Nuclear closures in numbers

North West Europe could lose more than 40GW of nuclear capacity, based on the current retirement schedules of regulators and policy makers. And this is after accounting for the recent French policy shift.

In Chart 1 we show closures across Germany, France, UK and Belgium. This does not include other European markets also planning to close nukes such as Sweden and Switzerland.

Chart 1: Scenario of Nuclear closure assumption in NWE

Source: Timera Energy

The scenario assumes:

  • All German reactors are closed by 2022 as currently scheduled.
  • UK reactors close at the end of their currently regulatory approved lives (accounting for EDF life extensions granted in 2016).
  • Belgium closure of Doel & Tihange plants between 2023-25, consistent with 2015 legislation.
  • France closes 16GW of nuclear capacity by 2030, broadly consistent with achieving the 50% output target (with closures focused in 2025-30 period).

It is important to note that the chart is not our projection of what is going to happen. We expect a significant policy shift to reduce and delay nuclear closures via life extensions. We set out the logic behind this below.

The German closure case study

Germany permanently closed 8GW of nuclear plants after the Fukushima disaster in 2011. The closure of the remaining 11GW of German reactors by 2022 looks politically difficult to reverse. Yet Germany is a case study of the unintended consequences of rapid closures.

German nuclear output has predominantly been replaced by incremental coal-fired generation, either from within Germany or imported from its Eastern neighbours. This is a key factor driving Germany towards a substantial miss of its 2020 emissions target, with a projected deficit of more than 100 mt per year of CO2. Closures are also causing major transmission stress issues, supporting the life extensions of thermal assets via Germany’s strategic reserve mechanism.

There has been a degree of political dishonesty in the German nuclear debate, whether intended or otherwise. The proposition put to the German people was the replacement of nuclear plants with renewables. This has not been the outcome, despite Germany’s major ramp up in renewable investment. And it was unrealistic to suggest it could have been.

Replacing nuclear with what?

The key fact that is being glossed over in the political debate, is that the closure of a nuclear plant requires a much larger replacement volume of renewable capacity to maintain security of supply and carbon neutrality.

European security of supply standards are based on an equivalent firm capacity logic, where different types of plants are de-rated based on output and availability. Nuclear typically receives a capacity credit of around 84%, wind around 22%.  So for example replacing 40GW of nuclear plants with wind alone requires 150GW of incremental wind capacity development in order to maintain the same level of system security of supply.

In practice, nuclear closures are being replaced by a combination of renewables and fossil fueled output (whether domestic or imported). But the incremental impact of closures is heavily skewed towards fossil fueled plants, given cost & resource constraints around the rollout of renewables.

The German closure case study is starting to unveil these inconvenient facts. As a result, we believe other European countries are likely to shift towards a more pragmatic approach. This month’s decision by the French government is evidence of that shift.

The case for life extensions

Nuclear closures are a complex political issue. But we see three key incentives aligning to support the case for life extensions:

1. Decarbonisation: Europe is pushing to lead the global decarbonisation effort. Removing an existing high load factor, low carbon source of generation is akin to chopping off a limb before going into battle. Germany is evidence of the fact that closing reactors makes emissions reduction much harder.

2. Security of supply: There is very low public and political tolerance for blackouts. Closing baseload nuclear plants at the pace projected in Chart 1 creates a major system capacity deficit. This cannot practically be filled by wind and solar at the rates required. This precipitates a requirement to build new gas plants with economics lives of 20-25 years, at least until load shifting batteries can be rolled out in scale. This does not help with decarbonisation.

3. Commercial: Nuclear plant owners are commercially incentivised to extend lives (e.g. EDF is pushing for at least 10 yr extensions across its fleet). Most nuclear plants are currently very profitable given low variable costs. The commercial incentives of larger commercial and industrial consumers of electricity are also aligned, given the competitive implications of higher power prices caused by nuclear closures.

The nuclear versus renewables debate has become too polarised. The nuclear industry is preoccupied with trying to demonise renewable intermittency. And a dogmatically anti-nuclear ideology dominates the renewables lobby.

Europe should be focusing on closing coal not nukes if it wants to decarbonise. And that is a path that suits both nuclear and renewables supporters well.

Looking forward, Small Modular Reactor (SMR) technology may transform public perceptions of nuclear safety over the next ten years. As this technology matures, the orderly replacement of Europe’s nuclear fleet looks increasingly viable.

Life extensions are the bridge that buys time for this to happen. A 10 year life extension of the non-German nuke fleet could push 30 of the 40GW of closures from the 2020s into the 2030s. If Germany changed tack this could be more than 35GW.  Buying 10 years of low carbon innovation and cost reduction is not a pro-nuclear standpoint.  It is common sense.

Oil price animation shows bulls taking charge

Crude prices have broken through some key resistance levels over the last two weeks.  Brent front month futures pushed above 60 $/bbl for the first time since Jan 2015. This helped drag the US WTI benchmark above 55 $/bbl shortly after.

This bullish breakout in oil prices comes against the backdrop of an intense energy industry debate about the long run future of oil.  Many senior industry participants are projecting ‘peak oil’ to occur at some stage next decade.

The logic behind peak oil projections is an anticipated decline in the use of oil as a transportation fuel.  This is the result of the increasing penetration of fuel-efficient engines and electric vehicles.  The arguments to support this logic are sensible and it is interesting that the peak demand thesis has now surpassed the peak supply narrative.

But there is an important question of timing.  Over the remainder of this decade, there are stronger forces driving the oil market than a fear of peak demand.

Strong demand & cuts rebalancing market

Global oil demand growth is strong and has been so for three years.  Global demand rose by 2.0 million barrels per day (mb/d) in 2015 and 1.6 mb/d in 2016.  Demand growth for 2017 is forecast to be 1.6 mb/d.  Demand is being supported by lower prices and relatively strong global economic growth since 2015.

On the supply side, OPEC’s production cuts are helping to steadily erode global oil inventories.  The current production cut agreement expires in Mar 2018 with a meeting on Nov 30th likely to see OPEC extend cuts beyond this.  OPEC have indicated a willingness to extend, possibly by 6 to 9 months, and this has been a key factor supporting the recent price rally.

The excess of OECD oil inventories over their 5 year average levels has fallen by more than 50% in 2017, with inventories currently at around 160 million barrels. If current trends continue, inventories are likely to return to the 5 year average at some stage in 2018.

What are crude futures prices telling us?

Oil market sentiment has been weighed down by bearish supply side drivers for the last two years.  This has reflected the threat of lifting of OPEC production caps (or non-compliance), given significant production headroom particularly from Saudi Arabia and Russia.  Large incremental volumes of US unconventional oil production also loom over the market.

But despite these supply side threats, crude price behaviour in 2017 is being driven by a tightening global market. Chart 1 shows an animation of the monthly evolution of the Brent futures curve over the last 10 years.

Chart 1: Brent curve animation


Source: Timera Energy, ICE data

Chart 1 illustrates three important factors that point to a tightening market:

  1. Spot price strength: Both key global crude price benchmarks have broken above resistance levels that have defined the top of trading ranges since the Q1 2016 price slump (Brent above $60 and WTI above $55).
  2. Shift to backwardation: The Brent curve has swung from contango to backwardation in Q3 2017. Contango typically indicates a near term oversupply, with spot prices at a discount to the curve. Backwardation on the other hand indicates buyers are willing to pay a premium to secure physical supply today, rather than waiting to buy it more cheaply in the future.
  3. Rising calendar spreads: The oil market focuses on the price spread between the spot contract and a point further out along the curve (e.g. 6 mth or 12 mth) as a curve shape barometer for a tightening market. Calendar spreads have been increasing for three years as the market has swung from contango to backwardation and are currently at their highest levels since 2014.

US shale is still key swing provider

Strong demand has helped to rebalance the oil market from 2015-17.  Further demand growth strength through 2018-19 looks key to determining whether the market continues to tighten, or falls back into a 40-60 $/bbl Brent range.

But even in a tight scenario, oil prices are unlikely to run away to the upside.  WTI remains anchored by the scale of response of incremental US shale production.  If the WTI curve pushes significantly above 50-55 $/bbl then US producers can sell into the rally to hedge forward production expansion.

There may be a 6 month lag to bring new US production to market.  But market tightness over this horizon is likely to be reflected via steepening backwardation rather than a structural move higher in the futures curve (e.g. back towards $70).

The ability of OPEC to respond to higher prices will depend on the conditions under which it extends the production cap.  A longer extension (e.g. to Dec 2018) could precipitate further near term tightening.  But at the end of the cap horizon it is unlikely that OPEC will sit back and watch US producers dominate incremental supply growth without a fight.

Cracking the new US export business model

48 mtpa of 2nd wave US export projects are queued to go.  They have sites, FERC approval and in many cases good access to infrastructure and skilled labour.  Behind this are at least another 50 mtpa of projects currently progressing through the FERC approval process.

The problem these projects face is a lack of long term offtakers.  Only one 20 year LNG supply agreement has been signed so far in 2017 and it was small (1 mtpa between Edison and Venture Global, developers of the Calcasieu terminal, yet to get FERC approval). Buyers are instead pushing for shorter term contracts with greater flexibility, for example the 2.5 mtpa 3 year offtake contract Petronas signed In October with JERA.

LNG is currently a buyer’s market.  The pace of comitted new supply is for the moment outstripping expected demand growth and is likely to continue to do so until at least 2020-21. This is driving liquefaction project developers to adapt and innovate in order to build a robust business model to underpin investment in the next wave of export capacity.

Balance shifting from sellers to buyers

Table 1 summarises five key concerns of LNG buyers and the implications of these concerns for sellers in developing a viable project business model.  The table applies not just to second wave US export project developers but more generally to all investors in new liquefaction capacity.

Table 1. LNG buyers concerns & implication for sellers 

Buyer Concern Implications for sellers
1. Contract duration LNG market transitioning to shorter term contracting. Buyers unwilling to sign 15-20 year offtake contracts. Tough to find long term contracts to underpin financing.  Constrains debt financing opportunities. Pushes risk onto equity.
2. Price level Buyers unwilling to sign contracts at price levels that cover supply LRMC. Demand of some emerging buyers price sensitive. Market price recovery has become a producer’s problem.
3. Price indexation Increasing preference for gas hub vs oil indexation. Producers losing option to link LNG contract pricing to oil.
4. Market risk 1. 2. & 3. combine to undermine buyer appetite for taking long term market risk (e.g. via US export tolling model). Market risk pushed onto upstream equity investors.  Increases focus on supply chain presence to access market & monetise gas.
5. Flexibility terms Buyers want diversion flexibility & ability to resell cargo to support portfolio optimization. Access to LNG supply chain flexibility transitioning from seller to buyer.

Source: Timera Energy


There is no magic – success comes down to low costs & high flex

Charif Souki kickstarted the 1st wave of US export projects when he set up Cheniere.  He left there in 2015 and has been doing his best to catalyse the 2nd wave via his new company Tellurian.

The business model Tellurian are proposing involves an integrated presence across the supply chain from upstream equity gas, through liquefaction to shipping, marketing & trading.  Tellurian is trying to convince buyers to not only sign up to LNG offtake, but also to provide 65-70% of project equity. This is only one example of a range of business model innovations currently being undertaken by prospective US project developers.

In our article last week, we set out why a successful next wave LNG supply project was all about:

  1. Achieving the cheapest delivered gas cost, while
  2. Offering buyers maximum flexibility

Acheiveing this largely comes down to low cost of capital, ability to execute new terminals efficiently and having an established trading and supply chain presence.

We are not convinced by some of the other arguments being put forward to support project economics. For example:

  • Treating US gas production on a cost basis, versus recognising its market value measured against US hub prices (e.g. Henry Hub or Dominion South)
  • Viewing required project return on an aggregated cross supply chain basis, versus looking at the return required on individual elements of the supply chain
  • Assuming that extrinsic value from cargoes (e.g. from destination flex) accrues to the liquefaction project as opposed to the marketing and trading function required to monetise it.

So what ingredients are likely to drive a viable next wave project business model?

Driving down costs & increasing flex

Chart 1 shows our view of how the cost structure of a 2nd wave US export project may compare to a 1st wave project.  Again there is no magic.  Numbers are falling based on investor expectations of declining costs of liquefaction and feedgas.

Chart 1: Long run marginal cost of 1st vs 2nd wave projects

Source: Timera Energy

One of the key changes likely to feature in 2nd wave business models is the internalisation of project costs and exposures.  This is facilitated by an integrated supply chain presence from upstream equity gas through to active marketing & trading.

This model stands in stark contrast to 1st wave US export project developers that used tolling contracts to outsource the costs and exposures associated with getting gas to and from the terminal.

Cost & exposure internalisation means that 2nd wave FID decisions are likely to be based on equity investor’s expectations of market prices (US hub and LNG spot prices) and project costs, rather than depending on the external pricing of tolling contracts and non-recourse debt.

Investment likely to be dominated by large players

The shifting behaviour of LNG buyers is pushing 2nd wave developers towards a more merchant oriented marketing model.  Limited availability of long term offtake contracts means market exposures are likely to be managed via a combination of shorter term contracts (e.g. 3 to 5 years) and spot cargo optimisation.

What does it take to finance liquefaction projects with retained market exposure like this? In short: big balance sheets and an ability to price and manage market risk.

That points to oil and gas majors and large LNG portfolio players with an existing supply chain presence as the main sources of next wave project equity.  These companies have lower equity hurdles and can raise incremental corporate debt faster and cheaper than independents relying on non-recourse financing from banks.

In addition to low cost of capital and ability to retain & manage market risk, there are some genuine sources of cost advantage that large players can access via an integrated supply chain business model.  For example:

  • Avoiding transaction costs, by moving gas through the supply chain instead of having to transact in the market e.g. bid/offer spread and credit risk costs.
  • Accessing relatively low cost commercial capability to monetise cargo value, via existing LNG marketing and trading functions.

That said it is important to recognise that incremental value generated via commercial optimisation of cargoes accrues to the marketing and trading business, not to the liquefaction project.

What happens next

There is one clear hurdle hindering the progress of 2nd wave US exports.  The current ownership structure of projects does not reflect the backing of large gas and LNG players.  Aside from Golden Pass (Qatar Petroleum, Exxon & Conoco), 2nd wave ownership is skewed towards specialist developers and smaller scale players.

This suggests to us that a period of project consolidation, aggregation and change in equity ownership is approaching fast. This process should help sort out a more credible subset of viable projects, with a number of 2nd wave options unlikely ever to be commissioned.

Changes in ownership do not mean that existing owners will be cut out entirely.  But the balance sheets and supply chain presence of large players is required to propel 2nd wave projects past FID. How this is facilitated in practice is the next real challenge for US LNG.