We set out the prospects of the ‘Top 5’ LNG producers club last week. Amongst these, Qatar is the only ‘sure bet’ contributor to the next wave of LNG supply (2023-2030). The other members of the Top 5 have substantial gas reserves, but all could face major cost hurdles in bringing these to market.
This opens the door to competitive challengers from a group of ‘second tier’ LNG producing nations. These challengers are not merely also rans. Advantaged liquefaction projects from within this group will almost certainly displace some projects from the top 5 producers.
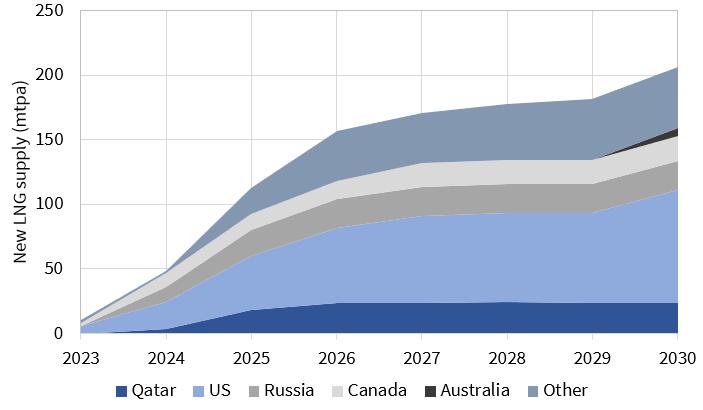
In today’s article we take a look at several of the less well known producing nations that may contribute to the next wave of LNG supply in the 2020s. These are considered in alphabetical order rather than ranked, with an illustrative scenario for volume growth shown in Chart 1.
Chart 1: Illustrative scenario for next wave supply from non Top 5 producers
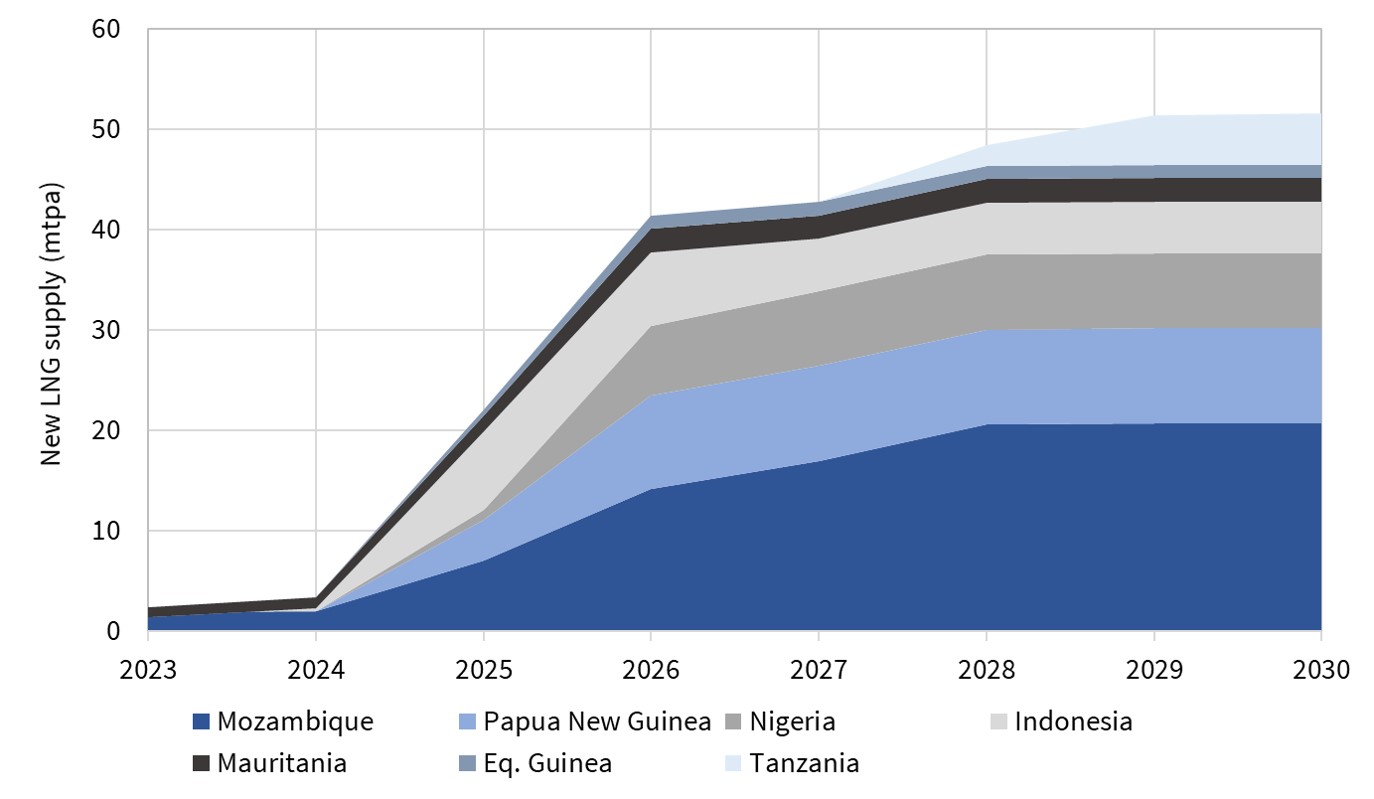
Source: Timera Energy
Equatorial Guinea
Equatorial Guinea has been on the verge of breaking into the LNG producers club for the last two years with the Ophir LNG project (Fortuna).
But in 2018, this project has hit difficult waters in finalising financing arrangements. Nic Cooper, the CEO has resigned, and the company has received a government ultimatum that it will lose its licence if it can’t achieve Final Investment Decision (FID).
As a result of these challenges, it looks like Ophir has slipped to a 50:50 prospect for commissioning in the mid-2020s prospect.
Indonesia
Indonesia is already member of the producers’ club with the Tangguh Train 3 project expected to start in mid 2020.
The most developed of Indonesia’s other prospects is the Abadi/Masala project (Inpex & Shell). This is now an onshore liquefaction project with 9.5 mtpa capacity. FID looks possible in 2019-20, which would set up commissioning in 2024-25.
Mauritania/Senegal
BP and Kosmos hope to take FID in late 2018 for an initial floating LNG facility of 2.5 mtpa capacity. This project is split 50:50 between Mauritania and Senegal. Production is expected to commence 2022. It is reasonable to assume a second phase of 2.5 mtpa by 2025.
Mozambique
Mozambique has been one of the big African LNG growth hopes in the 2020s. Many substantial offshore gas discoveries have been made, but a lack of government experience in dealing with large upstream projects has slowed the pace of projects towards FID.
The leader of the pack has been the Coral South floating LNG project (ENI Operated, 3.4 mtpa). This achieved FID (mid 2017) with production expected in 2022.
There are also some other promising next wave candidates, the most prominent of which are:
- An Anadarko project which received government approval in March 2018. This would entail two liquefaction trains with a total of 12.88 mtpa capacity. Contract sales for the first train are advancing – suggesting FID in early 2019 and production in 2024. A second train may follow (e.g. online in 2025).
- An Exxon-led project is also advancing and could take FID in 2018-19. Details have not yet been announced but our best guess is a 6 mtpa train online in the mid 2020s.
The scale of Mozambique gas reserves would definitely support additional projects in the late 2020s/early 2030s if costs prove competitive.
Nigeria
Nigeria is a long established LNG producing nation. After a lengthy hiatus for investment in liquefaction, momentum appears to be building for NLNG Train 7. This would be a 8.5 mtpa train. Given the propensity for delay in Nigeria we think a conservative assumption of an FID in 2020 with start-up in 2025 is reasonable.
No further specific LNG export projects have been announced yet, but reserves support the possibility of further trains in the late 2020s/early 2030s.
Papua New Guinea
The Exxon operated PNG plant has been a success (aside from a temporary earthquake related stop earlier this year). Commissioning went smoothly and the plant has frequently operated above nameplate capacity.
Expectations are now building around an expansion of 8 mtpa, likely to reach FID in 2019 and come onstream by 2025.
Tanzania
Tanzania was considered another strong East African prospect several years ago given large scale gas discoveries. But progress towards monetising these has been slow given a number of regulatory challenges.
The first LNG project (which we assume is notionally a 5 mtpa train) has been delayed due to lack of decisive government decision making and challenging economics. As a result FID looks to be 5 years away, suggesting commissioning in the second half of next decade.
The longer shots
In addition to the main challengers above, there are several other producing nations that could also contribute volumes in the 2020s. These include Brazil, Egypt, Iran, Israel, Norway and Oman. New projects in these countries are more likely to proceed in a higher global demand growth scenario or if Henry Hub price rises unexpectedly disadvantage US export projects.
Shape of the next wave
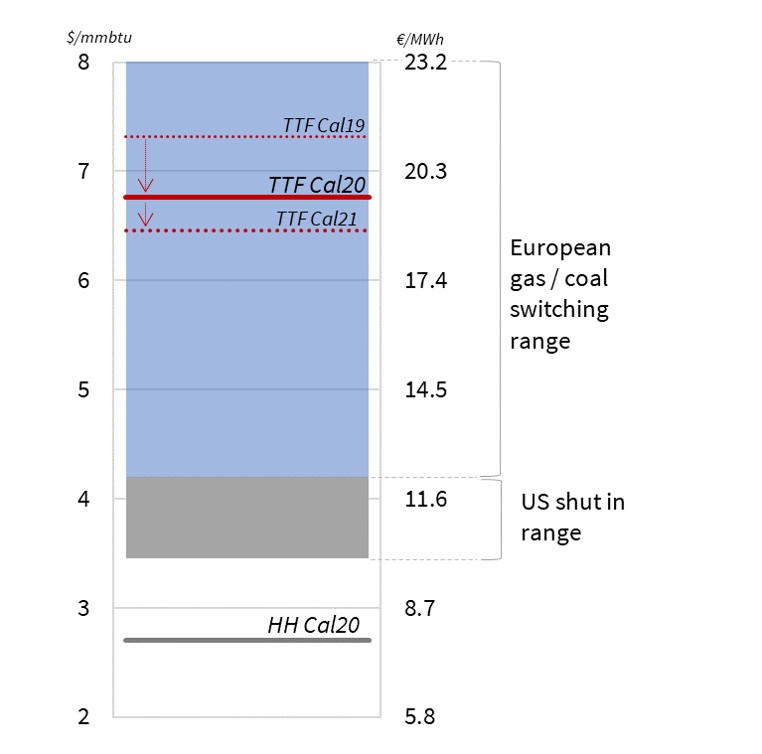
The conditions are falling into place to spark an onset of new liquefaction project investment decisions. Global gas demand remains strong. This month’s run up in Asian spot LNG prices towards 12 $/mmbtu is also flashing on producers radar screens.
But the volumes, timing and source of next wave of LNG supply still remain highly uncertain. 2019 is set to be a key year for first mover FID decisions that will shape the next wave.
| Timera is recruiting power analysts We are looking for a Senior Power Analyst and a Power Analyst with strong industry experience. Very competitive & flexible packages. Further details at Working with Timera. |