Decarbonising European gas: the risks & options

The COP-21 Paris climate accord marked the beginning of the end for coal in Europe.  Most European countries are taking clear actions to drive coal out of the energy mix through the 2020s. Could gas face a similar future from the 2030s?

Gas asset owners and investors are increasingly focused on understanding this risk.  While the role of gas in Europe may diminish from the 2030s, it is unlikely to disappear before the 2050s. But the tangible impacts of decarbonisation sit well within a gas asset investment horizon. This creates a requirement to understand, quantify and manage associated risks.

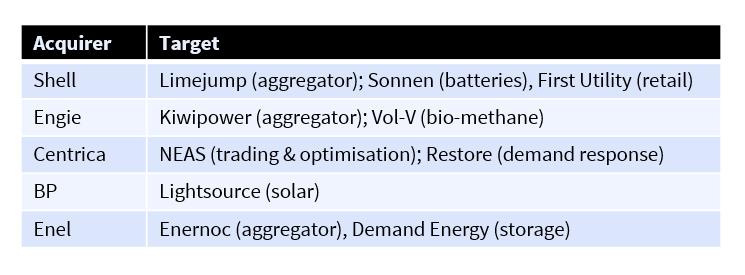
One of the key risk mitigation actions for the European gas industry is embracing new low carbon technology and ensuring there is appropriate policy support in place to deliver this.  There are clear lessons here from the European power industry.  Policy support for wind and solar has not only slashed the cost of deployment, it has created enormous growth opportunities for European energy companies in leading the global role out of renewable technologies.

Professor Jonathan Stern is Founder of the OIES Gas Research Programme. In a paper published in Feb-19 he sets out a vision for potential pathways and narratives to support decarbonisation of the European gas market (Narratives for Natural Gas in Decarbonising European Energy Markets).  Over the next three weeks we publish a series drawing on material from Jonathan’s paper.  We highly recommend his paper for further details.

In today’s article we focus on the risks that decarbonisation poses for energy companies and the potential options for decarbonising European gas markets.  Then in next week’s article we explore the impacts of decarbonisation on the gas value chain and potential impact on different players.

Why the gas industry needs to take decarbonisation seriously

Governments in most of the largest European gas markets are genuinely committed to COP21 decarbonisation targets. Some future targets may be missed. But governments appear very unlikely to abandon their commitment to large scale decarbonisation by 2050, or to substantially delay its implementation.

Importantly, a number of leading technology, energy and industrial companies are also swinging their support behind the push to decarbonise. Motives are no longer just focused on Corporate Social Responsibility.  Momentum is increasingly being driven by a strong financial motivation to lead a seismic transformation in the way we source and use energy.

To ignore decarbonisation and delay action on the part of the gas industry, invites governments to decide that gas will not play a significant role in Europe’s long term energy future.  This in turn increases the risk that there will be insufficient time to prepare for decarbonisation before unabated methane needs to be phased out.

The advocacy narrative of the European gas industry over the last decade has focused on coal to gas switching and backing up renewables.  There is logic behind this approach. The reduction in US carbon emissions since 2007 demonstrates the benefits of power to gas switching.  And gas-fired power is playing a structural flexibility role across European power markets.

But the ‘switching & backup’ narrative has failed to convince governments, NGOs, and a rising portion of media & the public that the role of gas can help achieve post-2030 decarbonisation targets. The gas industry therefore needs to develop a decarbonisation vision and associated narratives which effectively address the post-2030 period.

Technology options for decarbonising gas

There are a broad range of approaches and technologies that could be applied to reduce the carbon foot print of the European gas industry. These are grouped into four categories in Table 1 with a high level summary of pros and cons.

Table 1: Approaches for decarbonising gas

Technology Pros Cons
1. Power to hydrogen / methane
  • Cost reductions from falling cost of renewable power & storage
  • Potential to ‘absorb’ zero/negative cost periods of excess renewable output
  • Utilises existing technology (caveat scale & cost issues)
  • High cost & electricity intensity of production
  • Limited current policy & investment support
  • Realistic availability given seasonal energy shift requirement
2. Gas steam reforming to hydrogen (SMR)
  • Potential scalability e.g. across transport, heat & industry
  • Ability to use natural gas feedstock
  • Synergies with existing gas infrastructure for ‘blending’
  • Early stages of technology development
  • Cost of production
  • Reliance on CC(U)s, also higher cost & evolving technology
3. Bio & waste gas
  • Consumes waste & creates useful biproducts (e.g. fertiliser)
  • Process does not require significant additional energy
  • Relatively widely implemented (at small scale) already
  • Current low efficiency of technology
  • Resource potential & scalability limitations (particularly if relies on food crops not just waste)
  • Cost of removing impurities in order to ‘blend’
  • Anaerobic digestion produces CO2 (requiring CCS)
4. Methane Cracking
  • Technology alternative to SMR (with similar pros)
  • Produces hydrogen and solid carbon
  • Strong Russian incentive to make it work
  • Very early stage technology development
  • Uncertain cost and scalability at present

Source: Timera Energy, drawing on Jonathan Stern’s paper referenced above.

1. Power to hydrogen / methane (P2G):  This relies on the principle of electrolysis: to separate water into its component parts of hydrogen and oxygen. Experimental pilot plants were developed in the late 1990s and early 2000s.  But potential for widespread commercial deployment has been supported by falling costs of renewable power generation and increasing periods of renewable ‘curtailment’ given excess supply.

Current progress of P2G technology suggests relatively small volume potential unless large amounts of low/zero cost renewable electricity is available, or dedicated off-grid renewable energy systems are built in regions with high wind and solar resources.  The Ecofys (GfC) estimate of 24 bcm of renewable hydrogen from wind and solar power in 2050 is two and a half to five times higher than ENTSOG’s scenarios for 2040.

This technology might be adequate if the role of gas in the European energy mix is only to provide daily and seasonal back up for renewable energies. But to maintain anything close to the scale of the gas market today, biogas, biomethane, and power to gas would need to be supplemented with the reforming of methane into hydrogen accompanied by carbon capture, utilisation and storage CCUS.

2. Gas steam reforming to hydrogen options: Large scale methane reforming with carbon capture to produce hydrogen for network distribution to residential and commercial customers would be a completely new development. There are currently only two operational natural gas-based carbon capture projects in Europe.  These are both at Norwegian gas fields (Sleipner and Snohvit) with CO2 injection directly into offshore reservoirs.  There are however a range of other projects at the feasibility study or test stage in six other European countries.

At the moment, large scale methane reforming to hydrogen with CCS is under serious consideration only in the UK.  In southern Europe there is greater emphasis on biogas and biomethane development. The emphasis on offshore structures is the result of onshore CO2 storage being considered politically difficult in major continental European gas markets due to environmental opposition.

There are strong logistical advantages to gas producers from reforming methane and producing hydrogen either at the field or where the gas is landed onshore. The advantage of such pre-combustion CCS would be that only offshore CO2 pipelines would be needed. The potential disadvantage is that all networks and customers in those regions would need to be converted to hydrogen.

3. Biogas/biomethane: The primary method of biogas production is the biological breakdown of organic material through anaerobic digestion. Biogas (containing CO2 and water vapour) can be upgraded to biomethane by a variety of methods (absorption, adsorbtion, methane filtration, and cryogenic separation) which can then be used interchangeably with natural gas. While this means incurring higher costs, it then facilitates use of biomethane with existing gas infrastructure (e.g. via blending).

The most optimistic of a range of forecasts (for Europe) sees the possibility of 98 bcm of biomethane from biomass sources by 2050.The Entsog scenarios for 2040 are very substantially lower, showing only 20-50 bcm of biomethane production in 2040.  Even these more conservative estimates raise a major query over reliance on food crops given a shortage of appropriate waste.

Synthetic natural gas (SNG) can also be produced from gasification of waste via a thermo-chemical process using biomass and/or other waste as a feedstock. This technology is still at an early stage of development.

4. Methane cracking: An alternative method of hydrogen production is methane cracking which splits methane into hydrogen and a solid carbon residue (carbon black) which can then be used in a range of industrial processes. This could resolve some of the problems and costs of carbon storage, but the extent and scale of the utilisation options for carbon black are uncertain and large scale storage would still be required.

Russia is investing substantial resources in this technology as a potential means to support gas sales into Europe on a long term basis. This process is currently at the laboratory testing stage and it remains to be seen how quickly it will develop.  But Russia has a very strong financial incentive to succeed given its vast natural gas resources & reliance on gas sales revenues.

Making it happen: time frames

Many European countries are aiming to largely decarbonise their power sectors by 2030.  Focus then shifts to the heat sector across the two subsequent decades.  So the time available to demonstrate that methane can be retained in the energy mix on a large scale beyond the next 20 years is relatively short.

Following this logic, it will not be possible to recover methane-related infrastructure investments requiring a longer depreciation period. This provides a very strong motivation for the gas industry to demonstrate that decarbonised gas options are realistic and cost-effective versus alternative low carbon options. Achieving this across the next 5 years is imperative in order to provide sufficient time for a large-scale gas network transition over the following 25 years up to 2050.

The pilot projects currently in operation will need to be followed relatively quickly by commercial scale projects in order to be operational by 2025.  This in turn will require technical, regulatory, and financial frameworks to be in place to allow final investment decisions to be taken in the early 2020s. There are major uncertainties that need to be addressed in the next 5 years, of which the most immediate are technical and logistical difficulties and costs.

Making it happen: cost

A particularly important issue is the capability to ‘blend’ hydrogen into the existing gas network.  This provides a market for hydrogen produced. But it also enables use of existing gas infrastructure, substantially lowering the time and cost hurdles for kick starting decarbonisation.

Hydrogen is already blended with methane in the Netherlands. Studies suggest that blending up to at least 20% hydrogen in gas supply may be possible.  Blending of that volume could support a substantial scale of hydrogen production within existing gas networks in order to ramp up decarbonisation in the 2020s.

It is very difficult to make accurate cost estimates for the different decarbonisation options. Only biogas costs currently come close to European hub prices (e.g. a 15-30 €/MWh range), although this is without associated CCS. The lower estimates for biomethane, power to hydrogen and particularly power to methane costs range from €40-80/MWh while the higher estimates are €150-260/MWh.

Wind & solar demonstrate the potential for rapid cost declines as technologies scale with the appropriate policy support. That is why it is essential for the gas industry to launch commercial scale projects as soon as possible. The current reality is that large investments are required in projects that do not yet offer a commercial return.

The best way forward for the European gas industry is offence rather than defence. Decarbonisation presents as many opportunities as it does risks. But a clearer vision and policy framework is required to make it happen.

May Mannes joins Timera as a Managing Director.   See more details on May’s CV and background on Our Team page.


Distribution key to ‘weaponising’ demand side

A more dynamic demand side is a key building block of the energy transition. But the ability to achieve this depends strongly on the rapid evolution of electricity distribution networks and their operators.

Investment, technology & policy incentives are converging to transform the role of distribution networks.  For example:

  1. Embedded capacity: New generation & storage assets are increasingly distribution connected (rather than transmission connected), e.g. embedded wind, solar, gas engines, batteries & smaller CHP.
  2. Smart tech: Rollout of smarter technology & software within businesses and households is set to facilitate a more dynamic bi-directional real time role for the demand side.
  3. EVs: The impact of rapid deployment of electric vehicles & associated charging infrastructure will be primarily focused on distribution networks.

This is challenging the traditional ‘plain vanilla’ function of distribution networks.  Networks were developed to allow a simple one-way flow from centralised generation on the grid to end consumers. But a much more dynamic landscape is evolving with multiple sources of supply and demand interacting across the network.

This is creating physical infrastructure constraints within the network.  It is also increasing network management & balancing complexity. These factors bring the role of distribution network operators (DNOs) firmly into focus.

Evolving role of the network operator

DNOs have traditionally had a relatively staid business model focused on security of supply and quality of service. While these two goals remain key, the capabilities required to deliver on them are increasing substantially in scale and complexity.

DNOs will need to evolve rapidly and purposefully in order to facilitate an increasingly dynamic & decentralised future.  Policy makers have coined the term ‘Distribution System Operator’ (DSO) to describe their vision for an ‘evolved DNO’. But the practicalities of reaching this DSO vision may fundamentally change the revenue, ownership and financing structures that characterise DNOs today.

Whether privatised or, as in many countries, under municipal ownership, the DNO enjoys a regulator-approved natural monopoly over the wires in its territory.  Its primary revenue streams are stable, and generally price-regulated on a cost-plus model.  This more or less guarantees a reasonable rate of return if the operator is competent.  Privately owned DNOs therefore enjoy a low cost of capital and attract owners seeking stable, regulated returns.

The DNO business model has relied primarily on performing some basic, conventional ‘medium tech’ functions reliably and efficiently.  Everyone involved in electricity from generators to consumers depend on these being done well, but it is not rocket science.  Most of the ‘higher tech’ action in the industry has traditionally been upstream of the DNO, in the hands of larger and more sophisticated transmission or ‘grid’ operators (TSO).

Many current developments and trends point to this changing fundamentally over the coming years, as summarised in Table 1.

Table 1: ‘Traditional’ vs ‘Future’ role of distribution networks and operators

Traditional Future
Generation assets Dominance of large centralized plant, exporting to transmission grid Rapid growth in decentralized distribution connected generation & storage
Consumers Passive; price-takers Many active ‘prosumers’ of all sizes
System balancing A grid function: flex assets dispatched centrally Also a DNO/DSO function: flex assets deploying on a transactional basis
Demand side response Limited role of demand side; struggling to achieve participation & potential Significant participation in system balancing & optimisation at all levels
EV charging Very limited quantities; slow charging; one-way electron flow Large quantity; some very fast; some two-way electron flow
Key infrastructure actors Grid/TSO pre-eminent: legacy of central dispatch & control DNO/DSO of increasing importance: decentralisation
DNO/DSO skillset & revenue model Efficient management of ‘med-tech’ assets & processes for regulated monopoly return
In addition, participation in ‘hi-tech’ physical & transactional dynamics for additional risk & reward


There are competing visions as to how the evolution from DNO to DSO will work out, but two significant aspects are common to all of them.

  1. The physical infrastructure required to connect all these components together in an effective manner will be different, and most likely more complex and sophisticated. And it will no longer be the transmission system that bears the brunt of this.  In fact TSOs could play a materially diminished role.
  2. If the potential of the new physical assets and infrastructure is to be realized effectively, the nature of business taking place throughout the system will increasingly involve many more players, acting dynamically in multilateral, real time transactions.

The network operator is no longer simply focused on ensuring adequate physical capacity for electricity to flow to customers.  Instead they are actively managing dynamic real time activity across all network participants.

Impact on capability & ownership of DNOs

DNOs are centrally and strategically positioned in the value chain.  When fully evolved into DSOs, they should be one of the most important category of actors in the power sector.

But how readily can organisations that have made their money through efficient deployment of relatively unsophisticated technologies and processes adapt to facilitate this transition?  If they do not, or only do so slowly, they may at least miss commercial opportunities. At worst, they may act as brake on progress in the industry as a whole.

By contrast, if DNOs succeed in an effective evolution to DSOs, there will be new revenue generation opportunities. The transition to DSO should also facilitate significant efficiencies from optimised deployment of new technologies and methods along the entire value chain.

One important factor may point to an optimistic scenario.   Taking the UK as an example:  the existing DNOs have relatively large resource bases (though very much smaller than, say, National Grid) and are under diverse ownership.  It seems possible that within this ecosystem, experimentation should be possible that will quickly reveal which apparent opportunities are real or a dead end; and which managements are capable or sluggish.  Darwinian commercial processes may then steer the sector towards the most fruitful opportunities and the new best practices that will realise them.

In any event, the commercial risk profile of the rapidly evolving DNO is likely to increase quite noticeably over time.  Becoming a DSO, the proportion of its revenues that are underpinned by regulated monopoly will likely diminish with merchant activity increasing.  The cost of capital will rise correspondingly.  These factors will attract a different class of owner that can embrace and indeed drive the changes that are coming.

May Mannes joins Timera as a Managing Director.  See more details in our recent Angle here or May’s CV and background on Our Team page.


Russia, LNG & the next 3 years

European LNG import volumes set another new record in Apr-19, following the previous record set last month. Volumes are up about 230% compared to this time last year.

In the face of an onslaught of LNG, Russia has not flinched.  Import volumes from Gazprom in Apr-19 also set a new record.

A fascinating battle between Russian and LNG import volumes is shaping up across the next 3 years. In today’s article we look at two scenarios for European gas market supply & demand balance across 2019-21. We also consider the mechanisms available to absorb surplus LNG and how Gazprom may respond to lower prices.

European LNG imports depend on Asian demand

The more than doubling of European LNG imports since last summer is a function of global LNG supply outpacing demand growth.  The resulting surplus of LNG cargoes is being absorbed by Europe’s liquid North West European hubs (TTF & NBP).

We have a pretty good view of supply growth over the next 3 years given this relates to liquefaction projects currently under development.  The key uncertainty is the pace of growth in Asian demand.

In Chart 1 we consider two scenarios for Asian demand growth across 2019-21.  For simplicity we assume stable European gas demand at 2018 levels and net zero storage volumes across years.

The left-hand panel shows a high Asian demand growth scenario, the right-hand panel a low Asian demand growth scenario.

Chart 1: LNG market & European S&D balance under High & Low Asian LNG demand scenarios


Source: Timera Energy

Under the high growth scenario (left hand panel), there is a surplus of around 25 bcma of LNG in 2019 & 2020 flowing to Europe. This surplus is largely gone by 2021 as the current wave of new liquefaction has effectively been absorbed by that point.

The LNG surplus flowing to Europe is significantly larger under a low Asian demand growth scenario. This year’s surplus is 41.4 bcma, with further growth to a 63 bcma surplus in 2020 (the peak delivery year of the current wave of new supply).

So which scenario path are we following? Up until Winter 2018-19, Asian demand appeared to be on a ‘high growth’ trajectory. But demand has been softer over the last six months, in part relating to warmer weather across winter.  There has also been early evidence of a slowdown in economic growth in Asia.  The extent to which this slowdown continues (or rebounds) will likely determine which path LNG demand follows across the next 2-3 years.

How will the European market clear surplus LNG?

There are 3 key mechanisms that enable the LNG market to absorb surplus volumes (vs ‘business as usual’ demand):

  1. European switching: As European gas hub prices fall, gas-fired power plants become more competitive relative to coal plants, boosting power sector gas demand.
  2. LNG demand response: As LNG spot prices decline, some buyers may increase demand (particularly emerging Asian buyers e.g. India). We estimate around 10 bcma of potential incremental demand.
  3. US shut ins: Ultimately if European & Asian spot price levels decline to levels such that netback prices in the US turn negative, then US LNG export flows will decline as a form of supply side response. Volume response here is substantial at ~55 bcma (40 mtpa).

While there is upwards of 30 bcma of total power sector switching potential in Europe, this depends on relative gas, coal & carbon prices. Chart 2 shows an estimated switching range for German CCGTs vs coal plants. European hub prices in Summer 2019 are now well below that range, and power sector switching is already happening in significant volumes.

Chart 2: Key global gas price benchmarks & European switching price range


Source: Timera Energy

Chart 2 also shows our estimated shut in price range for US LNG exports, currently sitting around 3.55 – 4.30 $/mmbtu vs front month TTF prices around 4.72 $/mmbtu.

Given US shut in levels are approaching below, incremental power sector switching potential is likely to be limited before shut ins commence. This is particularly the case if coal prices continue to decline alongside gas prices. So, do not be surprised if significant volumes of US gas are temporarily shut in over the coming summer.

TTF forward curve prices however recover sharply from Winter 2019-20 (as shown in Chart 2).  Market pricing is consistent with an acute oversupply of gas across the current summer, but a recovery beyond. In other words, the market appears to be pricing in a continuation of higher Asian LNG demand growth.  If this turns out to be too optimistic, there may be more US shut ins required to clear surplus gas in 2020.

Russia vs LNG: who blinks first?

Gazprom has shown no inclination to pull back on European flow volumes in the face of the recent onslaught of LNG.  A recent OIES podcast on Russian gas sets out why the Russian political landscape may continue to push Gazprom towards high export volumes.

In the short-term, Gazprom could be viewed as foregoing short-term revenue by contributing to a TTF slump towards $4/mmbtu.  There are historic precedents for Gazprom reducing exports in response to lower prices (e.g. across the 2009-10 price slump).

But it is possible that Russia is pursuing a longer term more strategic objective in continuing to push gas into a well supplied European market.  By allowing TTF (& by arbitrage Asian LNG spot prices) to fall well below the break-even price required for new LNG projects (7-8 $/mmbtu), Russia may be targeting the delay of new liquefaction project FIDs across 2019-20.

In a recent article we detailed the substantial volumes of new LNG supply queued for FID. The 2019 slump in global spot prices does not make FID decisions easy, even if it currently looks like there could be a supply gap in the early to mid-2020s.

FID delays or cancellations would serve to bolster Russia’s market share of the European gas market over the next five years.  It would also support faster price recovery in the early to mid – 2020s.

The inability of Asian demand to absorb supply growth across Winter 2018-19 has pushed the European gas market into a new phase of intense market share competition between LNG and Russian pipeline gas.  The trajectory of Asian LNG demand growth is set to be the key arbiter of just how fierce that competition will become, especially across 2019 & 2020.

Headwinds for UK gas engine margins

When the UK capacity market was introduced in 2014, large grid connected CCGTs were anticipated to be the primary provider of new capacity.  Step forward five years and it is distribution connected gas reciprocating engines that have taken the largest share of the pie.

The success of gas engines has been driven by a combination of relatively low capital costs, very fast ramp rates, low start costs and attractive levels of embedded benefits to supplement wholesale & balancing mechanism (BM) margins. The challenge now confronting engine owners is that policy changes will remove most of the embedded benefits margin over the next 18 months.

This means that engine returns going forward will be firmly focused on wholesale market and BM margin.  Key structural drivers should support this merchant margin into the 2020s.  But the last two years have been more difficult for engine margins.  In today’s article we show a simple ‘backtest’ analysis of merchant engine margins, explore margin drivers and consider the broader implications for the UK power market.

The evolution of engine margins

Enthusiasm for gas engine economics was helped by very strong margins in Winter 2016-17 as a result of market tightness caused by large French nuclear outages (e.g. causing UK interconnectors to export rather than import power).  Enthusiasm was also fuelled by some very ‘optimistic’ consultant forecasts at the time that extrapolated similar conditions into eternity.

Chart 1 shows the reality of a return to much tougher margin conditions over the last two years, particularly across the last 12 months.  The chart shows value capture across the Day-Ahead market, Within-Day market and Cash-out prices for a 35% efficient embedded reciprocating engine, assuming a merchant value capture strategy.

Chart 1: Backtested merchant margin analysis for UK gas reciprocating engine


Source Timera Energy

Note the chart does not show ancillary (e.g. STOR/FR) or embedded benefits (e.g. triads, GDUoS) margin streams.  Cash-out price value capture numbers are based on a NIV chasing strategy.

Two warm winters have followed 2016-17 with UK electricity demand surprising to the downside. This has been exacerbated by an overhang of thermal capacity versus Capacity Market expectations (e.g. delayed retirements of Eggborough coal & Peterhead CCGT plants).

In addition, peak prices have been dampened by increasing volumes of engines running to try and capture triad period revenues. This is however a temporary dynamic that will fall sharply over the next two winters as policy changes see the triad benefit reduced to almost zero.

Cash-out price (or Net Imbalance Volume) chasing has become a key focus of engine portfolios. This relies on accurately forecasting cash-out prices and running associated imbalance volumes to generate value.  Margin capture from this strategy is being challenged by:

  • Increasing volumes of engines coming online and pursuing a similar strategy
  • Players using similar forecasting techniques to predict cash-out prices.

The volume of flexible capacity now chasing cashout prices significantly outweighs the average system imbalance volumes.  Asset owners are recognising that engine value capture will need to transition to a more conventional Balancing Mechanism bid/offer strategy over the next 2-3 years.

While conditions have been difficult, this does not spell the demise of the role of engines in providing peaking capacity. Just as it made no sense to extrapolate Winter 2016-17 conditions forward, it is unrealistically pessimistic to extrapolate conditions over the last 12 months.  It is normal for value capture from ‘out of the money’ peaking assets to fluctuate significantly across years: 2016 was a big year, 2018 was a tough one.

Two important implications of current environment

The evolution of engine margins is likely to have some broader implications for the UK power market.

Firstly, capacity market bids for engine projects will almost certainly rise. Investment cases that supported sub 10 £/kW capacity bids are being strongly challenged by current market conditions. GWs of ‘cheap’ new build and DSR related engines have helped pull down UK capacity prices since introduction of the capacity market. Engines will continue to play a key role in providing new flexible capacity in the 2020s.  But engine investment going forward is likely to require significantly higher capacity prices than the last T-4 auction.

Secondly, tough conditions could well trigger significant aggregation across UK peaking portfolios.  A strong trading and commercial analytics capability is quickly becoming a key differentiator across peaking asset portfolios, as the importance of wholesale/BM margin increases.  This capability is expensive to outsource and takes time & money to build in-house. Step forward 3-5 years and it would not surprise us to see several large players with strong commercial & trading teams dominating the provision of UK peaking flexibility.

Challenging three battery investment ‘myths’

‘Battery storage flexibility is a key building block of a decarbonised power sector.’

This statement is not a myth.  In fact it is almost a truism.

Intermittent renewables will dominate electricity supply in a decarbonised world. Wind and solar output require a low carbon source of flexible backup.  Rapidly declining battery costs will facilitate broad deployment. Sound familiar?

While there is a broad consensus around the vision for batteries, the practical details of the business model and investment case for individual battery projects is less clear.  In today’s article we challenge three ‘myths’ currently circulating in relation to battery investment.

‘Myth’ 1: Batteries shift load to smooth renewable output

While in theory batteries can be paired with renewables to smooth intermittent output, this does not represent a viable business model to support battery investment. There are three main reasons for this:

  • Duration: Investment is currently focused on 0.5-2.0 hour lithium-ion batteries, which are seeing the steepest & fastest cell cost declines. The short duration of these batteries significantly limits the volumes of energy that can be moved between time periods.
  • Degradation: A focus on shifting load requires deep cycling. This shortens the life of lithium-ion batteries and accelerates the costs of cell replacement, undermining project economics.
  • Returns: Cycling batteries to shift load is not commercially optimal. The returns from load shifting (e.g. full cycle to capture cheapest offpeak hour vs highest price peak hour) are well below those required to support investment.

Maximising battery returns involves the complex optimisation of battery optionality against multiple markets including wholesale (e.g. day-ahead and within-day prices), balancing markets and network services.

The logic above does not preclude successful co-location of batteries with solar or wind projects.  But the benefits of doing this are focused on cost reductions (e.g. shared infrastructure & connection) and portfolio risk diversification, not on load shifting.

Battery flexibility will also play a key role in dampening price fluctuations which are driven by intermittent renewable output.  But with shorter duration batteries this is via multiple shallow cycles to respond to short term price volatility rather than deep cycling in order to shift load.

A viable investment case for longer duration, deeper cycling storage solutions (e.g. flow batteries) looks to be at least five years away.

‘Myth’ 2: Battery investment is being underpinned by network services

The UK and Germany are leading European investment in batteries. Early projects in both markets have been supported by network services contracts (e.g. the UK EFR contracts tendered in 2016 for very rapid frequency response services).  But battery investment cases being developed today have turned to focus on merchant returns.

Revenue opportunities from network services remain. This includes both grid services for transmission connected projects (e.g. frequency response, reactive power) as well as local/site revenues for embedded batteries. But the value of these services has been declining and contract horizons shortening as competition to provide flexibility increases. For example, prices for frequency response services in both the UK and Germany have fallen significantly over the last three years.

As a result, battery investment cases are being built on a ‘margin stacking’ model.  This includes a base of more stable returns e.g. capacity payments, ancillary services & local site revenue.  But merchant returns from wholesale and balancing markets are key to bridge the gap required to sign off a bankable project. An example of a margin stacking model in a UK battery project is shown in Chart 1.

Chart 1: Illustrative stacked margins required to support a transmission connected UK battery


Source: Timera Energy

The chart shows projected annual average required returns by margin category to support investment in a transmission connected battery (measured in £/kW of capacity installed for a generic 1hr duration battery).  The ‘Other’ category varies by project/site location but covers revenues from e.g. network services & positive transmission charges.

The highest returns on battery flexibility are achieved via ‘real time’ balancing markets e.g. in the UK the Balancing Mechanism and in Germany the primary reserve market.  This is for the simple reason that price volatility is highest in these markets. Wholesale market and balancing returns typically make up more than 70% of required grid connected battery margin.

This focus on merchant returns leaves battery developers and investors with the key challenge of how to monetise battery flexibility value.

‘Myth 3’: Battery projects are bankable already

If you take current battery returns (e.g. in the UK or Germany) and map them onto current capital costs, it is very difficult to build a viable investment case.  But investors are looking forward not down and there is a frenzy of activity in the battery space in 2019 in anticipation of an approaching tipping point.

This is supported by three strong tailwinds for battery economics:

  1. Declining capex costs: Battery cell costs are falling ~20% year on year and are projected to half again over the next 5 years. Cells typically represent about 50% of total project capex.
  2. Rising merchant returns: The last two years have seen weaker returns on flexibility (e.g. given capacity overhangs & warmer weather). But increasing intermittency and steepening supply stacks are key structural drivers supporting higher price shape & volatility into the 2020s, supporting rising battery margins.
  3. Policy changes: Policy makers, regulators and system operators are aware of the system benefits of batteries and are taking supportive action (e.g. via targeting removal of double charging for embedded batteries and sharpening balancing price signals).

There is no doubt that these tail winds will support the roll out of batteries at a substantial scale into the 2020s.  The transformative nature of battery flexibility is no myth.

The challenge today is anticipating how the three factors above will combine to underpin the battery investment case and developing a viable business model to support this.

Power sector setting gas prices in Europe

Two European gas market records were broken in March. Both LNG and Russian monthly import volumes surged to their highest levels in history. This has meant that gas is being pushed into the European market at an unprecedented rate.

Prices have responded accordingly.  As we set out last week, the US LNG shut in price range is now sitting just below current TTF price levels.  This should represent major price support.

In the meantime, the power sector is driving European gas prices. In today’s article we explore gas for coal switching dynamics and the key power markets that are providing incremental gas demand.

Record high supply volumes

We start by looking at a pair of charts that provide some context for the record LNG & Russian import volumes in Mar-19.  Chart 1 shows average daily send out from European regas terminals. The last six months clearly illustrate the role of liquid NW European hubs as a sink for surplus LNG cargoes.

Chart 1: Monthly European LNG sendout vs Asian LNG-TTF spread


Source: Timera Energy

Gazprom has not flinched in the face of record LNG import volumes as shown in Chart 2.  Its favoured Nordstream (Baltic) and Yamal (Belarus) import routes have been flowing at max capacity across most of the last 18 months. But in Mar-19 flows via the Ukraine/Slovakian route also ramped up to near maximum capacity.

Chart 2: Russian gas deliveries via 3 main routes


Source: Timera Energy

It may be that Russia sees a strategic silver lining in temporarily lower gas prices, if this delays a growing queue of new LNG projects targeting FID in 2019-20.  Some temporary price pain now may reduce the competitive threat from new LNG supply in the early to mid 2020s.

The other factor currently weighing on summer gas prices is unusually high European storage inventories (~20% higher than last year) shown in Chart 3.  This means storage injection will not play its usual role in supporting summer gas demand.

Chart 3: Pan-European storage inventory vs historical range.


Source: Timera Energy

The switching rubber band effect

It is clear from the three charts above that the supply side of the European gas market is not currently very responsive to price levels.  That shifts the focus to the power sector as the price responsive component of gas demand.

Liquid price signals for gas, coal and carbon mean that gas for coal plant switching in European power markets is a dynamic response mechanism to lower gas prices. This can be seen in Chart 4 which shows the strong relationship between TTF spot prices (blue line) and the gas for power switching price range (shaded in green).

Chart 4: TTF price evolution vs European switching range


Source: Timera Energy

Switching is often referred to as a dynamic that happens at a given price level.  But in reality the competitive dynamics of gas vs coal plant vary by market, with plant efficiencies and with other differences in variable costs (e.g. coal transportation costs).

The top end of the green range on Chart 4 represents the gas price level at which more efficient CCGTs (52% HHV efficiency) start to displace less efficient coal (40% efficiency).  The bottom end of the range is based on the TTF price at which less efficient CCGTs are displacing more efficient coal plants. The switching range moves dynamically with coal and carbon prices (the drivers of coal plant variable cost).

The chart shows that historically switching has provided strong support for TTF prices which tend to bounce off the top end of the range.  In times of temporary surplus, TTF prices can push down into the switching range, but this is a bit like pushing on a taught rubber band i.e. the resulting incremental gas demand tends to push prices back up again.

At the end of Mar-19, TTF prices broke through the bottom of the switching range.  This is a rare occurrence and it illustrates the extent of surplus gas at hubs last month.

This does not mean that switching potential in European power markets was exhausted.  The switching range is only a benchmark guide overlaid on a more complex interaction between hundreds of gas & coal plants across Europe.  To understand what is going on behind this benchmark we need to look at a breakdown of Europe’s key power markets.

Understanding Europe’s switching potential

Chart 5 shows monthly gas demand across the key European switching markets (UK, Italy, Germany, Netherlands, Belgium, France and Spain).

Chart 5: Gas demand from power sector in NW Europe, Spain and Italy


Source: Timera Energy

Power sector gas demand was high across the first part of last winter, particularly in January where it reached levels not seen since the major French nuclear outages of two years ago. This high demand was partly the result of switching, but also reflected some cold weather in Q4.

March is however a different story.  Warmer weather and high wind output saw a significant reduction in output from gas-fired power plants.  This illustrates the seasonal pattern of power sector gas demand.  Demand falls as summer approaches, meaning that gas prices need to push further into the switching range to induce a similar volume of gas demand response versus mid winter.

The UK power market sits at the bottom of the switching merit order given an 18 £/t carbon price floor which disadvantages coal relative to gas. The largest block of switching potential sits across the NW European Continental markets.  This covers Germany / Netherlands (very well interconnected and with high volumes of coal & CCGTs) and to a lesser extent France & Belgium.  In southern Europe Italy is important given a high volume of CCGT capacity as is Spain (although gas burn can be strongly linked to hydro conditions).

Switching & US shut ins working against further declines

In an article last year we set out our estimate of 20-30 bcm of potential incremental European gas demand from power sector switching.  The exact volume is strongly dependent on the relative price levels of gas, coal and carbon. This power sector response mechanism represents a big ‘rubber band’ acting to support TTF prices around switching range price levels.

The two most likely sources of further downward pressure on TTF come from (i) a continuation of high LNG & Russian import volumes into summer and (ii) further declines in coal & carbon pulling down switching levels.

But there is a second and larger rubber band looming below in the form of US LNG export shut ins.  As we set out last week, 2019 US shut in volume potential is 55 bcm (40 mtpa).

Support for gas prices may have been thin across the 50% decline of the last 6 months.  But there is some major support between 4-5 $/mmbtu.  Don’t be surprised if European & Asian gas markets start to stabilise from here.

Gas prices plunge towards US LNG shut in levels

Off-piste descent for gas prices

TTF prices fell by more than 50% across Winter 2018-19.  No… that is not an April Fool’s joke.  The decline in European and Asian gas prices across the last six months has been steep and relentless.

The price decline gathered pace in Q1 2019 as shown in Chart 1.  As the quarter progressed, Asian spot LNG prices converged with European hub prices. Then in late March, the key North Asian LNG price marker JKM crashed through the TTF price level.

If the Q1 2019 price decline were a ski slope it would be marked with double black diamonds.

Chart 1: Global gas price regional benchmarks (historic spot & current forwards)

Source: Timera Energy

Price behaviour is consistent with an acute near term surplus of LNG into the start of summer. The growth in new LNG supply (e.g. from projects in Australia, Russia and the US) is at least temporarily outpacing demand growth.

The LNG market is clearing surplus cargoes via sending them to liquid north west European hubs. The discount of JKM to TTF reflects this dynamic, although liquidity in spot cargoes has been limited across recent weeks.  At current prices it makes no sense to send US LNG to Asia.As a result of these dynamics, LNG delivery volumes into Europe surged in Mar-19 to their highest level in history.

This coincided with a second European gas market record. Russian import volumes in Mar -19 were also the highest in history. Gazprom has shown no inclination to ease back on supply as prices have fallen.

As well as very strong import volumes, European gas demand has been relatively weak.  Q1-19 has been unseasonably warm.  Coal prices have also been falling, reducing the gas price switching levels at which incremental power sector gas demand kicks in.  And European industrial and manufacturing data across Q1-19 has been very weak (particularly in Germany & France).

At what price levels will US export supply be shut in?

The Q1-19 TTF price decline brings US LNG export ‘shut in’ levels sharply back into focus. Chart 1 shows our estimated TTF shut in price range for US export flows (the grey shaded band). This represents the range where TTF prices no longer cover variable liquefaction, shipping and regas costs for delivery into Europe (i.e. where Gulf Coast LNG netback prices become negative).

LNG vessel spot charter rates have fallen 80% since Q4 2018 and are currently around $40k/day (down from above $200k/day).  This has pulled down US LNG shut in price levels relative to 2018. We calculate the US export shut in price range based on:

  1. Feedgas & variable liquefaction costs – benchmarked at 115% of the Henry Hub price
  2. Shipping costs – ranging from 0.65 to 1.20 $/mmbtu depending on factors such as use of boiloff gas and treatment of single vs return voyage costs
  3. Regas costs – ranging from 0.1 to 0.3 $/mmbtu depending on sunk cost access dynamics.

These numbers gives a current US shut in range of 4.0 – 4.8 $/mmbtu.  TTF front month prices last week were touching the top of that range at 4.8 $/mmbtu.  By the bottom of the range we should start to see significant price support given the potential shut in of a portion of the 42 mtpa of expected US export volumes.

In the meantime, pricing dynamics at European hubs are firmly focused on gas for coal switching in the power sector.  It is this key mechanism that we return to explore in more detail next week.

The changing role of UK’s gas interconnectors


2019 is going to be an important year of transition for the two key interconnectors that link the UK with Continental gas markets.

The IUK pipe between UK and Belgium is entering its first year without long term contracts. The Q4 2018 introduction of shorter term capacity products is already structurally changing flow patterns and capacity booking.

2019 will also see important changes for IUK’s main competitor, the BBL pipe between UK and the Netherlands.  Following on from the merging of BBL with the TTF price zone last year, BBL will commission a reverse flow capability in 2019, increasing the UK’s gas export capacity.

In today’s article we look at the evolution of recent flow patterns and capacity bookings on these interconnectors.  We also consider the impact of these changes on market pricing.

A tale of two pipes

A brief summary of the two interconnectors that link the UK gas market with Continental Europe is provided below.

IUK (UK – Belgium)

IUK has the capability for physical flow in both directions, linking the NBP and Zeebrugge hubs. IUK was commissioned in 1998, with financing supported by 20 year long term (LT) contracts.  These contracts expired at the beginning of Oct 2018.  A significant drop in booked capacity volumes has followed as can be seen in Chart 1.

BBL (UK – Netherlands)

BBL currently supports one way flow from (NL to UK), but with a reverse flow capability due to come online this summer.  BBL was commissioned in 2009, partially underpinned by a 7 year Centrica – Gas Terra contract which expired in Dec 2016.  Again, the impact of the expiry of this contract on capacity bookings can be seen in Chart 1.

Chart 1: IUK and BBL capacity bookings


Source: Timera Energy

Changing tariff structures & competition

The expiry of IUK’s LT contracts has significant implications for flows and capacity bookings on the pipe.  Up until Oct 2018, capacity was fully booked under LT contracts, with shippers treating capacity costs as sunk.  This meant relatively low variable costs to flow gas and in turn relatively high IUK utilisation.

But now the LT contracts have expired, IUK is selling capacity products on a more dynamic shorter term basis (e.g. via annual, quarterly, monthly & daily products). Before purchasing capacity, shippers are now weighing the cost of acquiring capacity (i.e. product tariffs) against the market price signals that drive capacity value.

This expiry of LT contracts and new tariff structure has led to a significant decline in both capacity bookings and utilisation since Oct 2018 as shown in Chart 2.  Gas imports across IUK so far this winter are 12 times lower than for last winter (20 GWh/d average so far in Win 18-19 vs 242 GWh/d Win 17-18), as shown in Chart 2.

This winter’s decline in IUK import volumes has been impacted by the new cost structure of capacity.  But it is also the result of higher UK LNG delivery volumes and milder weather reducing the UK’s import requirements.

Chart 2: Daily IUK and BBL flows vs capacity bookings


Source: Timera Energy

In addition, IUK is facing competitive pressure from BBL.  The recent merging of BBL and TTF (via removal of the Julianadorp interconnection point between TTF and IUK) reduces flow costs from TTF to NBP.  Chart 2 shows BBL dominating import flows across the current winter.

From this summer, IUK will also face competition on export flows with the introduction of reverse flow on BBL.

Summer 2019 dynamics

Capacity bookings on IUK this summer are currently lower than peak utilisation levels across the last three summers.  But this is not all down to changes in the tariff structure.  There is a heavy summer maintenance schedule for Norwegian production fields and UK terminals in Q3 2019 which should reduce the UK’s requirement to export gas over the summer.

The giant Norwegian Troll and Ormen Lange fields will be shut down for longer than usual maintenance periods across the summer.  There is also significant UK gas terminal maintenance scheduled (e.g. Segal, Easington).  The resulting flow reduction to the UK should be felt mostly in Q3 2019 (Aug/Sep), while there may be flow upside in Q2 2019 with flow rediverted from the continent to the UK.

Lower anticipated export volumes this summer are also consistent with market price spreads. NBP is currently at a relatively small discount to TTF in Q2 2019 compared to recent summers (-1.1 p/th). The spread actually reverses in Q3 2019, with NBP currently at a small premium to TTF.

What impact will interconnector changes have on market prices going forward? 

The NBP – TTF price spread is the key benchmark for price differences between the UK and Continental Europe.  Price spread levels are driven by the marginal cost of flowing gas between markets.

The flexibility to flow gas between NBP and TTF is focused on three key sources.  The most dominant of these sources is the extensive pipeline & upstream network of the Norwegian Continental Shelf (NCS).  This allows Equinor the flexibility to flow gas to the UK or multiple entry points on the Continent (although in practice this flexibility is focused on Emden & Dornum).

The NCS is typically the lowest marginal cost source of flexibility to arbitrage price differences between NBP and TTF.  In other words, the NCS sits at the bottom of the ‘flexibility merit order’.

But additional flexibility is often required to flow gas across the Channel. This means NCS flexibility is often supplemented by IUK and BBL flows, with the marginal cost of flowing gas across these interconnectors being an important driver of UK vs Continental price spread levels. Chart 3 shows the strong relationship between IUK booked capacity utilisation and the NBP-ZB price spread.

Chart 3: Monthly average IUK utilisation vs NBP-ZB price spread


Source: Timera Energy

The level of price spreads has a strong relationship to shipper’s variable transit costs.  This is why the expiry of a large volume of LT contracts at IUK is important.

Historically IUK shippers have treated the cost of capacity as sunk (given LT contracts). But with the transition to short term booking of capacity, shippers are including the cost of capacity in their flow decisions. In other words, price spreads are rising to reflect the full costs of transit, both capacity tariff and variable transit charge.

The change in IUK tariff structure (from LT contracts to shorter term products) has pushed IUK towards the top of the flexibility merit order.  It remains a key piece of UK gas supply infrastructure, but has effectively become a ‘peaking’ provider of flexibility, given the associated increase in marginal flow costs.

The influence of IUK marginal costs on price spreads is set to be focused on periods of peak winter import demand, or periods of higher summer export surplus.  During these periods, the pass through of higher IUK marginal costs is likely to translate into higher price spread volatility.

An increase in NBP-TTF price spread volatility is good news for the owners of interconnector capacity (given it increases value).  But it is important to note that this value increase only accrues to the existing owners of capacity, not the marginal buyer whose pass through of costs is driving up the price spread.

2019 should be an interesting year to watch in order to better understand the changing role of interconnectors in driving price spreads between Europe’s two key hubs.

A new wave of LNG supply is building

European and Asian spot gas prices have halved across the last six months. European hub prices are currently testing the 5.0 $/mmbtu level, down from almost 10 $/mmbtu in late September 2018.  The key JKM Asian price marker has converged towards TTF price support and is currently around 5.5 $/mmbtu.  

This plunge in prices across the current winter, has the LNG market firmly focused on the near-term supply & demand balance. Debate is raging as to whether the current wave of new LNG supply (2016-21) is starting to outstrip demand growth.

In today’s article however, we are going to take a step back, look beyond the near term market balance and consider the potential timing and volume of a new wave of supply in the mid 2020s.

We have flagged several times that lower near term prices may increase the risk of a tightening LNG market in the early to mid 2020s. This is because there has been a relative hiatus of liquefaction project FIDs across the last three years. New projects take 4 to 5 years to deliver.  That leaves a potential supply gap in the 2022-25 horizon if global demand growth remains strong.

But from the middle of next decade a new wave of supply is starting to take shape.  34 mtpa of new projects have now been FID’d across the last 12 months. And there is a much larger volume of credible supply options queueing behind this.  We explore today what this next wave could look like.

Is this time ‘really different’?

The LNG sector is noted for its cyclicality of investment.  Past LNG supply waves have been built on buyer’s anticipation of demand 4 to 5 years into the future.  This has underpinned buyer willingness to sign long term contracts (mainly on an oil indexed or Henry Hub plus costs basis). Offtake contracts have then allowed project developers to secure non-recourse financing.

This time it is at least somewhat different:

  • Asian buyers such as Japan, South Korea and Taiwan are uncertain of their future LNG requirements given risks around changing energy mix policies and in the case of Japan nuclear re-starts.
  • India’s LNG requirements are difficult to gauge given the price sensitivity of its power generation and fertiliser sectors and the lack of a significant space-heating sector to underpin infrastructure extension.
  • For Thailand, Pakistan and Bangladesh the uncertainty of indigenous production decline rates makes future LNG requirements difficult to judge.

For these reasons, China remains the key market where long term contracts for end use consumption appear most likely. 

Enter the Portfolio Players

We have previously flagged that the next wave of new LNG supply will likely be dominated by gas majors (e.g. Shell, Exxon, Qatar & BP). Large trading functions and access to balance sheet financing give them a comparative advantage over independents who rely to a greater extent on non-recourse finance (and hence long term contracts).

This has been borne out across the last 6 months by the Shell Canada, BP Tortue and Exxon Golden Pass FID’s. Portfolio players have also facilitated the financing of LNG projects by signing up for the entire offtake of third party LNG projects (BP and the Mozambique Coral project and US Freeport train 2).  The portfolio player ‘direct upstream financing’ and ‘large offtake agreement’ model is supporting new LNG upstream FIDs in a period of uncertain Asian LNG demand growth.

There is still space for some ‘traditional model’ projects, where buyers underwrite supply with long term contracts. But the timing and volumes of supply in the next wave will be driven to a greater extent by the gas major’s assessment of supply and demand balance from the mid 2020s.  If the majors think the market will hold new supply then they will pull the FID trigger.

What could the next wave look like?

Chart 1 illustrates a build-up of credible sources of new supply that could contribute to the next wave.  These are split between:

  1. Restarts of existing liquefaction (Egypt, Yemen)
  2. Recently FID’d projects
  3. Qatar’s new trains – not yet formally FID’d but compelling economics
  4. Additional projects with credible FID potential

It is important to note that the chart does not represent a projection of anticipated volume ramp up timing.  This is something that will start to become clearer as FIDs are taken and construction commences.  The chart is instead illustrating when new project volumes could credibly come online given existing and potential FID dates.

Chart 1: Next wave of LNG supply taking shape


Source: Timera Energy

Restarts

Egypt currently has significant idle LNG export capacity. But its net export position could recover by up to 9mtpa in the early 2020s.  This is driven by new offshore gas fields coming onstream and the possibility of gas being piped in from gas discoveries and developments offshore Cyprus and Israel.

The re-start of supply from Yemen is dependent on the cessation of civil conflict, but 7 mtpa capacity could be back onstream by 2025.

Recent FID’s

New liquefaction project FIDs have been relatively scarce in recent years (e.g. in 2017 the Mozambique Coral Floating LNG scheme was the only FID).  May 2018 saw the FID on Corpus Christi Train3, but the last six months have seen a surge in activity with (i) BP’s Mauritania/Senegal Tortue (ii) Shell’s LNG Canada Project and (iii) the Exxon/Qatar US Golden Pass project reaching FID.  These three projects in aggregate represent 34 mtpa of capacity.

Qatar

Qatar suspended its rolling Moratorium on the North field development in 2017. The Qataris then announced four new LNG trains (total capacity 32 mtpa) which are widely expected to result in FIDs in 2019 and 2020. We have broken out Qatari gas into a separate category from other potential FIDs, given the economics, buoyed by significant co-production of condensate and NGLs,  are so compelling. In other words the development of new trains is a question of when not if.

Credible potential FIDs

There is also an additional 86 mtpa of credible liquefaction projects that could potentially reach FID over the next 1-2 years.

  • In Mozambique the Anadarko-led project (12.7 mtpa), having recently signed its 5th SPA (with Pertamina) brings its long term contract coverage to 74% of capacity.  An FID is anticipated in 1H2019.
  • The Exxon-led Rovuma project in Mozambique (15.1 mtpa) is also reported to be advanced in securing offtake agreements and is also expected to take FID in 2019.
  • Canada’s Woodfibre project FID (2.1 mtpa) may also FID in 2019.
  • In Papua New Guinea Exxon/Total’s expansion project (7.9 mtpa) is also at an advanced stage and should take FID in 2019.
  • Novatek’s success in executing the Yamal LNG project has given them the confidence and momentum to move to the Arctic LNG project for which pre-FID engineering is progressing.  This 19.7 mtpa project is expected to take FID in 2019.
  • In the USA, credible FID’s in 2019 or 2020 include Sabine Pass train 6, Calcasieu (2 trains), Corpus Christi trains 4 and 5 and perhaps a little later, Freeport train 4.

A new wave takes shape

In summary, restarts and committed projects are anticipated to increase supply by around 49 mtpa by the mid 2020s.  There is another 32 mtpa of Qatari gas that will almost certainly come to market mid next decade, but with some uncertainty around timing.  In addition a further 86 mtpa of capacity has credible FID potential across the next 2-3 years. That’s a total of 167 mtpa of committed and credible new capacity.

The recent surge in LNG project FIDs is being driven by the perception of major LNG portfolio players that a global supply-demand gap is emerging early to mid next decade. This is different to the current wave of supply, driven by ‘demand pull’ from end-user buyers willing to sign up to long term contracts.

The uncertainty created by this year’s ongoing slump in European & Asian spot prices will impact the pace of new FIDs. It is harder to sign off projects against a backdrop of plunging prices. If players get cold feet this year, FID timings may slip e.g. Qatar, Russian and US projects. But there is significant momentum building behind a new wave of LNG supply from the mid 2020s, similar to those experienced from 2015-20 and 2006-10.

But will this next wave arrive in time to prevent a tight LNG market in the 2022-25 horizon?  That will depend largely on the strength of Asian LNG demand growth and the volume of new FIDs taken over the next 12 months.

Shell, Limejump, Gridserve & business model evolution

Two deals were announced at the end of February that highlight two structural trends transforming European energy markets:

  1. Small players driving innovation &
  2. Large incumbent players looking to diversify business models.

Deal 1: Gridserve sets out a new model for unsubsidised solar + batteries

UK based developer Gridserve has agreed a deal with a local council (in Warrington) to build a large unsubsidised solar plus battery storage project.  The project consists of 60 MW of latest solar farm technology and 27MW of battery storage, with construction financed via private capital.  The council will own the assets once operational, but Gridserve will operate and maintain them.

Deal 2: Oil & gas major Shell acquires power aggregator Limejump

Shell announced its acquisition of Limejump, a digital platform based aggregator of decentralised flexibility (e.g. engines, batteries, DSR). This deal follows Shell’s acquisition of German residential battery producer Sonnen (earlier in Feb) and UK retailer First Utility (in 2017).

The first deal is one of many current examples of innovation being driven by smaller players. The second deal reflects a growing desire by large incumbents to diversify portfolio risk and look for new growth opportunities.

Small player innovation

European gas & power markets were dominated by large vertically integrated utilities in the 2000s.  Boardrooms were focused on acquisition and aggregation as a way to gain scale. But the financial crisis left the balance sheets of many companies overextended.

This decade has seen a steady erosion of utility dominance, coinciding with a rapid growth in the role of smaller players and new entrants, particularly in the power sector.

These companies tend to be innovative, nimble and unconstrained by the rigid structures of large utilities & producers.  They are particularly well suited to developing more effective customer relationships in increasingly decentralised markets, typically with lower cost overheads than incumbent players.

Examples of areas where smaller players are making inroads:

  1. Aggregators: smaller companies such as Limejump, UKPR and Flexitricity are leading the aggregation of flexible distribution connected resources such as engines, batteries and demand side response.
  2. Retailers: Growth in new entrant retailers (e.g. Smartest Energy, Ovo & Octopus) has been particularly prominent in the UK, although not all of these have survived the ‘risk management 101’ test.
  3. Developers: Gridserve is only one example of dozens of smaller innovative companies & funds developing power assets across solar, gas peakers, storage, DSR and onshore wind.

But as these smaller companies grow, they become prime targets for acquisition by incumbent utilities and producers looking to diversify portfolio exposures and access new growth opportunities. Some examples of this are set out in Table 1.

Table 1: Large incumbents swallowing smaller innovators

Large player diversification

Europe’s incumbent utilities and producers have large centralised asset bases, focused in most cases on production and consumption of hydrocarbons.

The hydrocarbon based businesses of these companies may remain profitable for decades, particularly gas & LNG portfolios as demand grows in developing markets. But boardrooms are increasingly focusing on three key risks to long term margin and growth potential:

  1. Decarbonisation
  2. Decentralisation
  3. Rapid technology innovation

These risks are driving large incumbent players to gradually transition their business models. This is happening via a shift in focus to new growth areas including renewables, distributed energy, trading, LNG, hydrogen and energy services. Four case studies of business model transition are shown in Diagram 1.

Diagram 1: Case studies in business model transition

The diagram also highlights the important role that the acquisition of small companies is playing in facilitating business model transitions. Innovative smaller companies represent relatively ‘cheap options’ for large incumbents looking to diversify and grow. Acquisition can also provide an accelerated ramp up in customer relationships, technology & software and specialist expertise.

But successful acquisition & integration can be challenging. The more rigid governance structures and bureaucracy of large utilities & producers can often undermine the innovative success of a standalone smaller player. It can also be difficult to integrate the management, culture and skill sets of new business areas with the much larger existing core businesses, as evidenced by the previous attempts of oil majors to break into renewable energy.

If these integration hurdles can be overcome, large incumbents can provide three key things that unlock value: (i) access to capital and corporate resources to facilitate scaling (ii) the commercial capability to manage market risk and (iii) the ability to influence policy makers. It is those drivers and a continued appetite for diversification that are likely to support a continuation of the current acquisition trend.