For several years we have framed the evolution of the LNG market supply & demand balance around one key driver: Asian demand growth. The ability of the market to absorb more than 100 mtpa of committed new supply across 2015-21 depends on Asia. But Asian demand growth has stalled in 2019.
2019 and 2020 are the peak delivery years for the current wave of new liquefaction projects. Global LNG supply has risen by around 12% in H1 2019 (vs H1 2018). But Asian demand growth has ground to a halt (down 0.2% H1 2019 vs 2018). The Latin America & MENA regions are not helping either, with demand contracting by 21% across the same period (after strong 2018 growth).
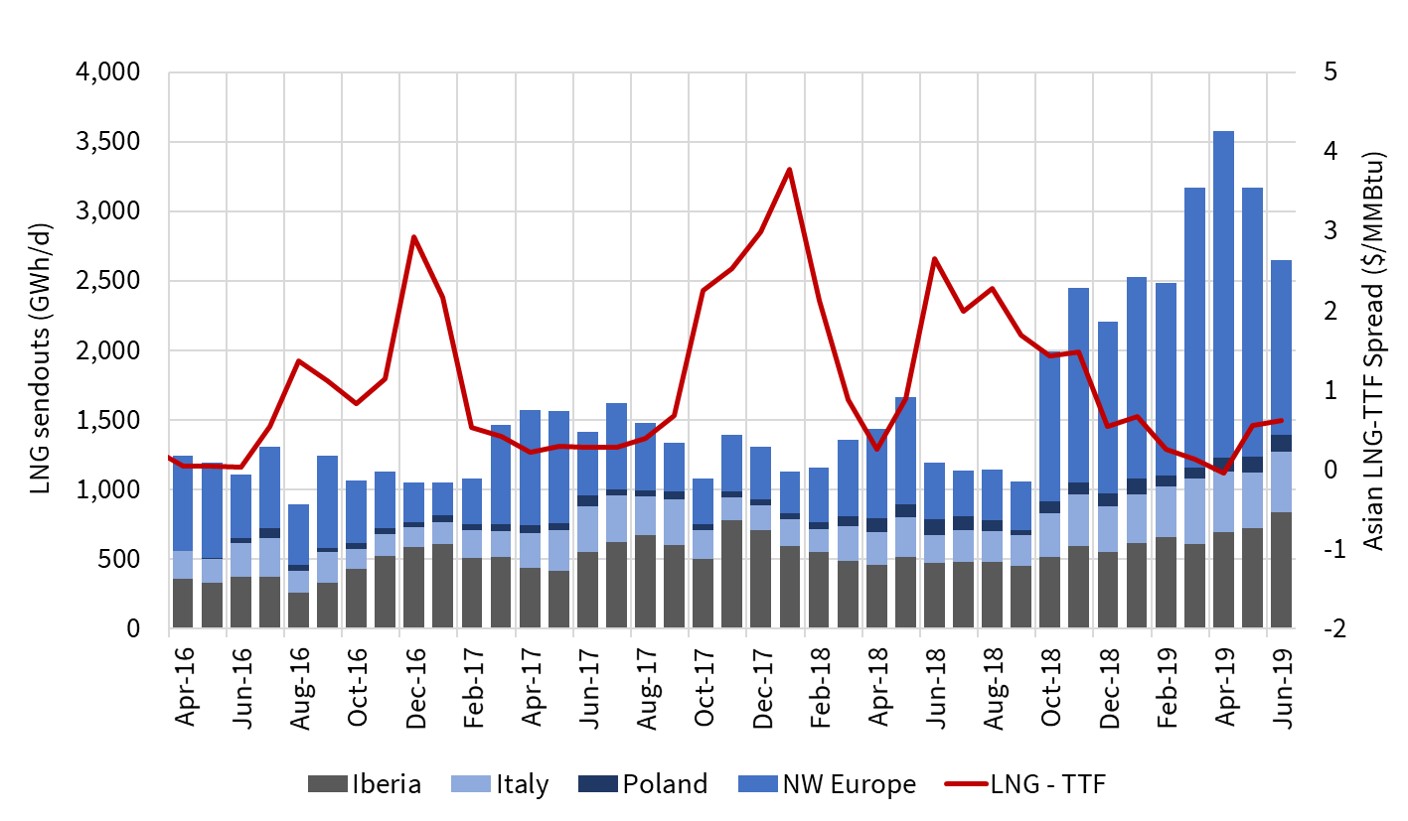
That leaves Europe having to absorb the full brunt of incremental LNG supply volumes. This is why LNG imports into Europe have surged this year, with hub prices have been pushed down towards Henry Hub support levels.
What happened to Asian demand growth?
Chart 1 shows the evolution of Asian, Latin American and MENA LNG demand since 2016.
Chart 1: Non-European LNG demand
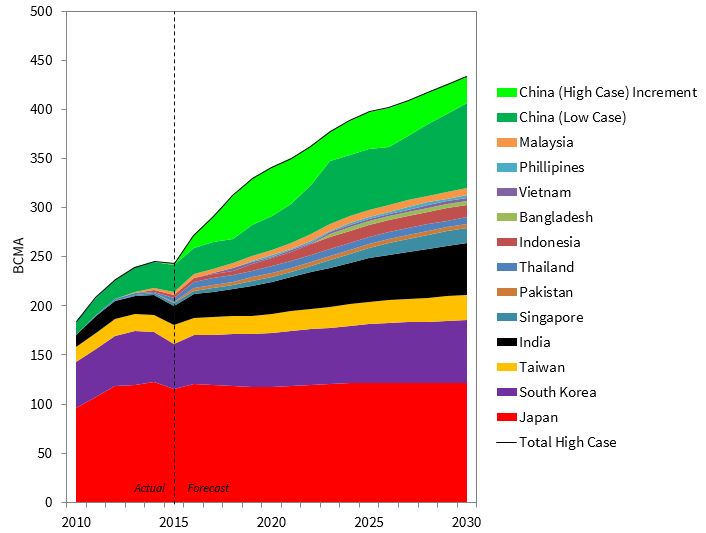
Source: Timera Energy
Across 2016 and 2017, Asia looked to be on a high demand growth trajectory, led by China. Asian demand was absorbing new liquefaction output as well as pulling flexible LNG supply from Europe (particularly across winter).
Chart 1 shows the steady progression of growth in demand from Winter 15/16 to Winter 17/18. But demand growth weakened into Winter 18/19 and has continued to stall in 2019. It is no coincidence that this has happened at the same time as a sharp decline in Asian and European gas prices since Sep 2018.
Table 1 shows the breakdown of demand in H1 2018 vs H1 2019 as well as % changes.
Table 1: Demand breakdown H1 2018 vs 2019
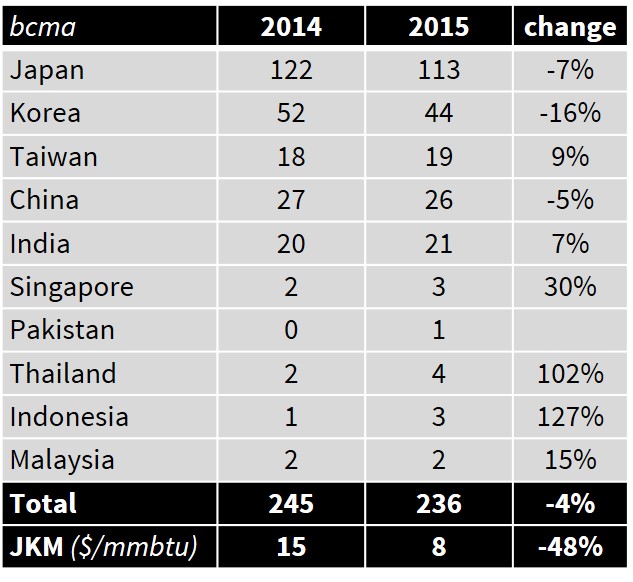
Source: Timera Energy
Four of the big 5 buyers (Japan, Korea, Taiwan and India) had negative growth (H1 19 vs 18). Chinese demand grew at 21%, but this is only around half the demand growth rate China was experiencing in 2016-17. 50% demand growth in the smaller emerging Asian markets is impressive, but is coming off a low base and is relatively low in absolute volume terms.
One of our 5 surprises for 2019 was a drop in global gas demand growth due to weakening economic conditions. That is what is playing out in Asia, exacerbated by tariffs in a growing ‘tit for tat’ trade war that materially escalated last week.
LNG driving the European price snowplough on
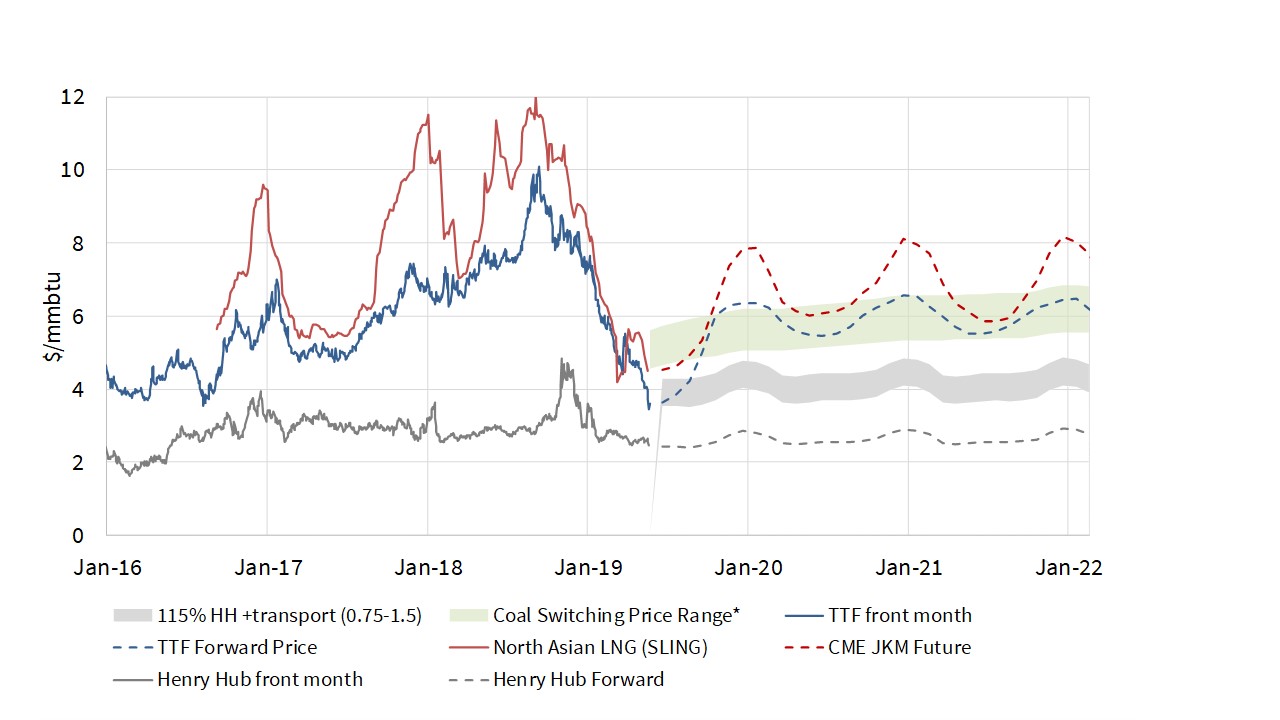
LNG that is surplus to Asian, Latam & MENA requirements, is absorbed by Europe’s liquid & price responsive gas hubs. As we set out in July, the growing surplus of LNG flowing into Europe in 2019 is having a ‘snowplough’ effect on the TTF forward curve as shown in Chart 2.
Chart 2: The snowplough continues to roll towards winter
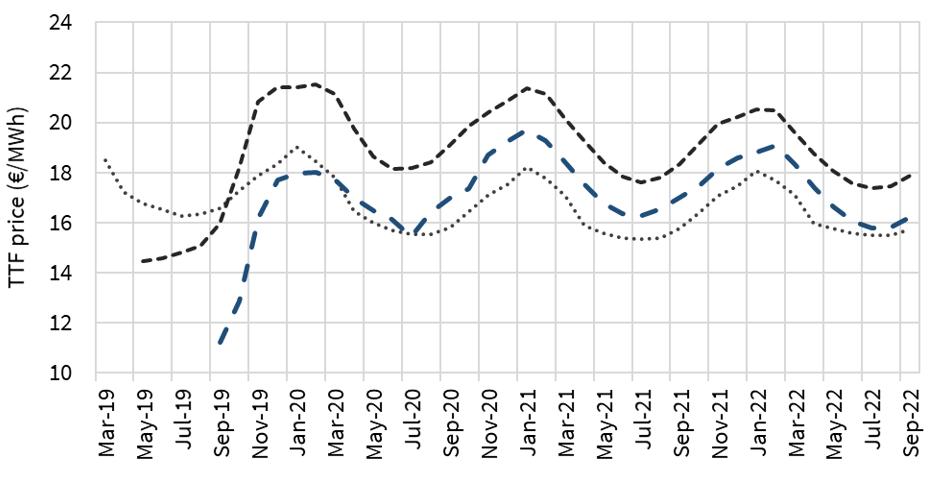
Source: Timera Energy
The very steep front section of the TTF curve reflects market consensus that the current acute oversupply will normalise as demand picks up into this winter. Recovery is being helped by some output curtailment in late summer e.g. Cheniere’s maintenance outages at Sabine Pass and Corpus Christi.
But as evidence of soft demand & weakening economic conditions has continued to emerge across this year, Winter 2019/20 prices have also been declining. Negative Q2 economic growth in Germany and the UK and looming recession fears across Europe are not helping.
Weak prices now… sharper 2020s recovery?
The cyclical nature of the LNG market is underpinned by 5 year lead times for new liquefaction projects. Final Investment Decisions (FIDs) on LNG projects coming to market now were taken in the first half of this decade in a relatively tight post-Fukushima market. But only a small volume of new FIDs were taken across 2015-2017. Even 2018 FID volumes were relatively low, dominated by the large Shell Canada project.
2019 is shaping up to be a higher volume year for FIDs, with Exxon’s Golden Pass and Andarko’s Mozambique projects already approved. But current market conditions may cause some investors to hesitate or delay on 8-10 other LNG projects that are targeting FID over the next two years. A recovery of European and Asian gas prices this winter will be an important factor here.
Asian LNG demand growth may have stalled in H1 2019, but this is a temporary phenomenon. Supply growth is set to remain strong through 2020 and into 2021, so sluggish demand over this period may see a continuation of weak price conditions.
But beyond 2021, the impact of the liquefaction investment hiatus from 2015-17 kicks in. In other words committed new supply growth is likely to fall behind global demand growth on a run rate basis. It is this period from 2022-24 that could see a tight market if FIDs are delayed over the next year or two.trend.
| 3 new members join our growing Timera team Jon Brown joins us from EDF, Steven Coppack from Total & Tommy Rowland from Smartest Energy. As with all of our team members, they have a strong practical background in commercial analytics from their industry roles. More details on Steven, Jon & Tommy on Our Team page. |