Author: David Duncan

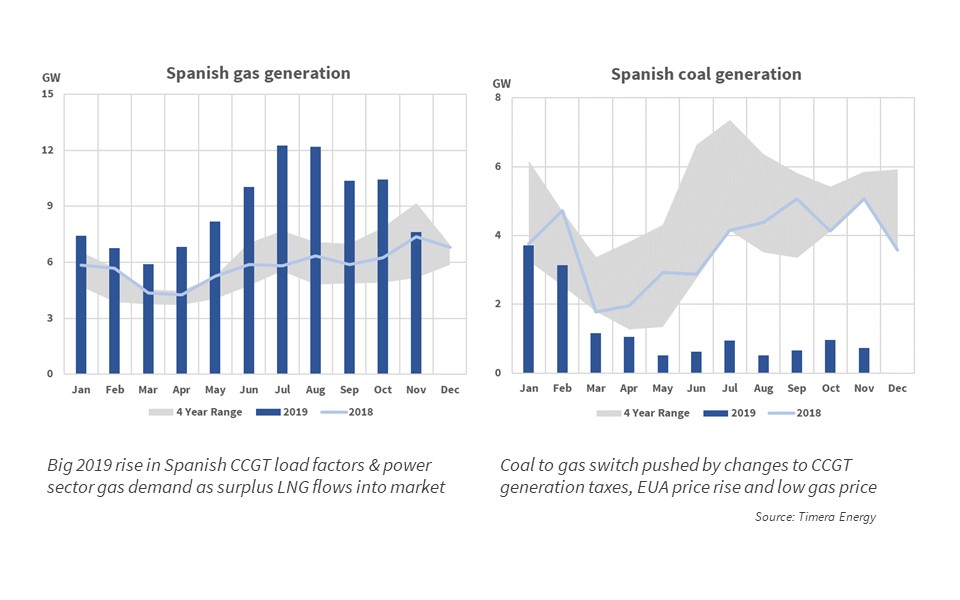
Spanish LNG imports switch out coal
Hydrogen’s path into the gas supply chain

5 chart focus: European gas market

5 chart focus: Continental European power

Revenue stacks for the ‘big 5’ flexible assets

Tommy Rowland joins Timera

UK capacity market ‘back in play’

Valuing European LNG regas capacity

European regas capacity is back & flashing on the commercial radar screen. The obvious explanation for this is a jump in terminal utilisation over the last 12 months as Europe absorbs surplus LNG.
There are however other structural drivers behind a renewed interest in regas capacity. Liquid hub access is becoming more important as a means for portfolio players to optimise & hedge increasingly complex LNG portfolios. At the same time cargo diversion flexibility is increasing, supported by a wave of new US export capacity coming online across 2019-21.
This renewed focus on regas has been reflected in our client work across the last year. We have been engaged by several LNG portfolio players to analyse the valuation of regas capacity & its portfolio impact. We have also been engaged by terminal owners to look at valuation from a capacity monetisation perspective.
As a result of this work we have developed a framework for regas capacity valuation which we summarise in today’s article. We focus on NW Europe regas with liquid hub access (e.g. UK, NL, FR, BE, DE), but the principles apply more broadly to less liquid access points.
Chart 1: European LNG imports and JKM vs TTF price spread
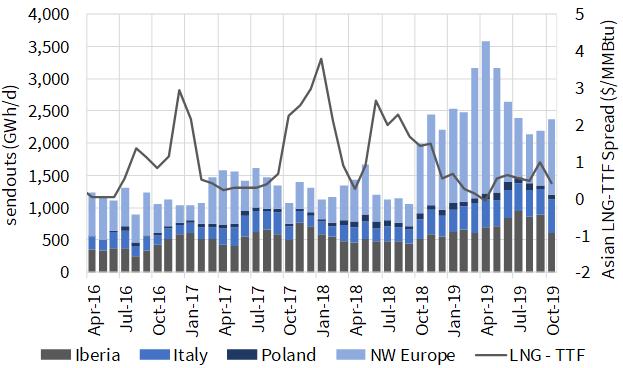
Source: Timera Energy
Regas value 101
Regas capacity is an option to regasify an LNG cargo and deliver it into a liquid hub.
Take a simple example of a LNG portfolio that owns a NWE LNG spot cargo off the coast of NW Europe. In the absence of regas capacity access, this cargo can only be monetised via sale of the spot cargo (at a relatively illiquid NWE spot price). If the cargo owner has regas capacity, the cargo can alternatively be monetised at a liquid hub (TTF or NBP).
If you want to get technical, regas capacity is essentially a strip of options on the spread between TTF and NWE LNG spot prices.
Regas capacity does not just support the monetisation of spot cargoes, but also the hedging of forward exposures. Take a US export supply contract as an example. This represents a strip of forward cargo exposures with diversion flexibility (e.g. to Europe or Asia). Regas capacity access allows these exposures to be hedged on a forward basis against the liquid TTF (or NBP) forward curve and then optimised or re-hedged over time against the less liquid JKM curve.
4 building blocks of regas value
In order to value regas capacity it is useful to deconstruct value into components. Diagram 1 summarises four building blocks of value.
Diagram 1: Regas capacity value components
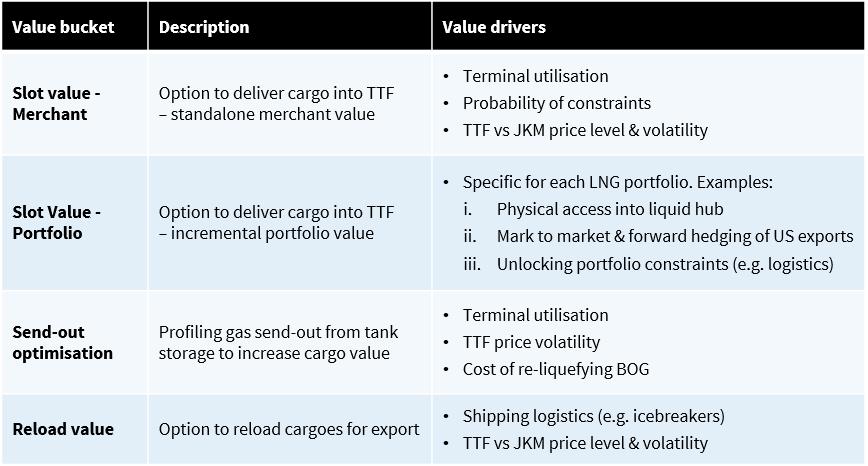
Source: Timera Energy
1.Merchant slot value
First we consider the merchant or standalone value of regas capacity, in the absence of any other portfolio components. Merchant slot value is currently limited by the fact that there are no structural constraints around NW European regas capacity access. Across UK, Netherlands, France & Belgium there are plenty of spare regas slots under normal market conditions.
Merchant slot value is a function of the expected probability of slot utilisation multiped by the price (or value) of regas capacity when it is utilised. For regulated terminals this price is the regulated tariff. For TPA exempt terminals, regas slot pricing is also driven by regulated tariff levels as these represent the opportunity cost of alternative terminal access (in the absence of any NW European regas constraints).
Temporary regas capacity constraints can occur. For example, supply outages caused some UK regas capacity constraints in 2018 (during the ‘beast from the east’ cold weather pattern). High import volumes have also seen GATE constrained during periods in 2019. These constraints can cause merchant slot value to rise above regulated tariff levels. However limited secondary trading of regas slots, means this incremental value typically accrues to LNG portfolios with the flexibility to bring FOB cargoes into constrained terminals (see 2. Portfolio slot value below).
Over the next decade, the volume growth of flexible LNG is set to substantially outstrip planned investment in new European regas capacity. That means the probability of European regas constraints is likely to rise as (i) terminal utilisation increases with import volumes and (ii) regas capacity headroom declines. This structural tightening is an important driver of recovery in regas capacity value in the 2020s.
2.Portfolio slot value
The primary driver of a company’s willingness to pay for regas slots is the incremental value that regas creates when added to an LNG portfolio. Regas capacity can add optionality (e.g. facilitating diversion) or unlock constraints (e.g. access to liquid hub prices). These sources of value can be substantial given the limited liquidity & complex supply chain logistics of the LNG market.
Lets consider a practical example of portfolio value. A number of Asian buyers have US export contract volumes (e.g. JERA, Osaka Gas, GAIL, Sumitomo). These companies place significant portfolio value on physical access to TTF or NBP liquidity. This value is driven by the ability to manage supply contract risk and mark to market forward cargo exposures against a liquid curve. But it also allows value creation from forward hedging of diversion flexibility based on fluctuations in TTF vs JKM price spreads.
The challenge in quantifying portfolio value is that it is heavily dependent on the bespoke components of an individual portfolio. There is added complexity as to whether the value created by adding regas actually accrues to the regas slots or to other existing components of the portfolio e.g. flexible supply contracts.
However one thing is clear. A portfolio modelling capability is required to effectively quantify the incremental value of adding regas capacity. This capability allows the analysis of the interaction between evolution of pricing dynamics and portfolio exposures. We provide a simple illustration in the blue box below.
- Send out optimisation value
Value can be created by optimising the profile of send out from tanks at regas terminals against market prices. Send-out is effectively a single direction storage option (with no injection rights) and can be valued as such with stochastic storage modelling techniques.
However there are practical limitations on the value of send out optionality. It is typically limited by operational constraints e.g. requirement to retain inventory to keep tanks cool during periods of low utilisation or to empty tanks quickly to free up capacity for incoming cargos during periods of high utilisation.
It is not so often that tanks are in ‘sweet spot’ inventory levels e.g. 40-60%, and the value of holding high levels of inventory is also usually eroded by boil off gas (BOG) losses. Terminals with the capability to re-liquify BOG can have higher send-out value as this removes the requirement to manage low inventory levels and loss of BOG.
4.Reload value
Some terminals have the capability to reload cargoes. This can allow capacity holders to circumvent destination clause restrictions in supply contracts. It can also create value via alleviating logistics constraints e.g. the reload of cargoes from Yamal icebreakers at NW European terminals allows more efficient deployment of these vessels on artic routes.
Both these sources of value are driven by contractual or logistical dynamics within specific portfolios. This again points to a LNG portfolio model to effectively value reload optionality.
Enabling reload in regas terminals typically involves low capex. There are also relatively low barriers to entry. These factors effectively cap the amount of value that can be assigned to reload optionality in the longer term.
Pulling component values together
Regas slots suffer from a lack of price transparency, given there is no liquid secondary market for capacity. The valuation of regas capacity is further complicated by the fact that it needs to be quantified as part of a company’s broader portfolio strategy. The value that slots create for an Asian buyer may be very different in size and nature to that for a commodity trader.
However the analytical approach to valuing regas capacity is becoming more consistent. And this focuses on using a portfolio valuation modelling framework to practically analyse how regas slots create value via adding portfolio optionality and unlocking constraints. We provide further details on this in the briefing pack linked in the blue box below.
| Briefing pack: LNG portfolio value Timera briefing pack with approaches and case studies on identifying & capturing LNG value: Gaining an edge |
Charter rate surge shakes LNG market
LNG vessel spot charter rates have exploded since late September. If you are not in the business of chartering boats you may be tempted by an obvious question… ‘who cares?’
Spot charter rates have much broader market implications. The delivery of LNG cargoes is increasingly being optimised against spot price signals. Margin opportunities in moving LNG between regions depends on the cost of transportation. This means that shipping cost differentials have become key drivers of LNG flows & regional price spreads, as well as LNG portfolio value opportunities.
LNG flows have also been the primary driver of European gas market supply & demand dynamics across the last year. Forward market pricing points to this continuing across 2020-21. And European LNG import levels also determine the volume of surplus gas absorbed by European power markets via switching.
The upshot of this interconnected market logic is that quite a few people care what happens to charter rates. In today’s article we take a look at why rates have soared and what the market impact may be.
The charter rate rollercoaster
Most of the global LNG shipping capacity is under term charter to portfolio players. This means there is typically only relatively small volumes of capacity available on a spot basis e.g. for traders wanting to take advantage of arbitrage opportunities.
Limited spot liquidity exacerbates the price impact of any adjustments to supply and demand. This can be seen in Chart 1 which shows the evolution of spot charter rates this decade.
Chart 1: LNG spot vessel charter rates
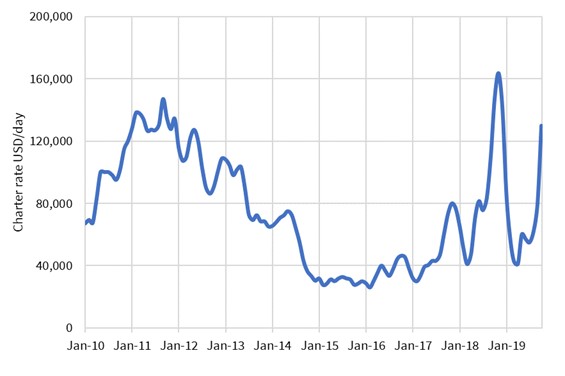
Source: Timera Energy
The Fukushima disaster in 2011 caused a sharp rise in charter rates as incremental shipping capacity was required to move large volumes of LNG to Japan as nuclear plants closed. Tightness then eased into mid-decade as a wave of new vessels were commissioned.
Charter rates surged again in 2018 as new liquefaction projects came online and cargos were diverted from Europe to Asia (with longer average voyage times). This was a short lived phenomena as Asian demand softened in Q4 2018 and large volumes of LNG flowed back into Europe.
The 2019 charter rate surge
Spot charter rates have quickly surged from below $50k per day this summer to above $130k per day by mid October. This translates into roughly 1.20 $/mmbtu cost increase for a spot charter voyage from US to Asia (assuming round trip costs).
So what is behind the move? A key catalyst has been the US sanctions slapped on state-owned Chinese shipping company Cosco for breaching Iranian oil sanctions. This has effectively ‘blacklisted’ a number of vessels operating under long term charter e.g. from Tangguh in Indonesia, Bintulu in Malaysia and the North West Shelf in Australia. The sourcing of replacement vessels in the spot market has driven up rates.
Four icebreakers used to transport LNG from the Yamal peninsula were also impacted by sanctions, given a Teekay JV with a Chinese company owned by Cosco. But this issue was resolved last week via an ownership restructure that circumvented the sanctions.
The Cosco issues have grabbed headlines but there are a couple of other factors behind the recovery in charter rates:
- Contango: Both TTF and JKM forward curves are in steep contango (rising forward prices) across the next two months. This reflects market normalisation from very weak prices across the summer. Curve contango is encouraging cargo owners to use LNG vessels as floating storage i.e. you get paid for delaying delivery of the cargo given rising prices.
- Distances: As new US export volumes come online, they are increasing average shipping distances, particularly if the LNG is flowing to Asia. This effectively increases utilisation of the global vessel fleet, acting to tighten supply and support charter rates.
Market impact: 3 factors to watch
The market impact of higher charter rates depends on whether the current surge is temporary and if not how higher rates will impact LNG flows. Three factors to consider:
- Work arounds: The Teekay solution for the Yamal icebreakers is a good illustration of the commercial incentives to develop work around solutions to allow vessels to continue operating. If this logic extends to other vessels impacted then the Cosco element of the problem may be a more temporary impact.
- Asian demand: Given tightness in the shipping market is linked to distances, the volume of cargoes flowing to Asia is important. Asian LNG demand has been weak so far across 2019, but may pick up into winter. The extent to which this happens should support charter rates into 2020. If demand remains weak then higher volumes of LNG are likely to continue to flow into Europe.
- US export economics: Netback prices on US export supply are impacted by higher charter rates. Higher rates increase US LNG shut in price levels. They also favour the economics of moving LNG to closer markets (e.g. Europe vs Asia).
We will keep an eye on the evolution of charter rates and the knock on impact on markets via our Snapshot column.